| Param | Original file | Final file |
|---|---|---|
| Filename | modeM0/AS1A12_054T02_9000005550_40577cztM0_level2.fits | modeM0/AS1A12_054T02_9000005550_40577cztM0_level2_quad_clean.evt |
| Size (bytes) | 305,804,160 | 89,743,680 |
| Size | 291.6 MB | 85.6 MB |
| Events in quadrant A | 2,999,011 | 625,979 |
| Events in quadrant B | 2,672,029 | 641,608 |
| Events in quadrant C | 2,554,545 | 596,118 |
| Events in quadrant D | 2,696,563 | 496,363 |
| Mode SS | |||
|---|---|---|---|
| Quadrant | BADHDUFLAG | Total packets | Discarded packets |
| A | 0 | 108 | 0 |
| B | 0 | 108 | 0 |
| C | 0 | 108 | 0 |
| D | 0 | 108 | 0 |
| Mode M0 | |||
|---|---|---|---|
| Quadrant | BADHDUFLAG | Total packets | Discarded packets |
| A | 0 | 11875 | 3 |
| B | 0 | 10945 | 2 |
| C | 0 | 10595 | 4 |
| D | 0 | 11414 | 2 |
| Mode M9 | |||
|---|---|---|---|
| Quadrant | BADHDUFLAG | Total packets | Discarded packets |
| A | 0 | 41 | 0 |
| B | 0 | 41 | 0 |
| C | 0 | 41 | 0 |
| D | 0 | 41 | 0 |
| Quadrant | Total seconds | Saturated seconds | Saturation percentage |
|---|---|---|---|
| A | 5095 | 17 | 0.333660% |
| B | 5095 | 18 | 0.353288% |
| C | 5093 | 17 | 0.333791% |
| D | 5095 | 581 | 11.403337% |
Noise dominated data is calculated using 1-second bins in cleaned event files. If a bin has >2000 counts, and if more than 50% of those come from <1% of pixels, then it is considered to be noise-dominated and hence unusable.
| Quadrant | # 1 sec bins | Bins with >0 counts | Bins with >2000 counts | High rate bins dominated by noise | Noise dominated (total time) | Noise dominated (detector-on time) | Marked lightcurve |
|---|---|---|---|---|---|---|---|
| A | 9282 | 5097 | 2 | 2 | 0.02% | 0.04% | 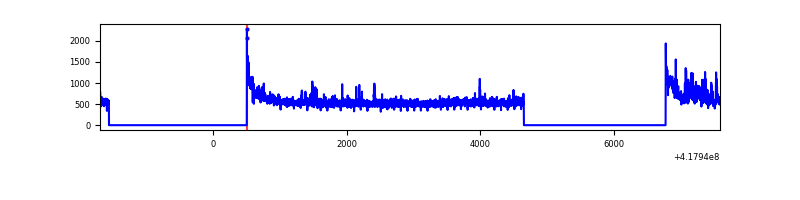 |
| B | 9282 | 5097 | 8 | 8 | 0.09% | 0.16% | 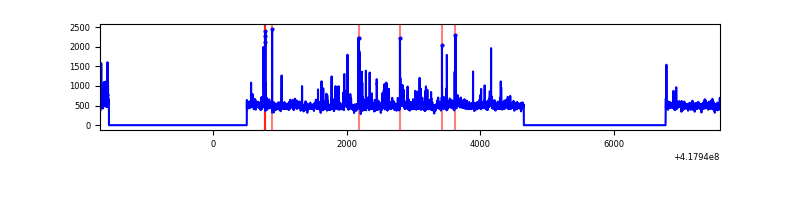 |
| C | 9282 | 5097 | 12 | 12 | 0.13% | 0.24% | 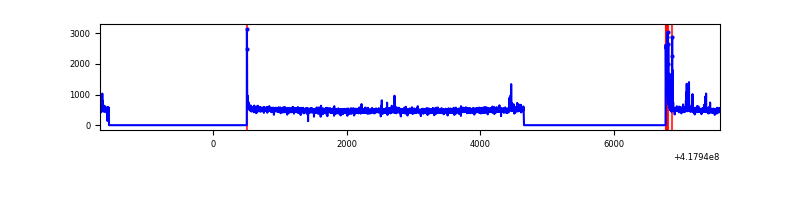 |
| D | 9282 | 5097 | 35 | 35 | 0.38% | 0.69% | 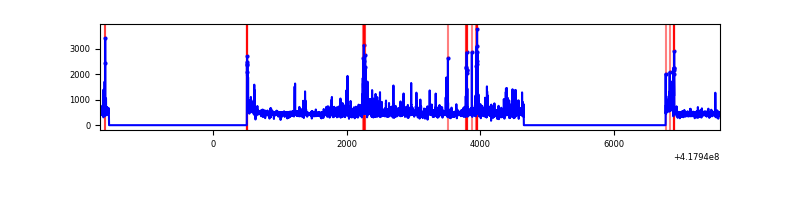 |
Top three noisy pixels from each quadrant. If the there are fewer than three noisy pixels in the level2.evt file, extra rows are filled as -1
| Pixel properties | Quadrant properties | ||||||
|---|---|---|---|---|---|---|---|
| Quadrant | DetID | PixID | Counts | Sigma | Mean | Median | Sigma |
| A | 10 | 83 | 481114 | 3989.92 | 594 | 585 | 120.4 |
| A | 12 | 189 | 153068 | 1266.09 | 594 | 585 | 120.4 |
| A | 15 | 191 | 45827 | 375.65 | 594 | 585 | 120.4 |
| B | 0 | 190 | 204478 | 1839.67 | 585 | 571 | 110.8 |
| B | 0 | 230 | 70354 | 629.59 | 585 | 571 | 110.8 |
| B | 3 | 112 | 26505 | 233.98 | 585 | 571 | 110.8 |
| C | 15 | 214 | 225567 | 1706.7 | 567 | 571 | 131.8 |
| C | 14 | 254 | 58793 | 441.64 | 567 | 571 | 131.8 |
| C | 0 | 10 | 47040 | 352.49 | 567 | 571 | 131.8 |
| D | 12 | 227 | 244626 | 1852.66 | 538 | 522 | 131.8 |
| D | 12 | 191 | 173496 | 1312.81 | 538 | 522 | 131.8 |
| D | 2 | 250 | 62871 | 473.21 | 538 | 522 | 131.8 |
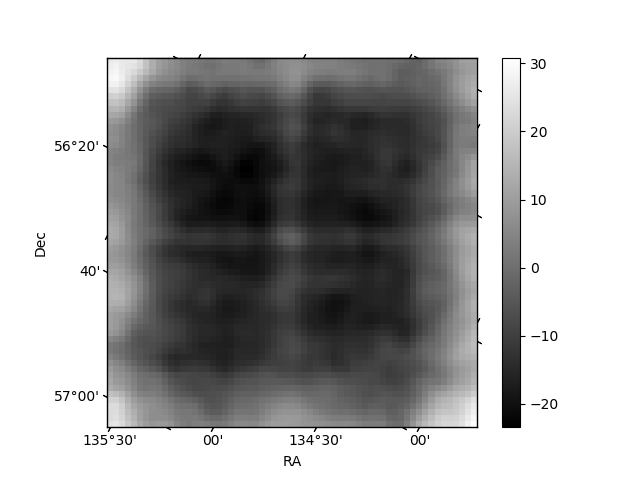
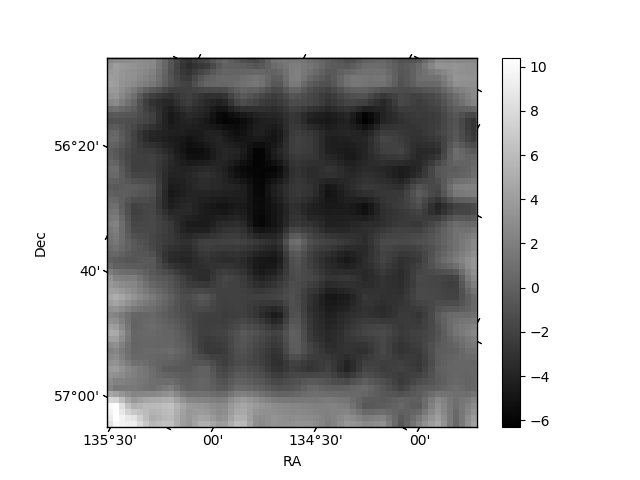
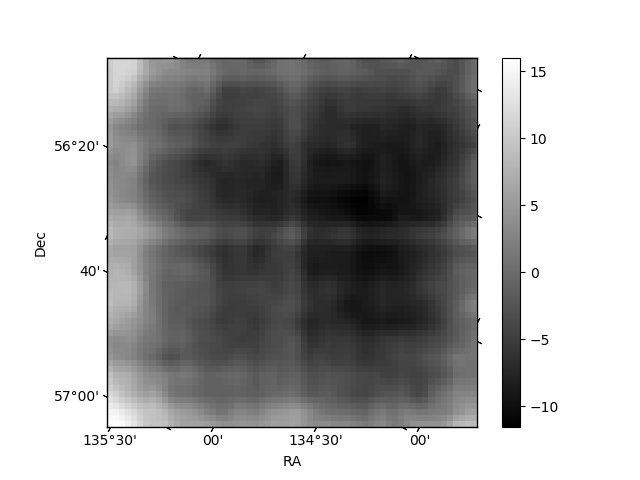
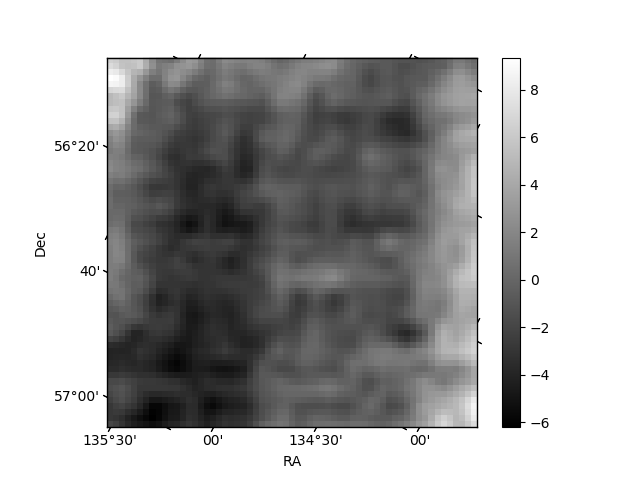
Histogram calculated using DETX and DETY for each event in the final _common_clean file
| Quadrant A | 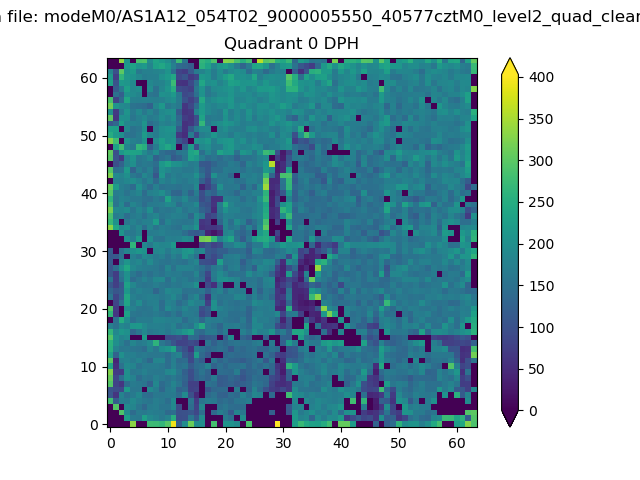 |
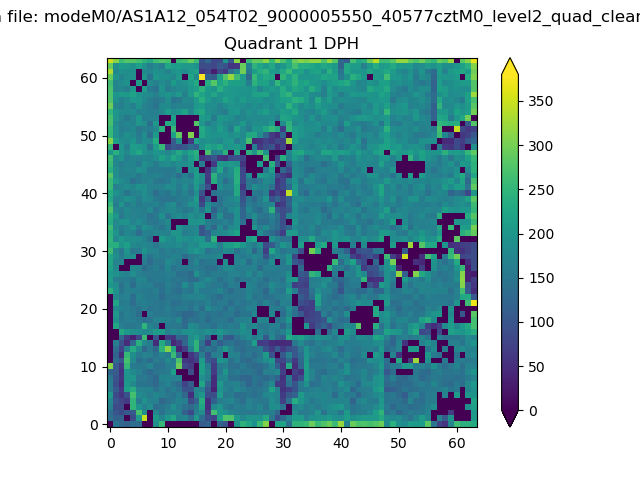 |
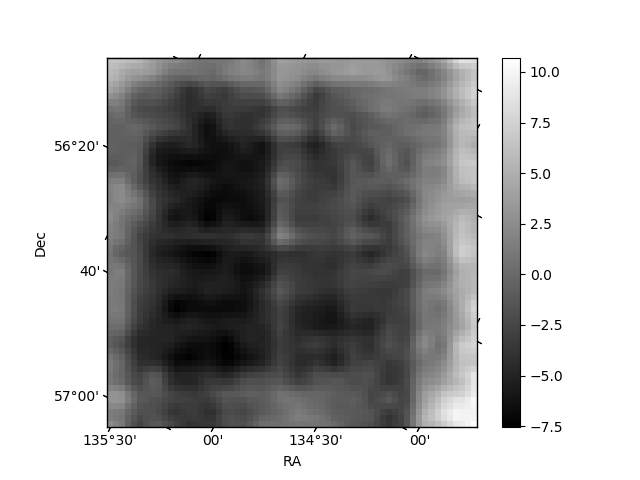
Quadrant B |
|---|---|---|---|
| Quadrant D |  |
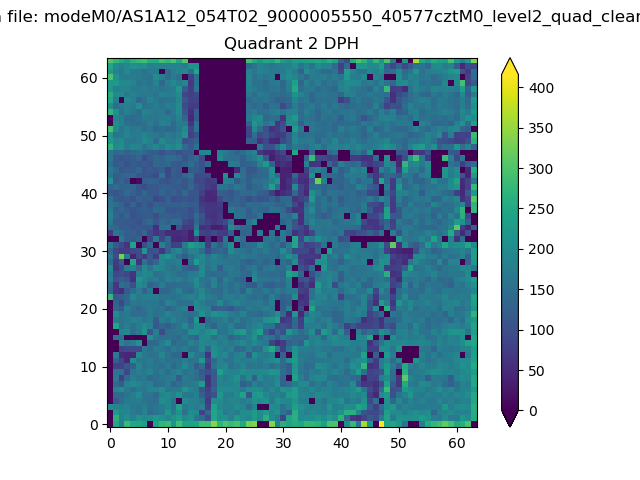 |
Quadrant C |
| Plot type | Count rate plots | Images |
|---|---|---|
| Comparison with Poisson distribution Blue bars denote a histogram of data divided into 1 sec bins. Red curve is a Poisson curve with rate = median count rate of data. |
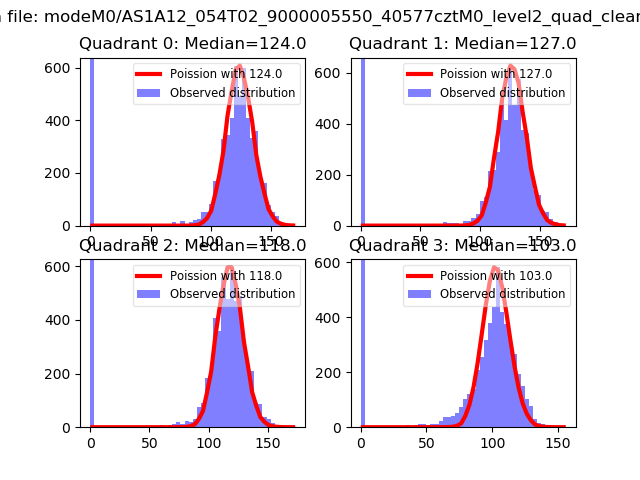 |
 |
| Quadrant-wise count rates Data is divided into 100 sec bins |
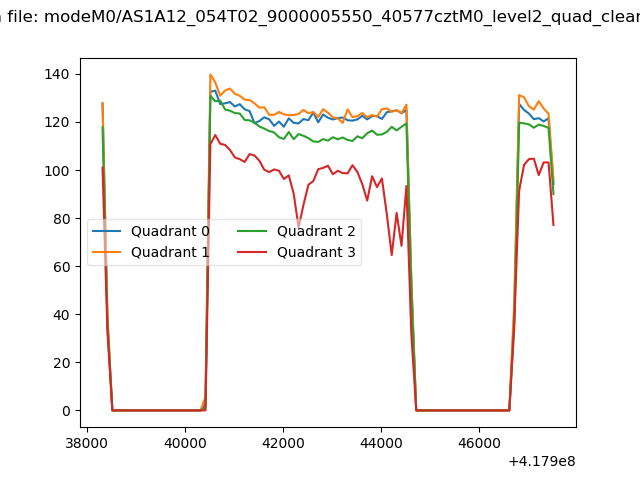 |
|
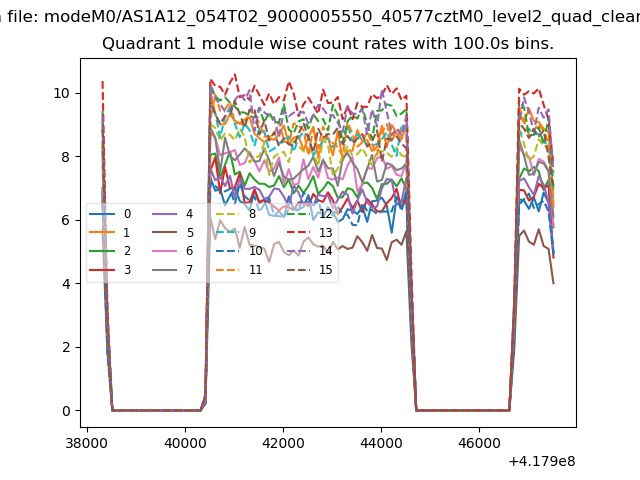
| Module-wise count rates for Quadrant A Data is divided into 100 sec bins |
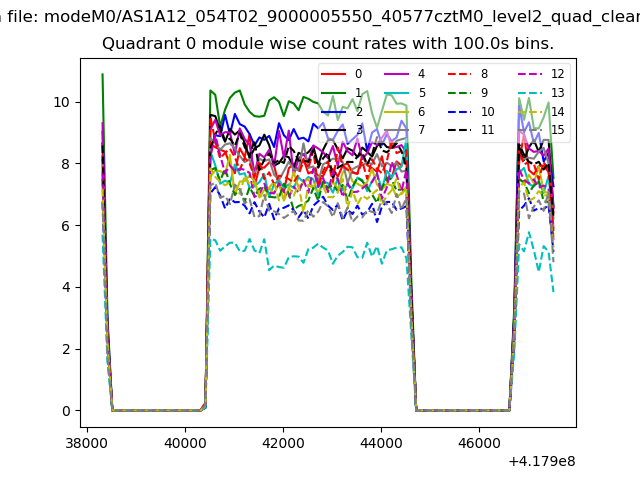 |
 |
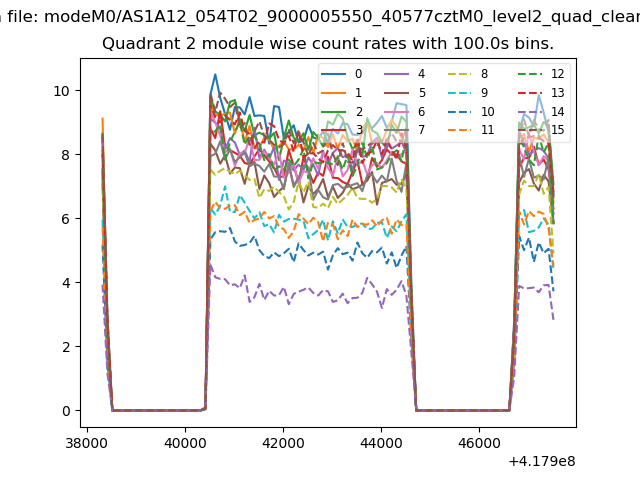
| Module-wise count rates for Quadrant B Data is divided into 100 sec bins |
 |
 |
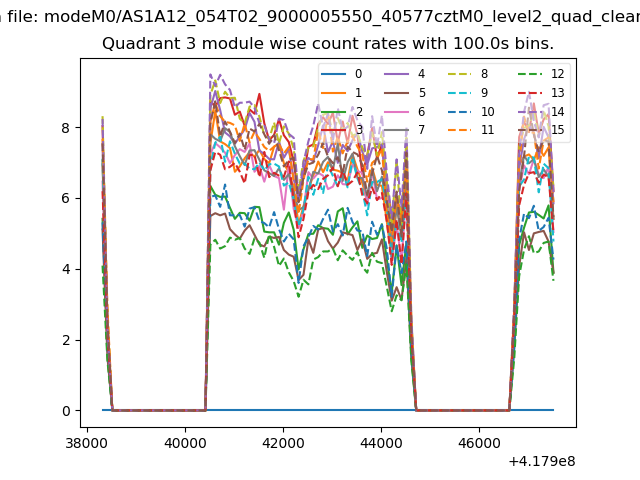
| Module-wise count rates for Quadrant C Data is divided into 100 sec bins |
 |
 |
| Module-wise count rates for Quadrant D Data is divided into 100 sec bins |
 |
 |
| Parameter | Plot |
|---|---|
| CZT HV Monitor | 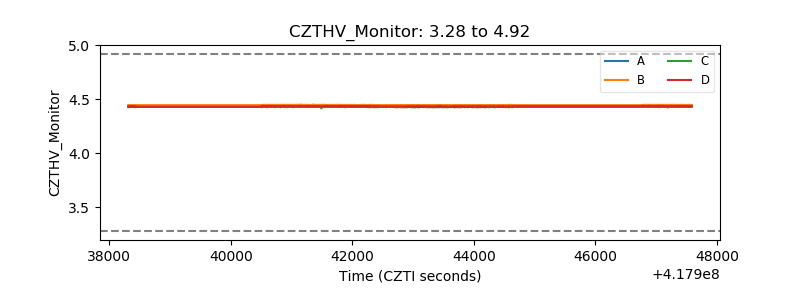 |
| D_VDD | 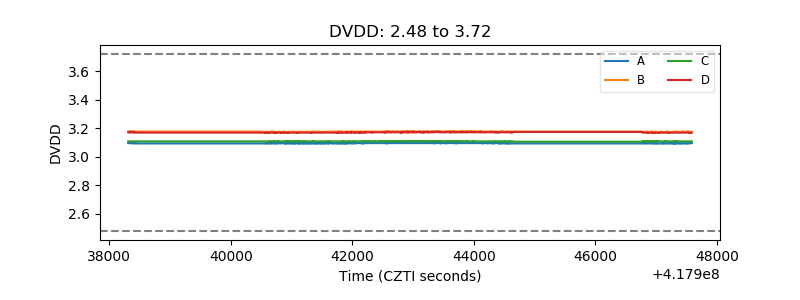 |
| Temperature 1 | 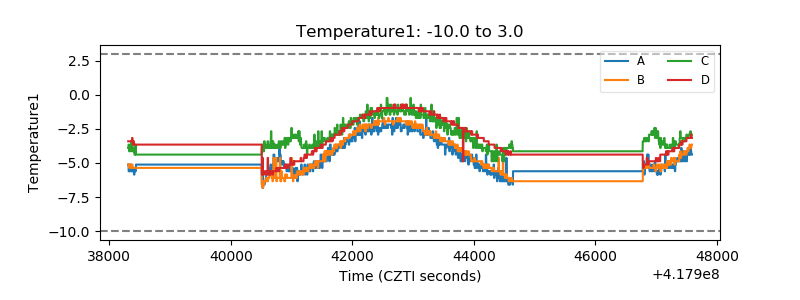 |
| Veto HV Monitor | 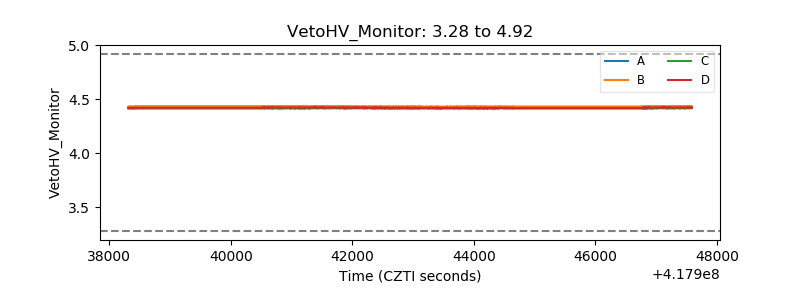 |
| Veto LLD | 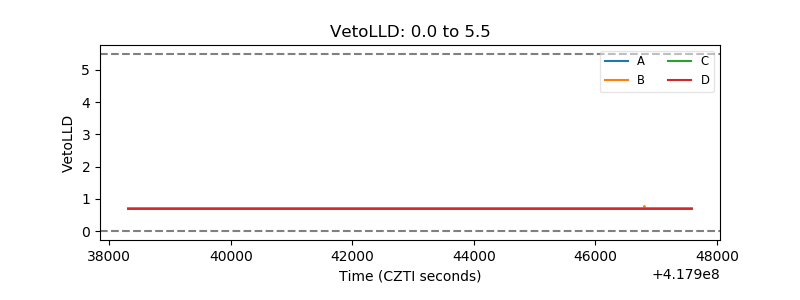 |
| Alpha Counter | 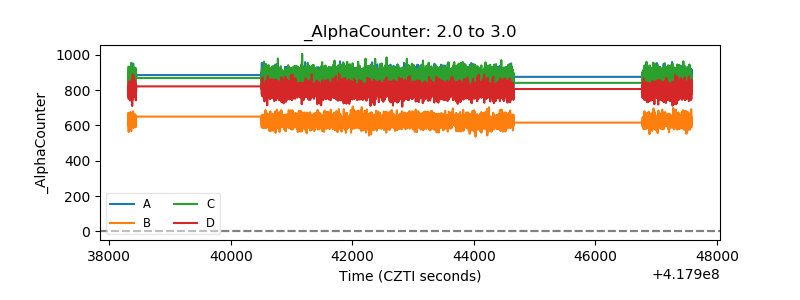 |
| _CPM_Rate | 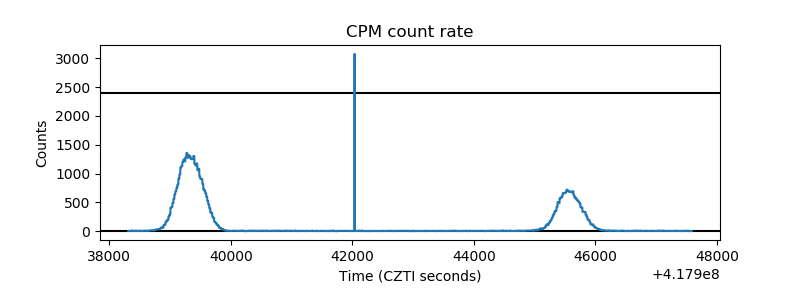 |
| CZT Counter | 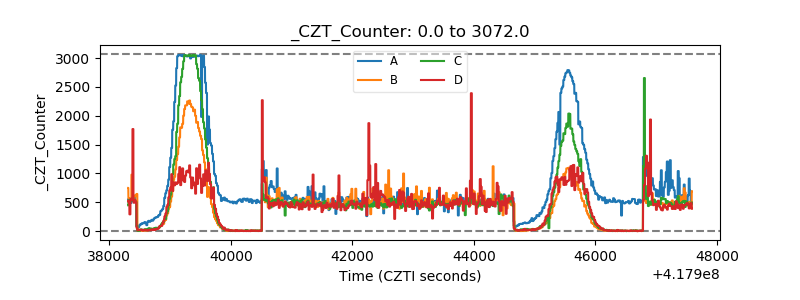 |
| +2.5 Volts monitor | 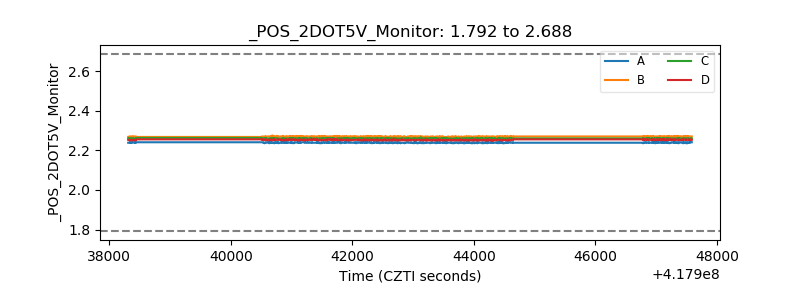 |
| +5 Volts monitor | 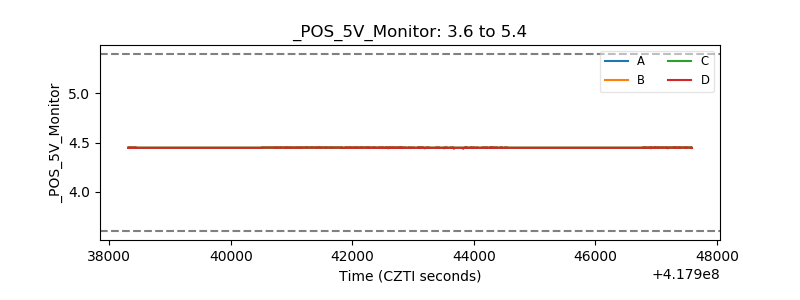 |
| _ROLL_ROT | 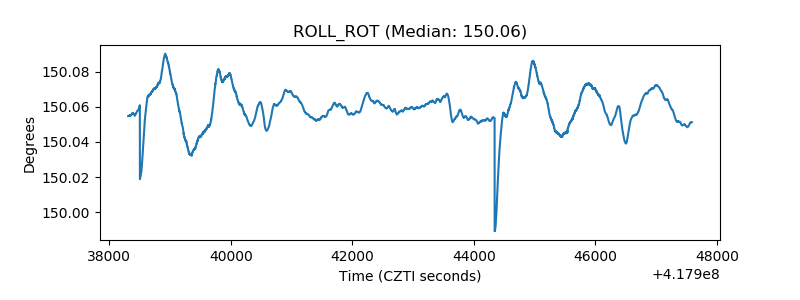 |
| _Roll_DEC | 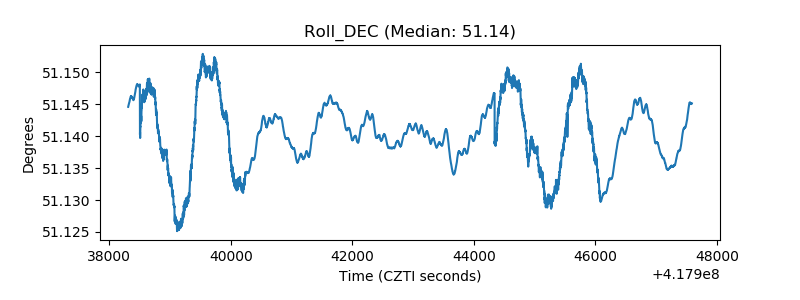 |
| _Roll_RA | 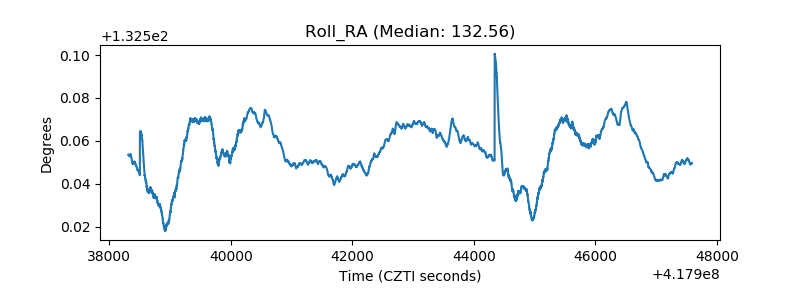 |
| Veto Counter | 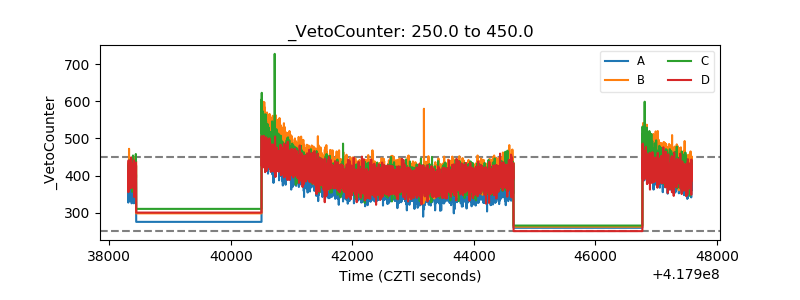 |