| Param | Original file | Final file |
|---|---|---|
| Filename | modeM0/AS1A12_054T02_9000005550_40578cztM0_level2.fits | modeM0/AS1A12_054T02_9000005550_40578cztM0_level2_quad_clean.evt |
| Size (bytes) | 318,654,720 | 83,292,480 |
| Size | 303.9 MB | 79.4 MB |
| Events in quadrant A | 2,882,470 | 585,022 |
| Events in quadrant B | 3,240,867 | 582,362 |
| Events in quadrant C | 2,490,621 | 556,742 |
| Events in quadrant D | 2,795,674 | 451,096 |
| Mode SS | |||
|---|---|---|---|
| Quadrant | BADHDUFLAG | Total packets | Discarded packets |
| A | 0 | 102 | 0 |
| B | 0 | 102 | 0 |
| C | 0 | 102 | 0 |
| D | 0 | 102 | 0 |
| Mode M0 | |||
|---|---|---|---|
| Quadrant | BADHDUFLAG | Total packets | Discarded packets |
| A | 0 | 11564 | 3 |
| B | 0 | 12747 | 2 |
| C | 0 | 10426 | 2 |
| D | 0 | 11659 | 2 |
| Mode M9 | |||
|---|---|---|---|
| Quadrant | BADHDUFLAG | Total packets | Discarded packets |
| A | 0 | 28 | 0 |
| B | 0 | 28 | 0 |
| C | 0 | 28 | 0 |
| D | 0 | 29 | 0 |
| Quadrant | Total seconds | Saturated seconds | Saturation percentage |
|---|---|---|---|
| A | 4942 | 16 | 0.323756% |
| B | 4942 | 163 | 3.298260% |
| C | 4942 | 20 | 0.404694% |
| D | 4942 | 742 | 15.014164% |
Noise dominated data is calculated using 1-second bins in cleaned event files. If a bin has >2000 counts, and if more than 50% of those come from <1% of pixels, then it is considered to be noise-dominated and hence unusable.
| Quadrant | # 1 sec bins | Bins with >0 counts | Bins with >2000 counts | High rate bins dominated by noise | Noise dominated (total time) | Noise dominated (detector-on time) | Marked lightcurve |
|---|---|---|---|---|---|---|---|
| A | 7065 | 4943 | 0 | 0 | 0.00% | 0.00% | 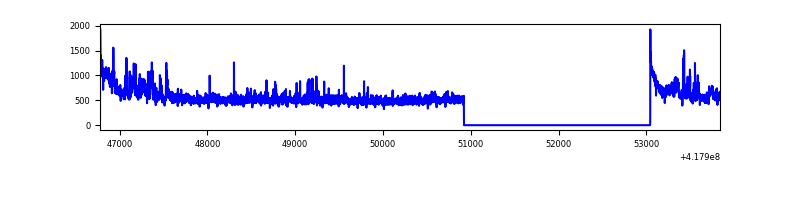 |
| B | 7065 | 4943 | 143 | 143 | 2.02% | 2.89% | 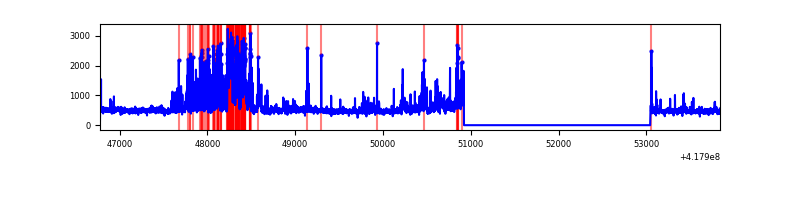 |
| C | 7065 | 4943 | 15 | 15 | 0.21% | 0.30% | 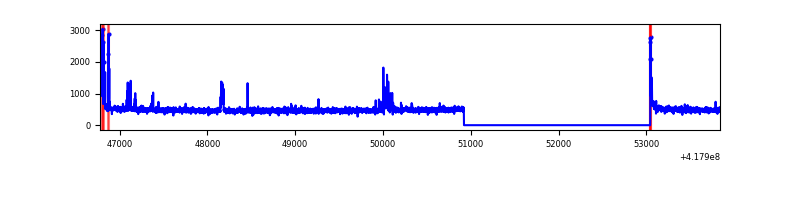 |
| D | 7065 | 4943 | 78 | 78 | 1.10% | 1.58% | 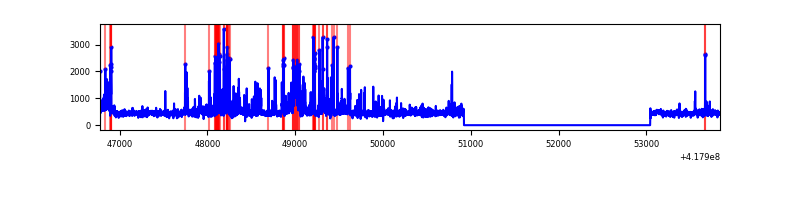 |
Top three noisy pixels from each quadrant. If the there are fewer than three noisy pixels in the level2.evt file, extra rows are filled as -1
| Pixel properties | Quadrant properties | ||||||
|---|---|---|---|---|---|---|---|
| Quadrant | DetID | PixID | Counts | Sigma | Mean | Median | Sigma |
| A | 10 | 83 | 473367 | 4166.76 | 559 | 549 | 113.5 |
| A | 12 | 189 | 146199 | 1283.56 | 559 | 549 | 113.5 |
| A | 15 | 191 | 58983 | 514.96 | 559 | 549 | 113.5 |
| B | 0 | 190 | 857134 | 8246.51 | 547 | 533 | 103.9 |
| B | 3 | 112 | 64246 | 613.37 | 547 | 533 | 103.9 |
| B | 0 | 230 | 55970 | 533.69 | 547 | 533 | 103.9 |
| C | 15 | 214 | 221093 | 1753.62 | 538 | 541 | 125.8 |
| C | 14 | 254 | 98745 | 780.82 | 538 | 541 | 125.8 |
| C | 0 | 10 | 63222 | 498.38 | 538 | 541 | 125.8 |
| D | 12 | 227 | 226619 | 1842.51 | 501 | 487 | 122.7 |
| D | 12 | 191 | 188209 | 1529.55 | 501 | 487 | 122.7 |
| D | 10 | 34 | 151580 | 1231.1 | 501 | 487 | 122.7 |
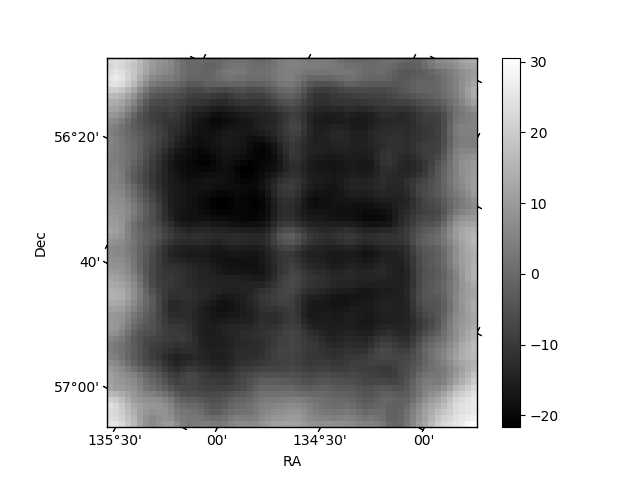
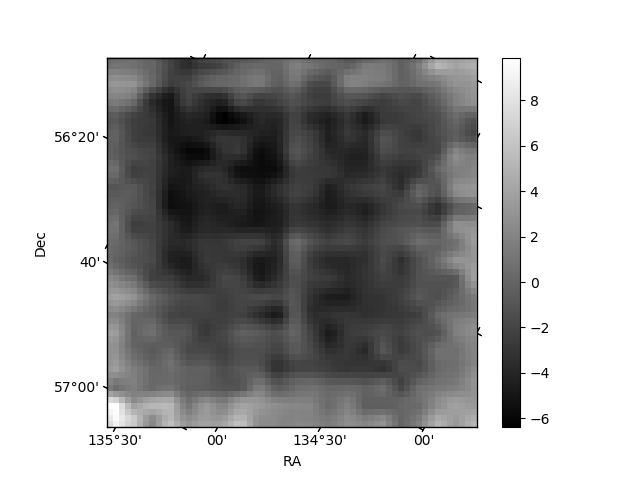
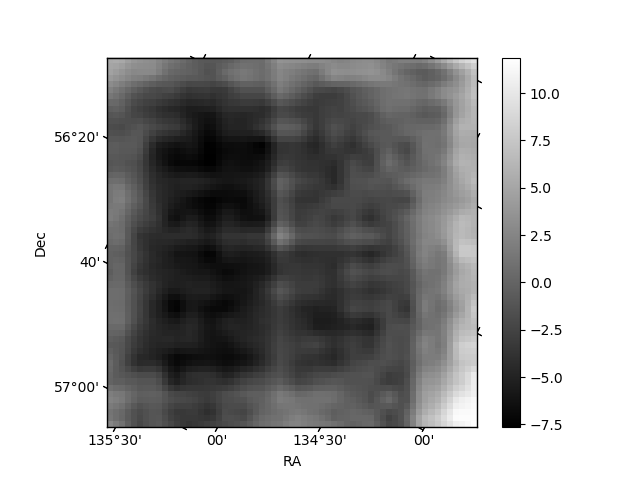
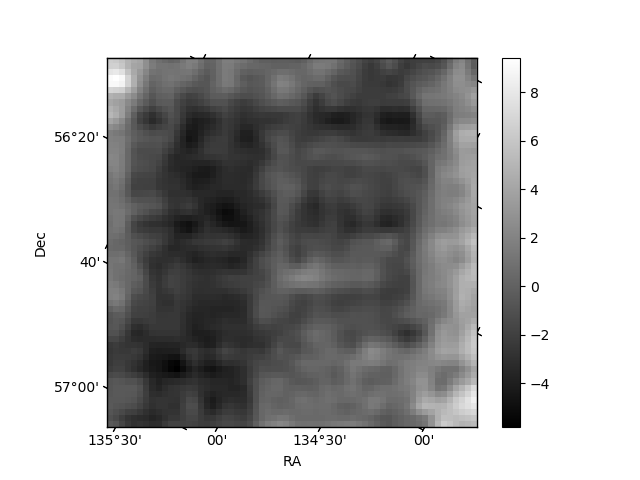
Histogram calculated using DETX and DETY for each event in the final _common_clean file
| Quadrant A | 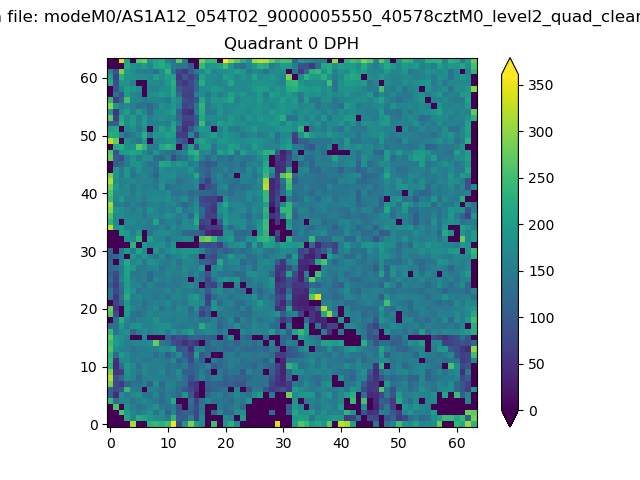 |
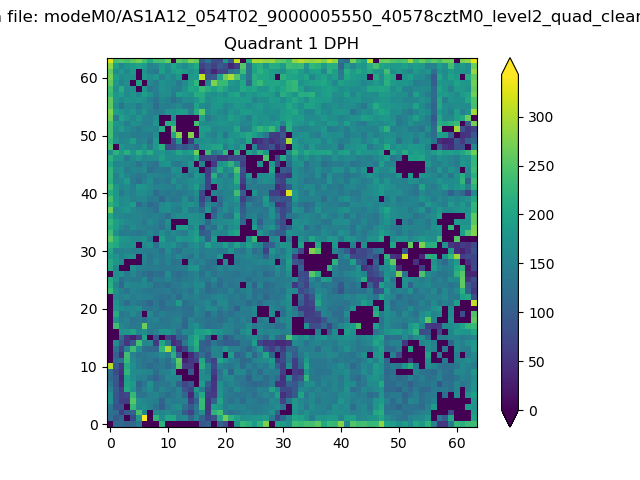 |
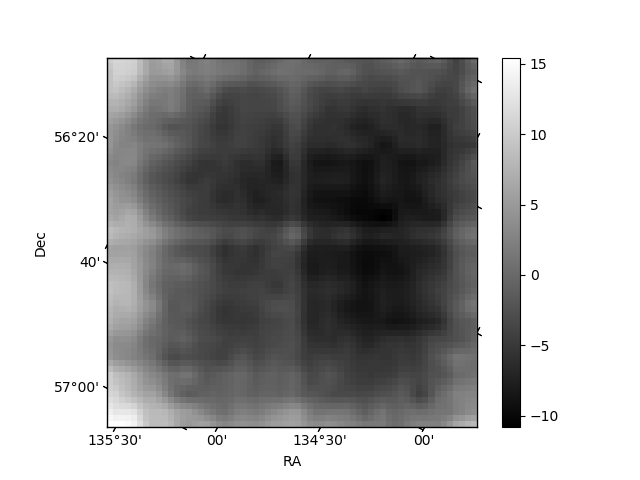
Quadrant B |
|---|---|---|---|
| Quadrant D | 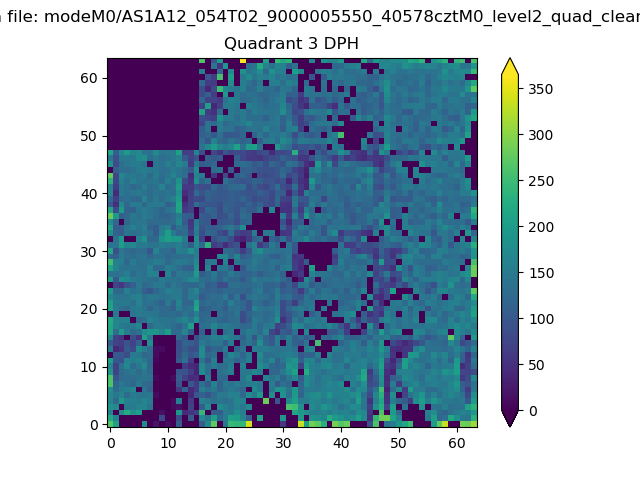 |
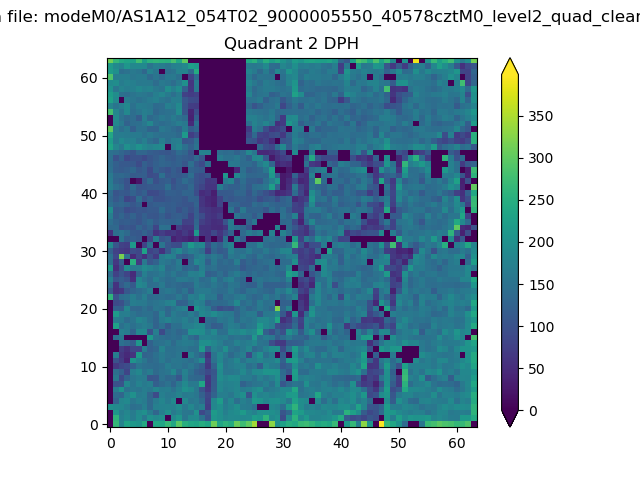 |
Quadrant C |
| Plot type | Count rate plots | Images |
|---|---|---|
| Comparison with Poisson distribution Blue bars denote a histogram of data divided into 1 sec bins. Red curve is a Poisson curve with rate = median count rate of data. |
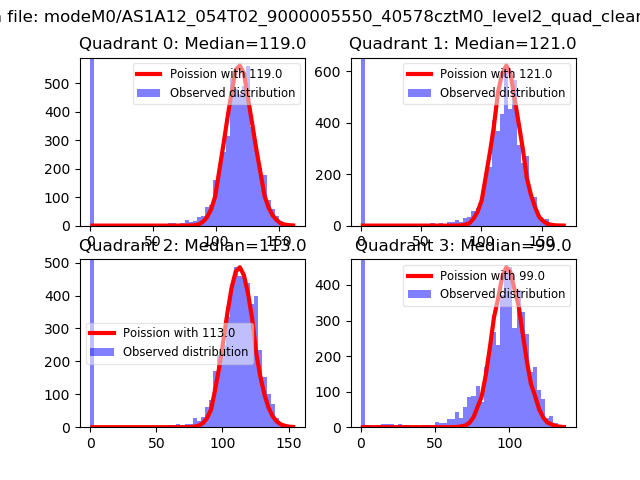 |
 |
| Quadrant-wise count rates Data is divided into 100 sec bins |
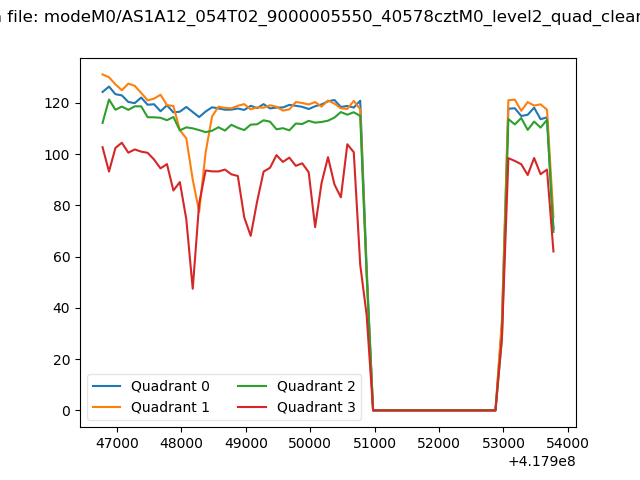 |
|
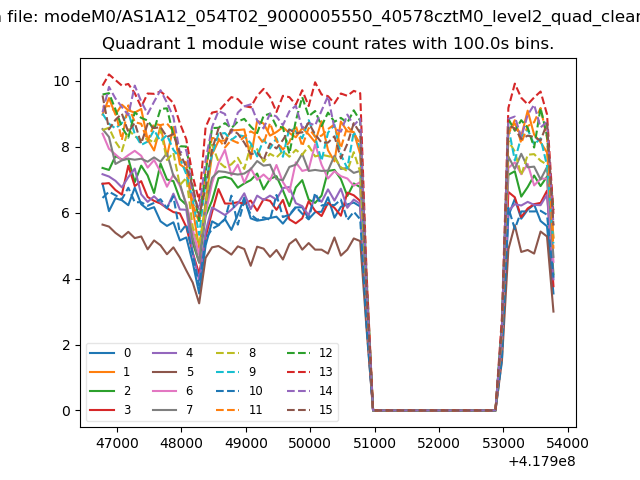
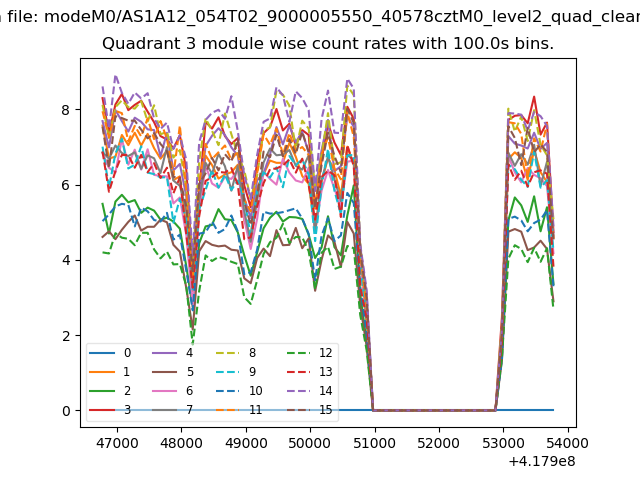
| Module-wise count rates for Quadrant A Data is divided into 100 sec bins |
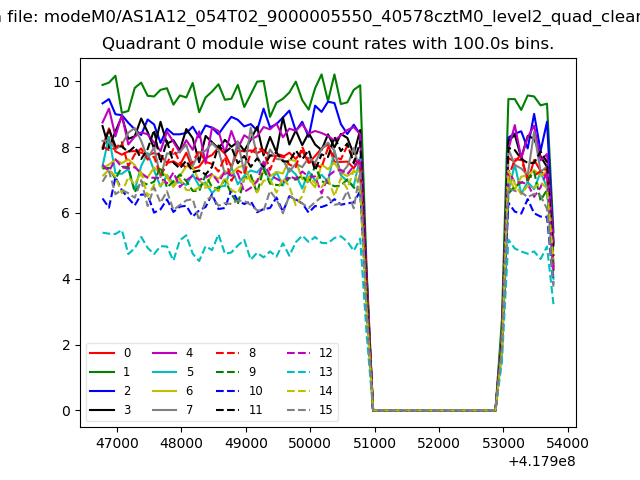 |
 |
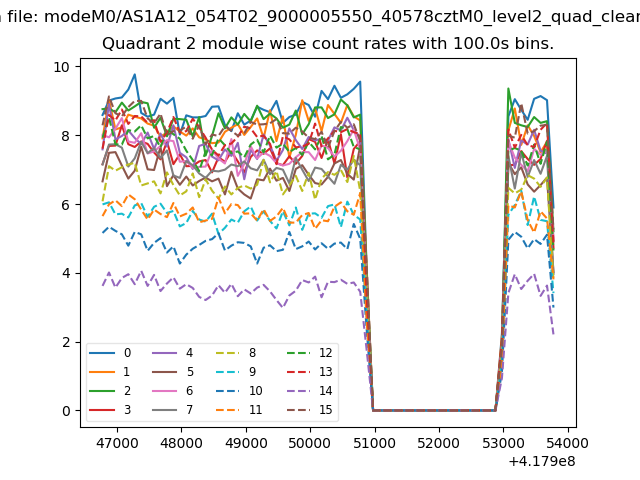
| Module-wise count rates for Quadrant B Data is divided into 100 sec bins |
 |
 |
| Module-wise count rates for Quadrant C Data is divided into 100 sec bins |
 |
 |
| Module-wise count rates for Quadrant D Data is divided into 100 sec bins |
 |
 |
| Parameter | Plot |
|---|---|
| CZT HV Monitor | 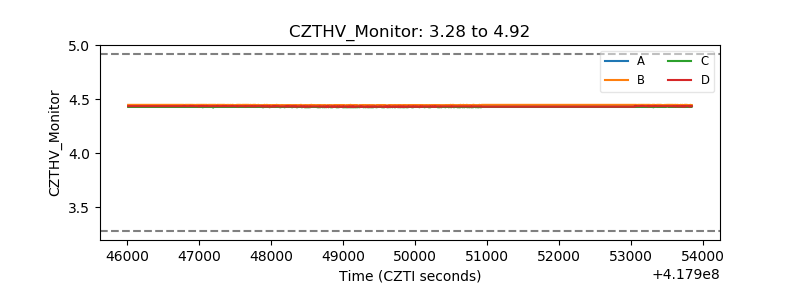 |
| D_VDD | 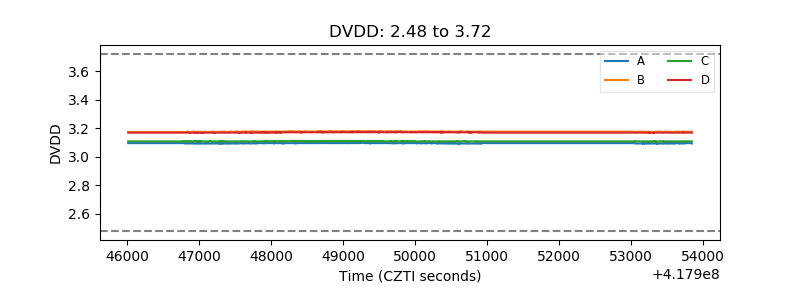 |
| Temperature 1 | 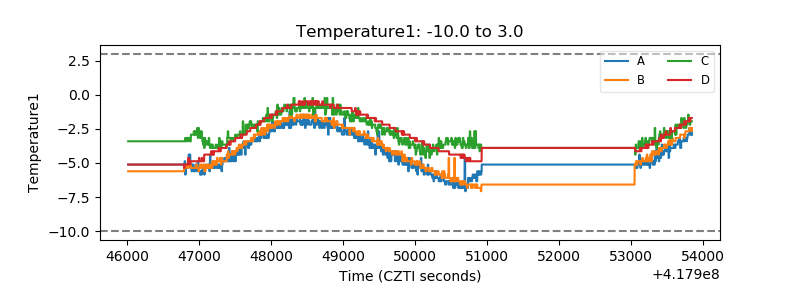 |
| Veto HV Monitor | 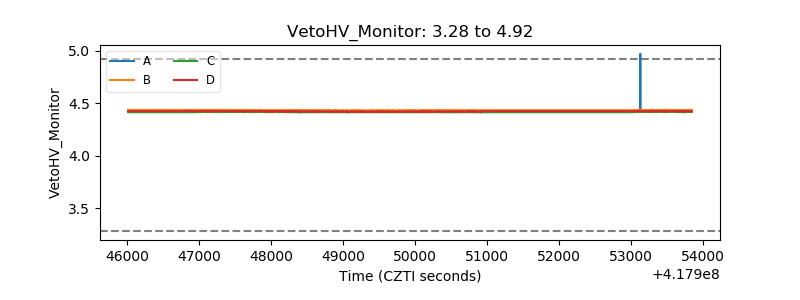 |
| Veto LLD | 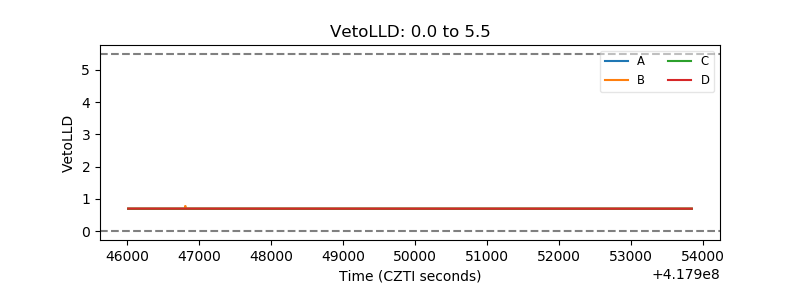 |
| Alpha Counter | 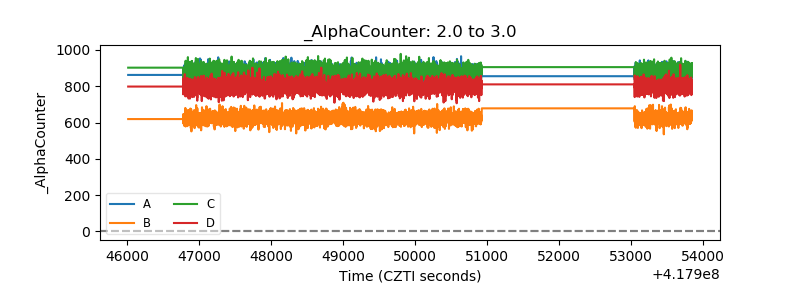 |
| _CPM_Rate | 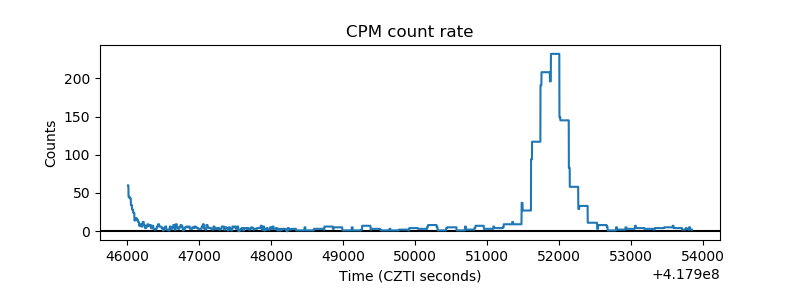 |
| CZT Counter | 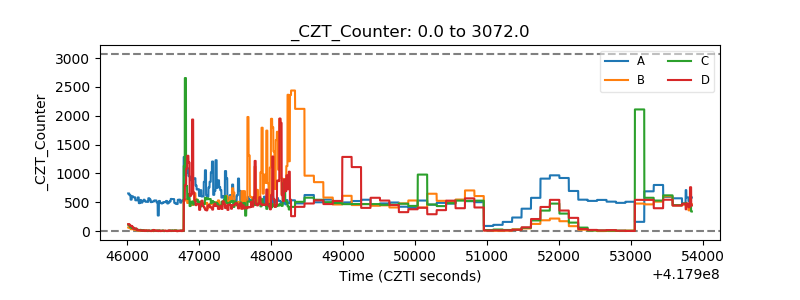 |
| +2.5 Volts monitor | 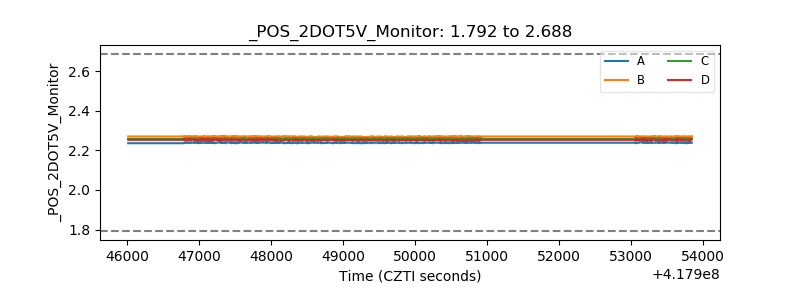 |
| +5 Volts monitor | 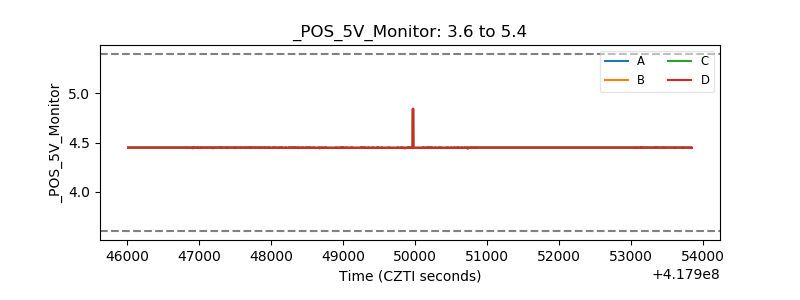 |
| _ROLL_ROT | 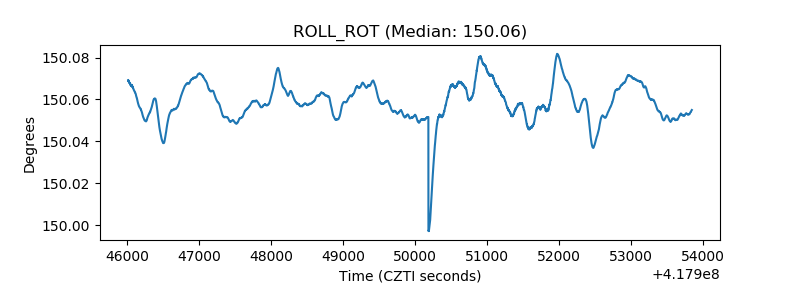 |
| _Roll_DEC | 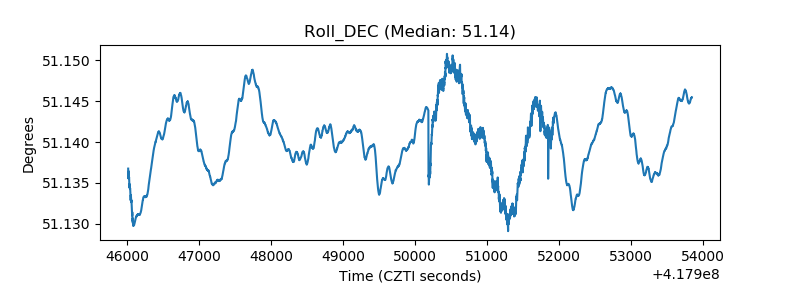 |
| _Roll_RA | 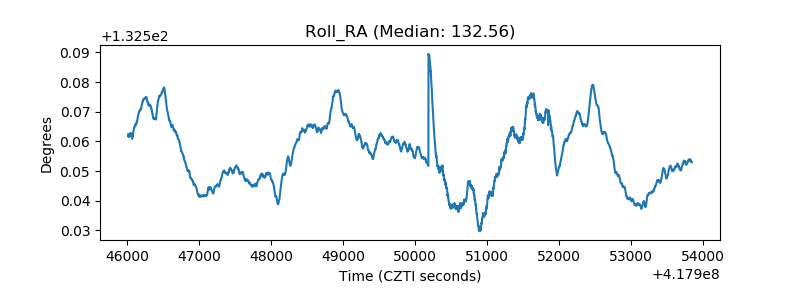 |
| Veto Counter | 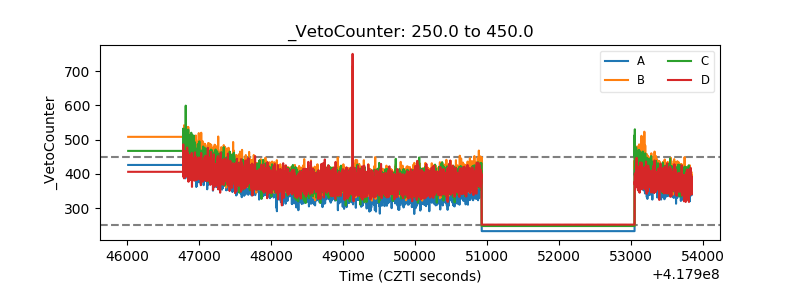 |