| Param | Original file | Final file |
|---|---|---|
| Filename | modeM0/AS1A12_054T02_9000005550_40579cztM0_level2.fits | modeM0/AS1A12_054T02_9000005550_40579cztM0_level2_quad_clean.evt |
| Size (bytes) | 291,749,760 | 83,407,680 |
| Size | 278.2 MB | 79.5 MB |
| Events in quadrant A | 2,848,132 | 581,448 |
| Events in quadrant B | 2,605,042 | 589,229 |
| Events in quadrant C | 2,445,817 | 557,693 |
| Events in quadrant D | 2,500,188 | 438,225 |
| Mode SS | |||
|---|---|---|---|
| Quadrant | BADHDUFLAG | Total packets | Discarded packets |
| A | 0 | 104 | 0 |
| B | 0 | 104 | 0 |
| C | 0 | 104 | 0 |
| D | 0 | 104 | 0 |
| Mode M0 | |||
|---|---|---|---|
| Quadrant | BADHDUFLAG | Total packets | Discarded packets |
| A | 0 | 11573 | 3 |
| B | 0 | 11084 | 2 |
| C | 0 | 10528 | 2 |
| D | 0 | 10841 | 2 |
| Mode M9 | |||
|---|---|---|---|
| Quadrant | BADHDUFLAG | Total packets | Discarded packets |
| A | 0 | 20 | 0 |
| B | 0 | 20 | 0 |
| C | 0 | 20 | 0 |
| D | 0 | 20 | 0 |
| Quadrant | Total seconds | Saturated seconds | Saturation percentage |
|---|---|---|---|
| A | 5120 | 6 | 0.117188% |
| B | 5120 | 32 | 0.625000% |
| C | 5120 | 11 | 0.214844% |
| D | 5121 | 886 | 17.301308% |
Noise dominated data is calculated using 1-second bins in cleaned event files. If a bin has >2000 counts, and if more than 50% of those come from <1% of pixels, then it is considered to be noise-dominated and hence unusable.
| Quadrant | # 1 sec bins | Bins with >0 counts | Bins with >2000 counts | High rate bins dominated by noise | Noise dominated (total time) | Noise dominated (detector-on time) | Marked lightcurve |
|---|---|---|---|---|---|---|---|
| A | 7093 | 5121 | 1 | 1 | 0.01% | 0.02% | 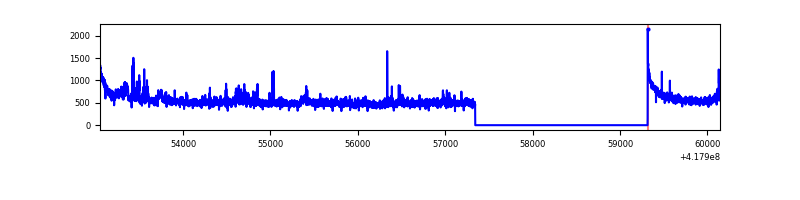 |
| B | 7093 | 5121 | 18 | 18 | 0.25% | 0.35% | 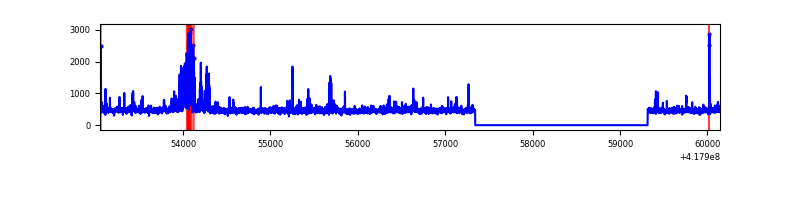 |
| C | 7093 | 5121 | 9 | 9 | 0.13% | 0.18% | 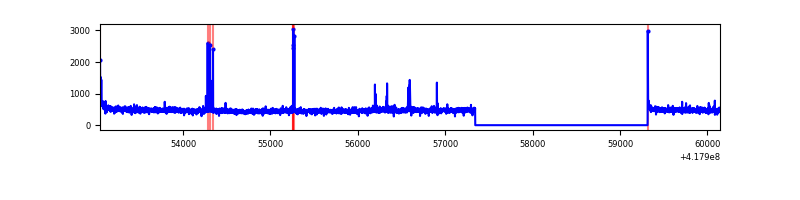 |
| D | 7094 | 5122 | 14 | 14 | 0.20% | 0.27% | 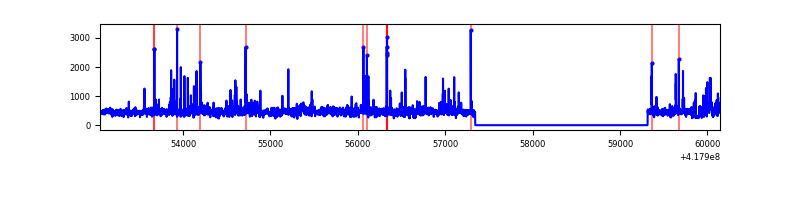 |
Top three noisy pixels from each quadrant. If the there are fewer than three noisy pixels in the level2.evt file, extra rows are filled as -1
| Pixel properties | Quadrant properties | ||||||
|---|---|---|---|---|---|---|---|
| Quadrant | DetID | PixID | Counts | Sigma | Mean | Median | Sigma |
| A | 10 | 83 | 481549 | 4217.24 | 561 | 551 | 114.1 |
| A | 12 | 189 | 99477 | 867.35 | 561 | 551 | 114.1 |
| A | 15 | 191 | 52763 | 457.78 | 561 | 551 | 114.1 |
| B | 0 | 190 | 243159 | 2270.67 | 552 | 537 | 106.9 |
| B | 3 | 112 | 71926 | 668.12 | 552 | 537 | 106.9 |
| B | 5 | 255 | 38453 | 354.85 | 552 | 537 | 106.9 |
| C | 15 | 214 | 227147 | 1768.09 | 544 | 546 | 128.2 |
| C | 14 | 254 | 52847 | 408.09 | 544 | 546 | 128.2 |
| C | 0 | 10 | 29473 | 225.71 | 544 | 546 | 128.2 |
| D | 12 | 191 | 246032 | 2022.57 | 497 | 483 | 121.4 |
| D | 2 | 250 | 83489 | 683.72 | 497 | 483 | 121.4 |
| D | 1 | 47 | 50277 | 410.15 | 497 | 483 | 121.4 |
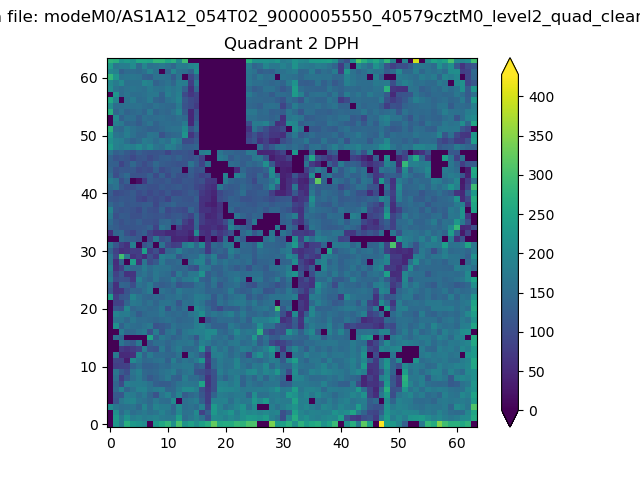
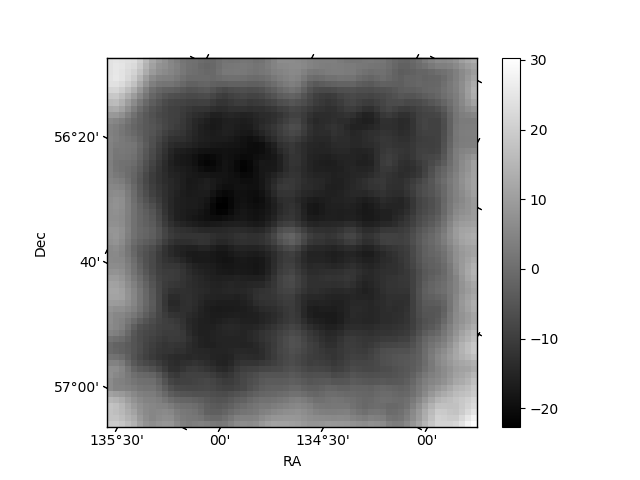
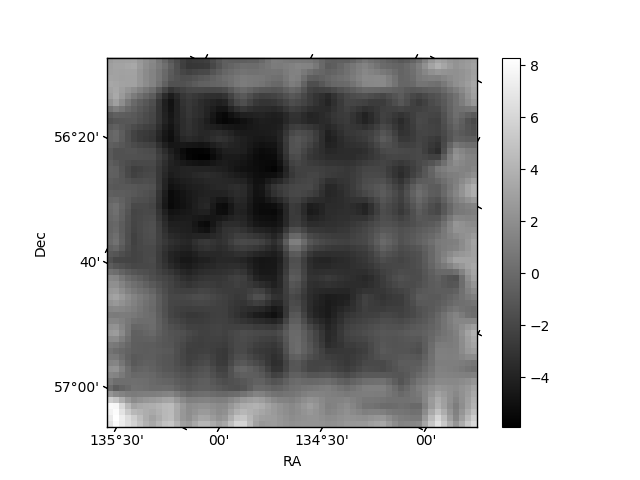
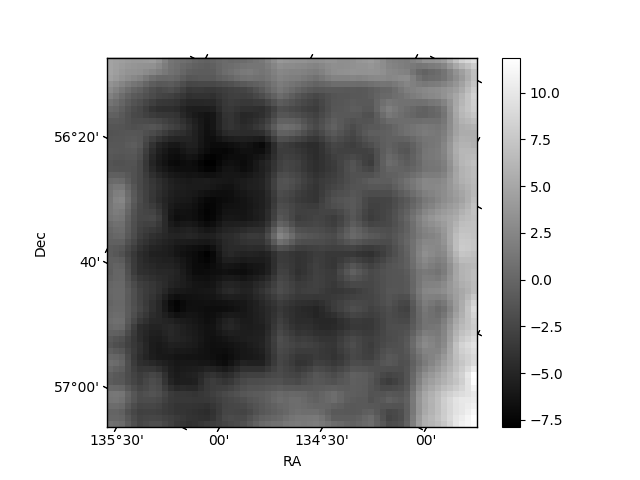
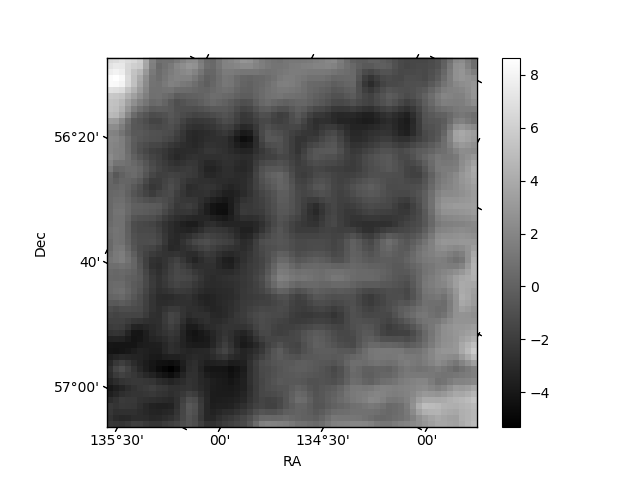
Histogram calculated using DETX and DETY for each event in the final _common_clean file
| Quadrant A | 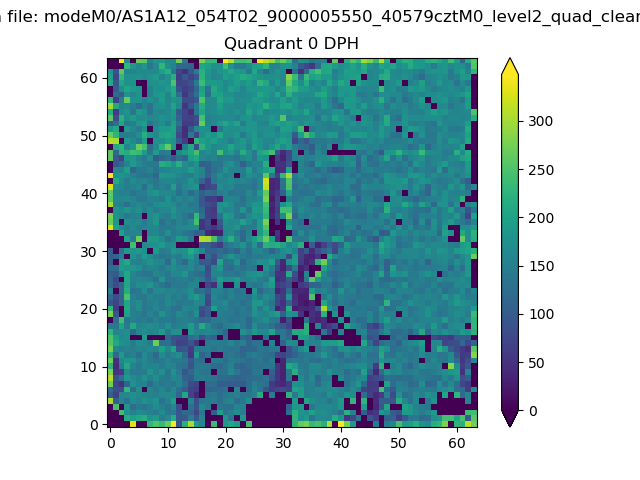 |
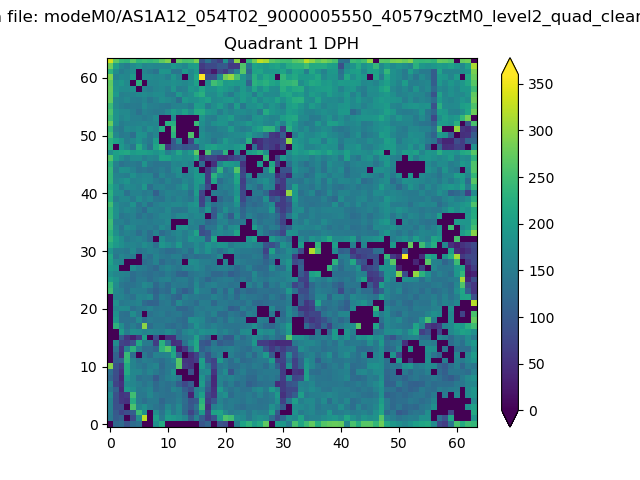 |
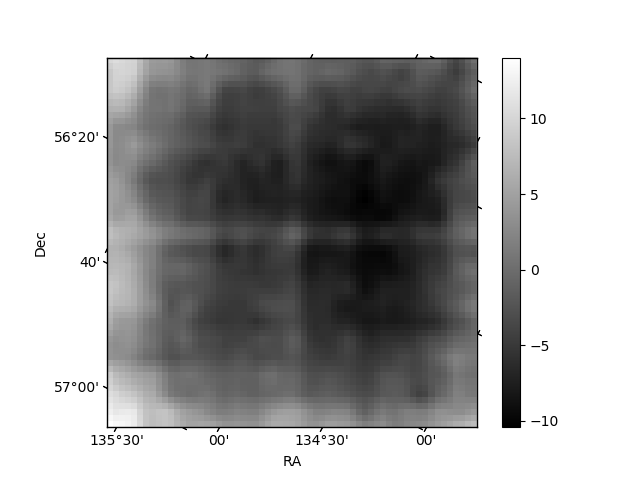
Quadrant B |
|---|---|---|---|
| Quadrant D | 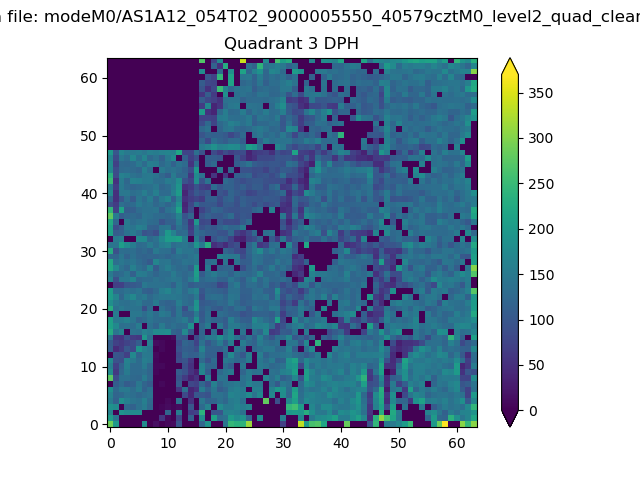 |
 |
Quadrant C |
| Plot type | Count rate plots | Images |
|---|---|---|
| Comparison with Poisson distribution Blue bars denote a histogram of data divided into 1 sec bins. Red curve is a Poisson curve with rate = median count rate of data. |
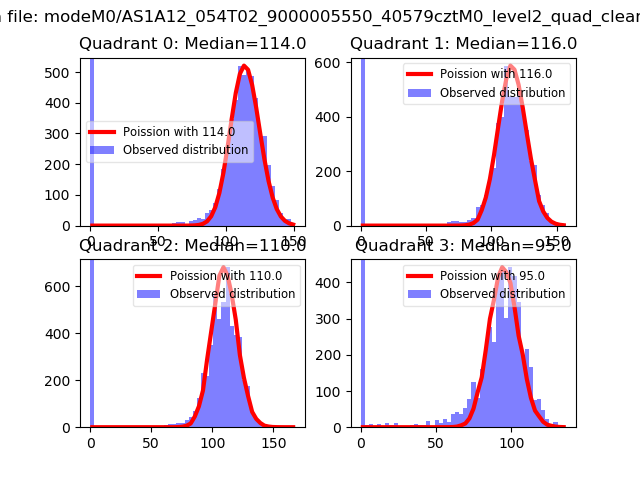 |
 |
| Quadrant-wise count rates Data is divided into 100 sec bins |
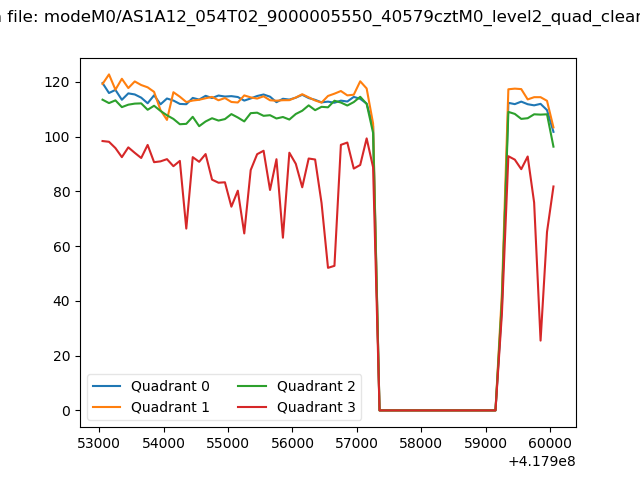 |
|
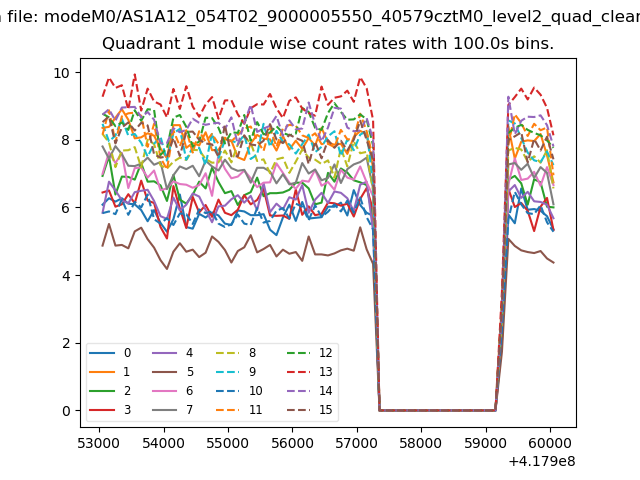
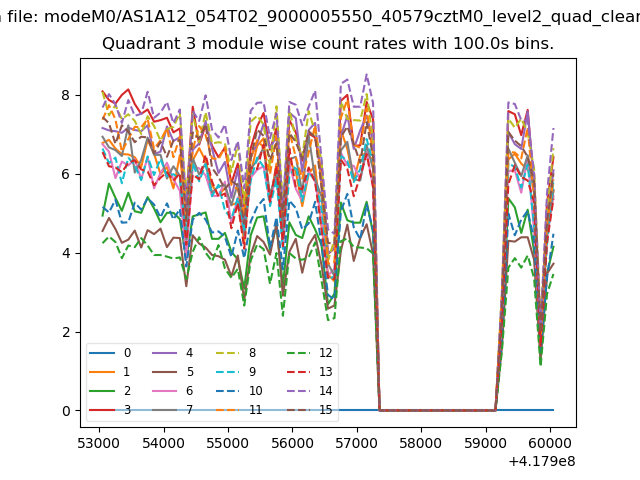
| Module-wise count rates for Quadrant A Data is divided into 100 sec bins |
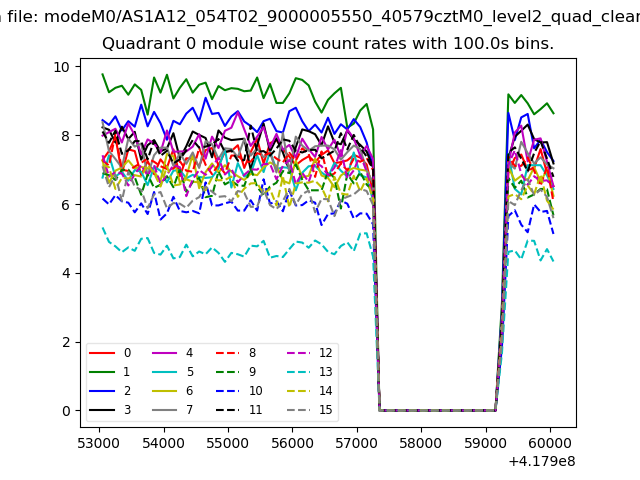 |
 |
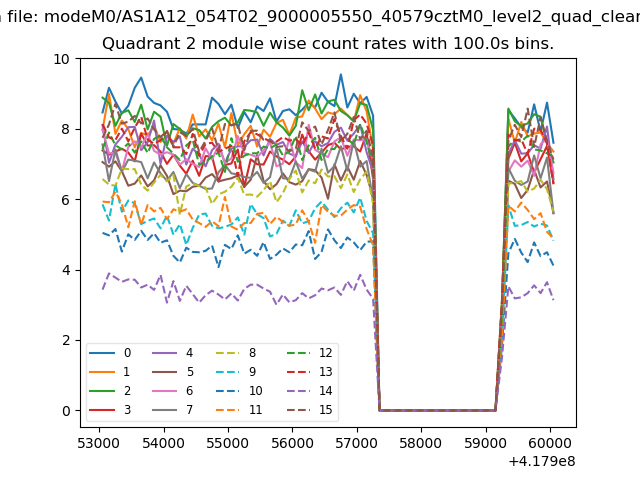
| Module-wise count rates for Quadrant B Data is divided into 100 sec bins |
 |
 |
| Module-wise count rates for Quadrant C Data is divided into 100 sec bins |
 |
 |
| Module-wise count rates for Quadrant D Data is divided into 100 sec bins |
 |
 |
| Parameter | Plot |
|---|---|
| CZT HV Monitor | 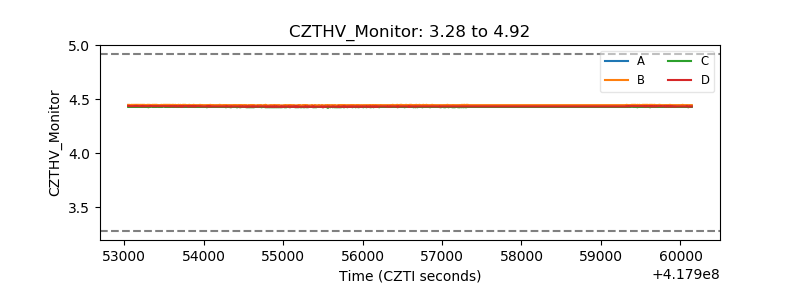 |
| D_VDD | 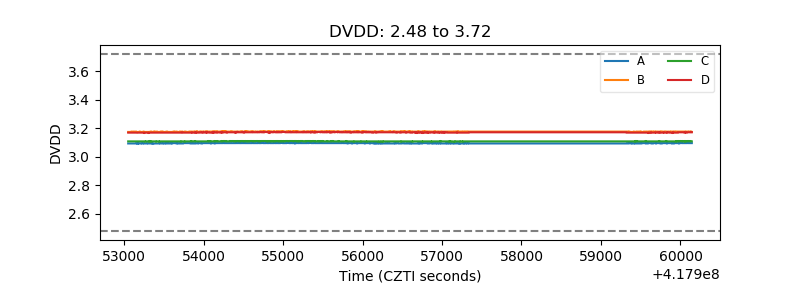 |
| Temperature 1 | 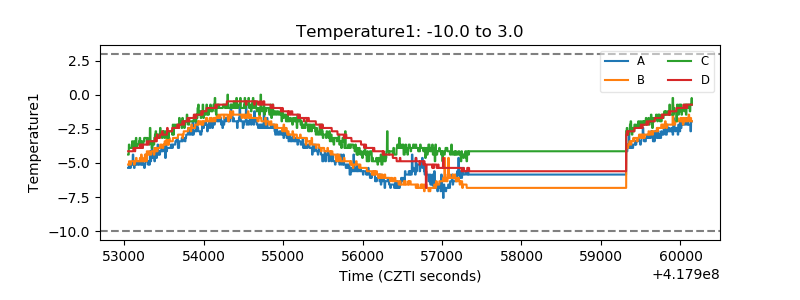 |
| Veto HV Monitor | 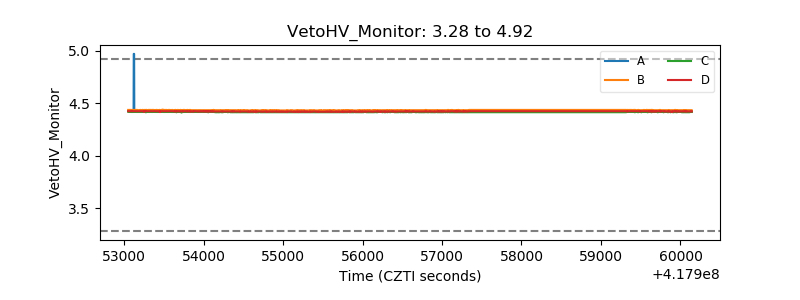 |
| Veto LLD | 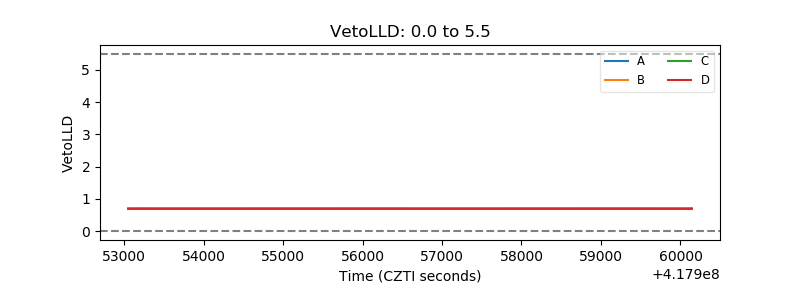 |
| Alpha Counter | 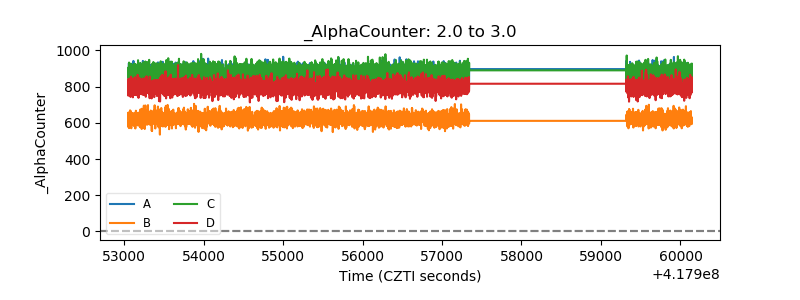 |
| _CPM_Rate | 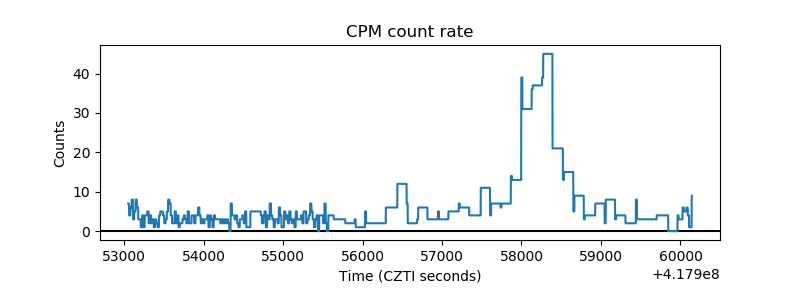 |
| CZT Counter | 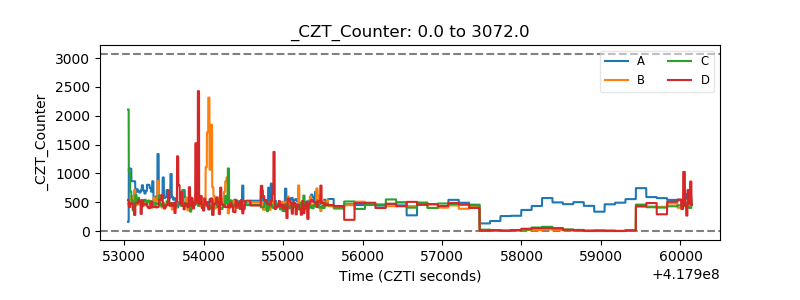 |
| +2.5 Volts monitor | 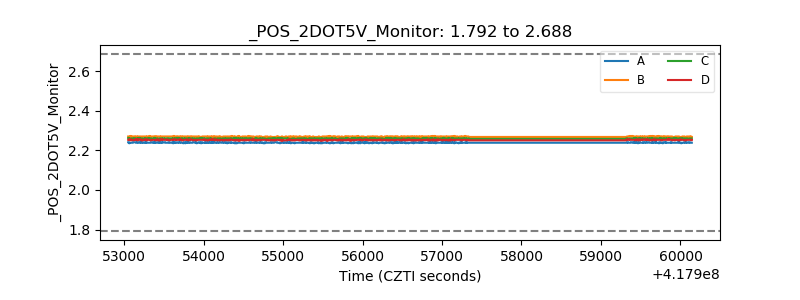 |
| +5 Volts monitor | 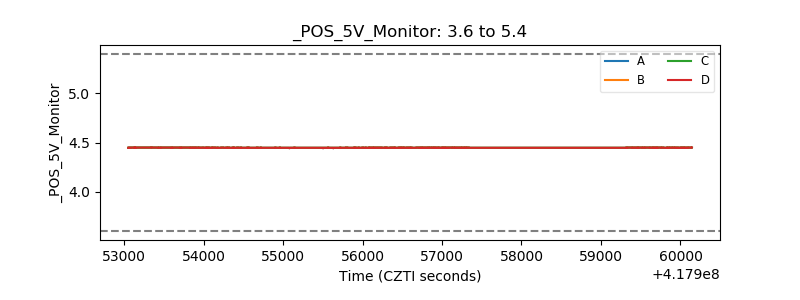 |
| _ROLL_ROT | 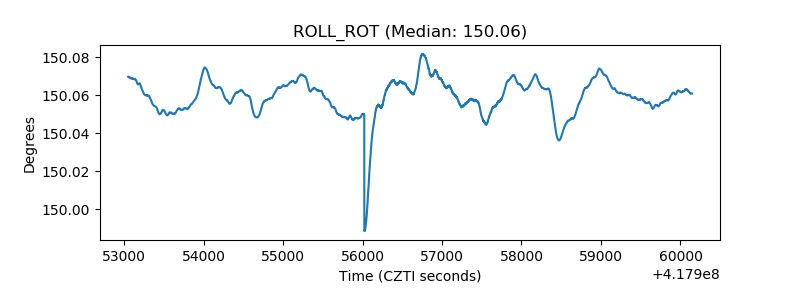 |
| _Roll_DEC | 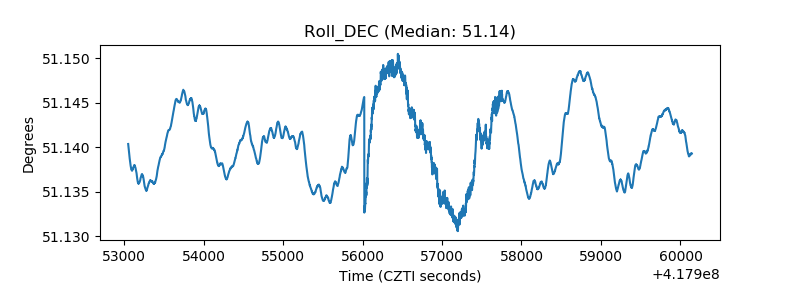 |
| _Roll_RA | 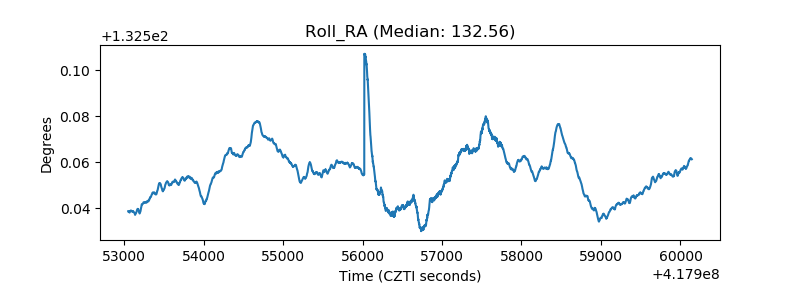 |
| Veto Counter | 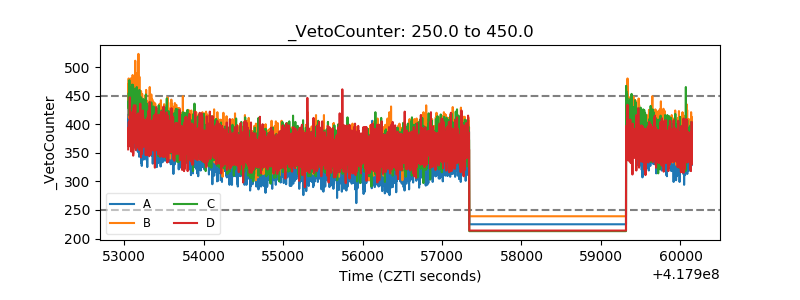 |