| Param | Original file | Final file |
|---|---|---|
| Filename | modeM0/AS1A12_054T02_9000005550_40581cztM0_level2.fits | modeM0/AS1A12_054T02_9000005550_40581cztM0_level2_quad_clean.evt |
| Size (bytes) | 361,961,280 | 92,442,240 |
| Size | 345.2 MB | 88.2 MB |
| Events in quadrant A | 3,107,910 | 632,479 |
| Events in quadrant B | 4,066,789 | 630,483 |
| Events in quadrant C | 2,684,703 | 611,729 |
| Events in quadrant D | 3,088,618 | 519,945 |
| Mode SS | |||
|---|---|---|---|
| Quadrant | BADHDUFLAG | Total packets | Discarded packets |
| A | 0 | 118 | 0 |
| B | 0 | 118 | 0 |
| C | 0 | 118 | 0 |
| D | 0 | 118 | 0 |
| Mode M0 | |||
|---|---|---|---|
| Quadrant | BADHDUFLAG | Total packets | Discarded packets |
| A | 0 | 12861 | 3 |
| B | 0 | 15956 | 2 |
| C | 0 | 11786 | 2 |
| D | 0 | 13009 | 2 |
| Mode M9 | |||
|---|---|---|---|
| Quadrant | BADHDUFLAG | Total packets | Discarded packets |
| A | 0 | 14 | 0 |
| B | 0 | 14 | 0 |
| C | 0 | 14 | 0 |
| D | 0 | 14 | 0 |
| Quadrant | Total seconds | Saturated seconds | Saturation percentage |
|---|---|---|---|
| A | 5781 | 23 | 0.397855% |
| B | 5781 | 183 | 3.165542% |
| C | 5781 | 19 | 0.328663% |
| D | 5781 | 579 | 10.015568% |
Noise dominated data is calculated using 1-second bins in cleaned event files. If a bin has >2000 counts, and if more than 50% of those come from <1% of pixels, then it is considered to be noise-dominated and hence unusable.
| Quadrant | # 1 sec bins | Bins with >0 counts | Bins with >2000 counts | High rate bins dominated by noise | Noise dominated (total time) | Noise dominated (detector-on time) | Marked lightcurve |
|---|---|---|---|---|---|---|---|
| A | 7153 | 5782 | 14 | 14 | 0.20% | 0.24% | 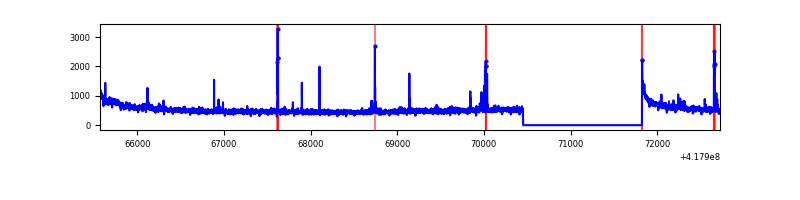 |
| B | 7153 | 5782 | 132 | 132 | 1.85% | 2.28% | 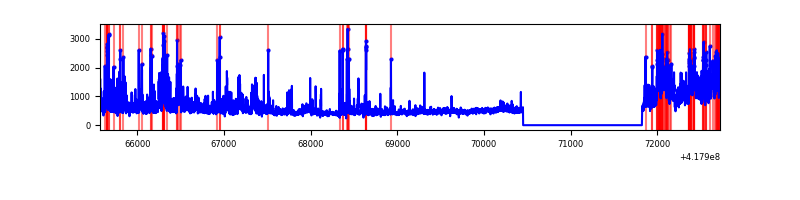 |
| C | 7153 | 5782 | 13 | 13 | 0.18% | 0.22% | 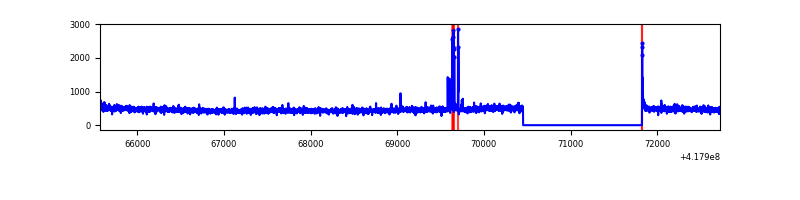 |
| D | 7153 | 5782 | 50 | 50 | 0.70% | 0.86% | 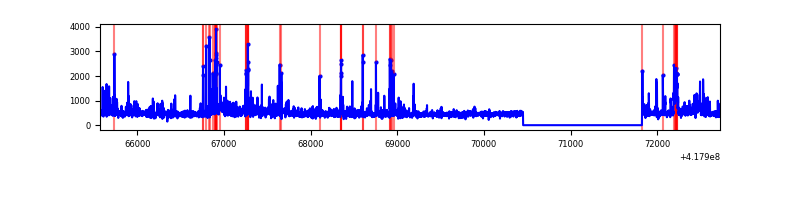 |
Top three noisy pixels from each quadrant. If the there are fewer than three noisy pixels in the level2.evt file, extra rows are filled as -1
| Pixel properties | Quadrant properties | ||||||
|---|---|---|---|---|---|---|---|
| Quadrant | DetID | PixID | Counts | Sigma | Mean | Median | Sigma |
| A | 10 | 83 | 526716 | 4126.94 | 622 | 611 | 127.5 |
| A | 2 | 79 | 98732 | 769.69 | 622 | 611 | 127.5 |
| A | 15 | 191 | 70412 | 547.54 | 622 | 611 | 127.5 |
| B | 3 | 112 | 826405 | 6941.3 | 609 | 590 | 119.0 |
| B | 0 | 190 | 588531 | 4941.87 | 609 | 590 | 119.0 |
| B | 5 | 255 | 162809 | 1363.51 | 609 | 590 | 119.0 |
| C | 15 | 214 | 251744 | 1762.66 | 606 | 608 | 142.5 |
| C | 14 | 254 | 51918 | 360.13 | 606 | 608 | 142.5 |
| C | 0 | 10 | 13918 | 93.42 | 606 | 608 | 142.5 |
| D | 12 | 191 | 215194 | 1495.3 | 577 | 559 | 143.5 |
| D | 12 | 227 | 140987 | 978.32 | 577 | 559 | 143.5 |
| D | 10 | 34 | 127524 | 884.53 | 577 | 559 | 143.5 |
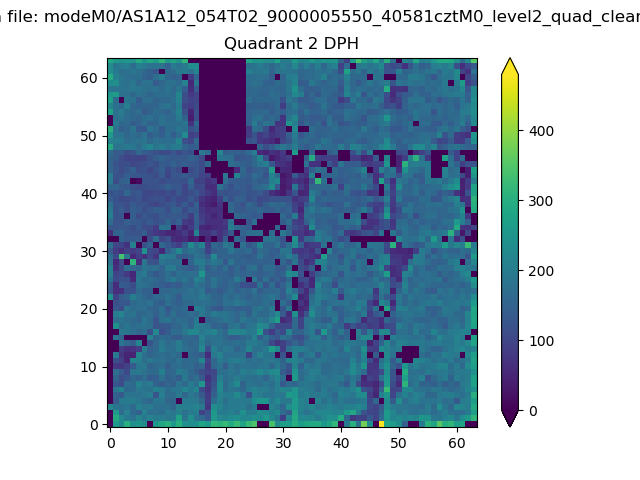
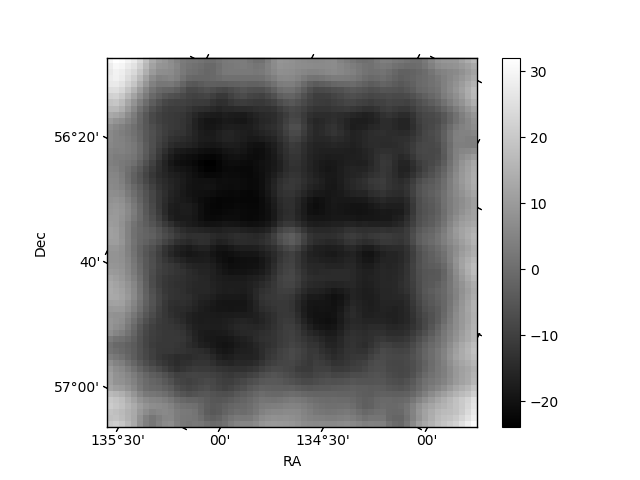
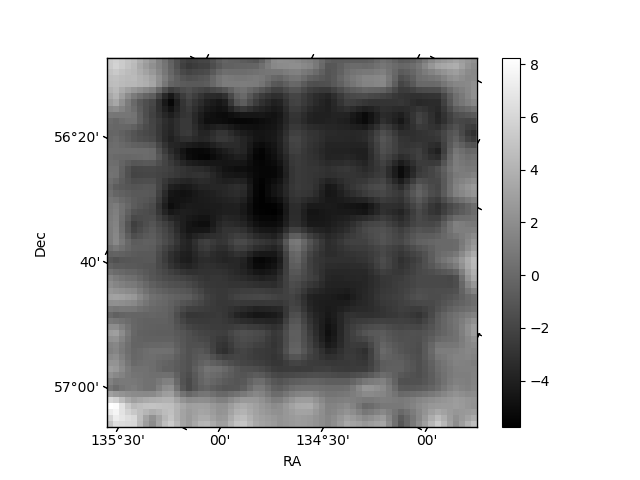
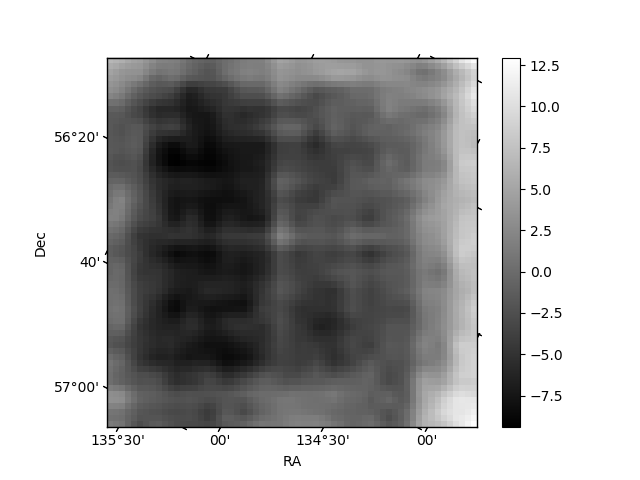
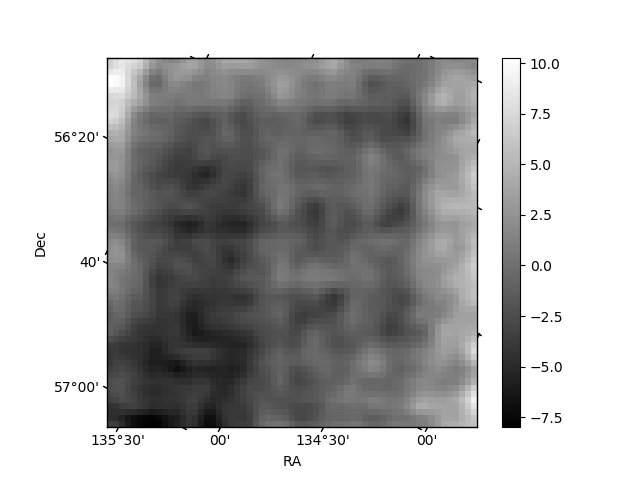
Histogram calculated using DETX and DETY for each event in the final _common_clean file
| Quadrant A | 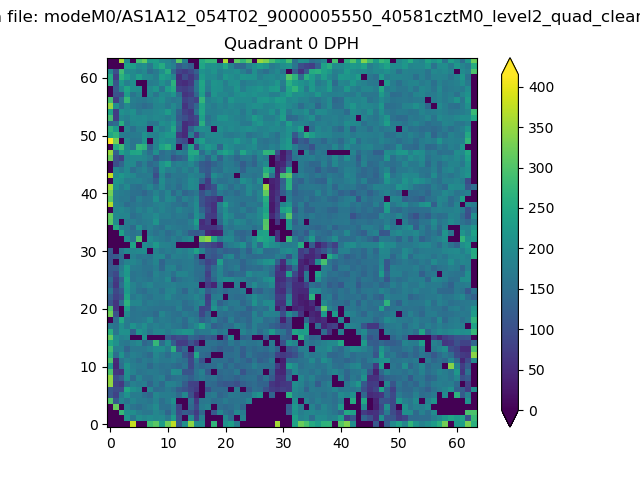 |
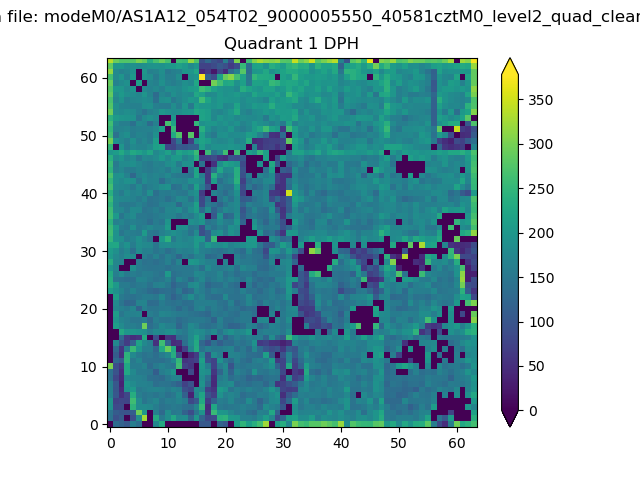 |
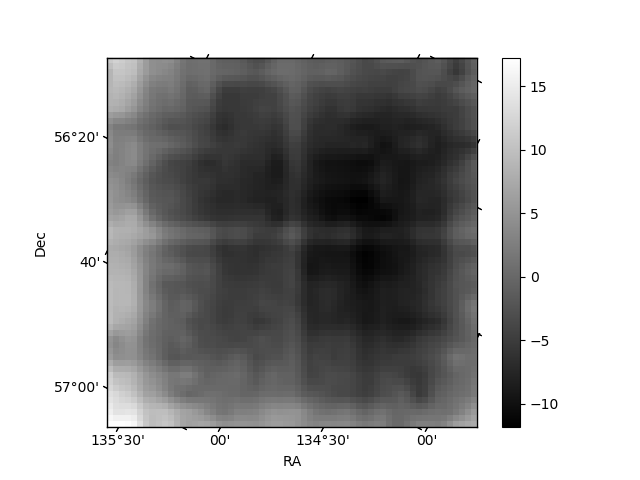
Quadrant B |
|---|---|---|---|
| Quadrant D | 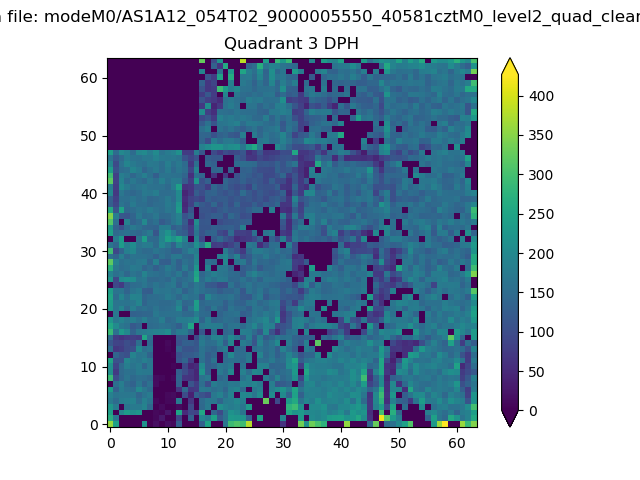 |
 |
Quadrant C |
| Plot type | Count rate plots | Images |
|---|---|---|
| Comparison with Poisson distribution Blue bars denote a histogram of data divided into 1 sec bins. Red curve is a Poisson curve with rate = median count rate of data. |
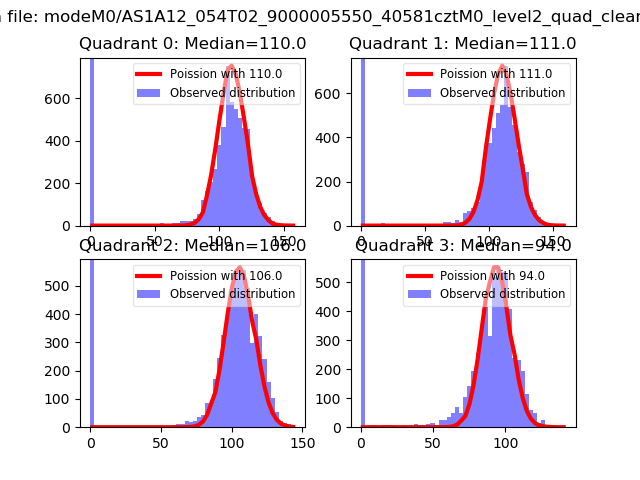 |
 |
| Quadrant-wise count rates Data is divided into 100 sec bins |
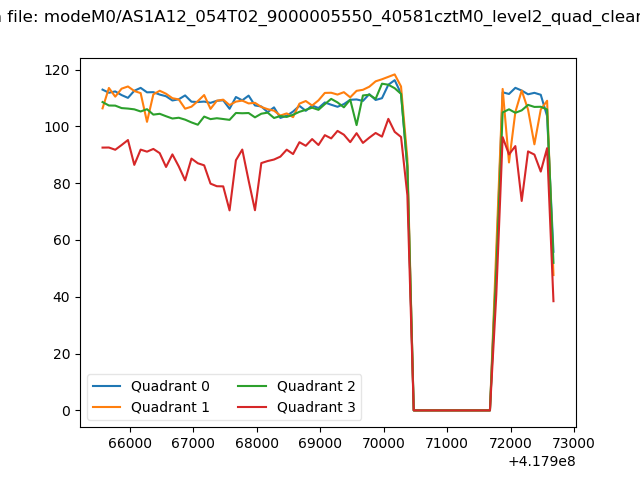 |
|
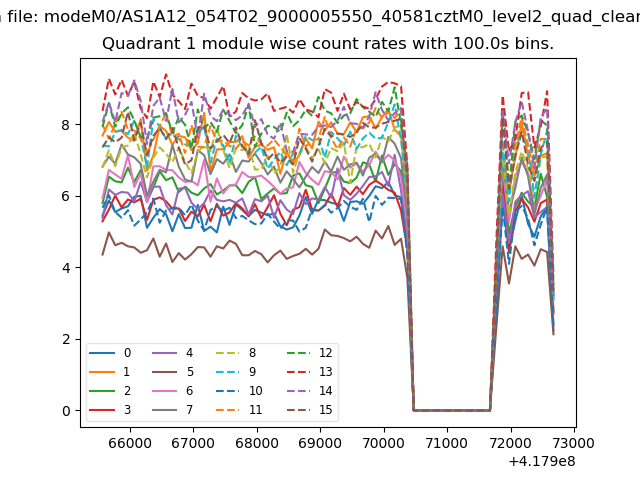
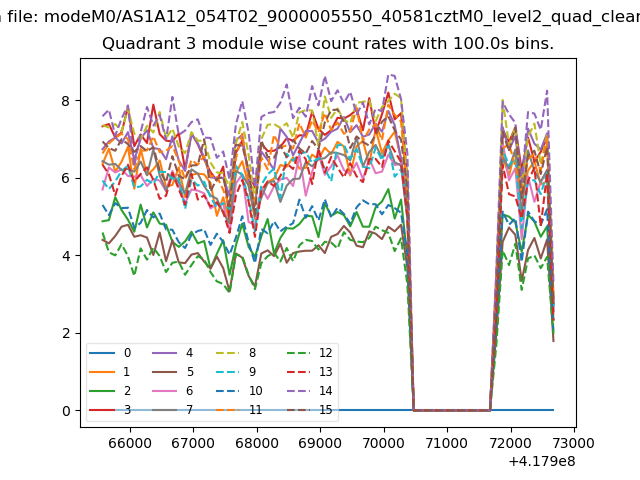
| Module-wise count rates for Quadrant A Data is divided into 100 sec bins |
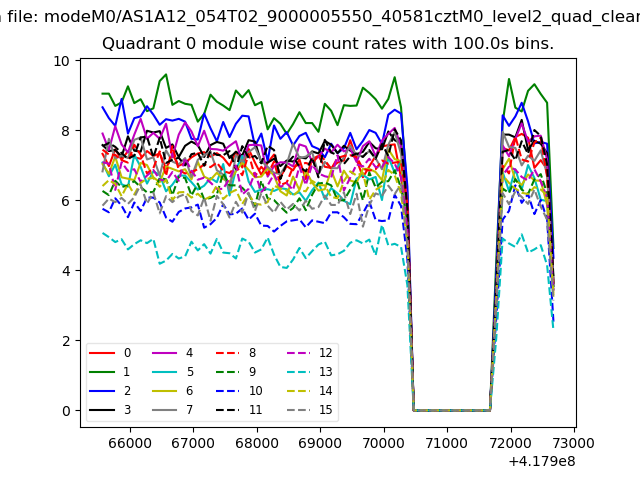 |
 |
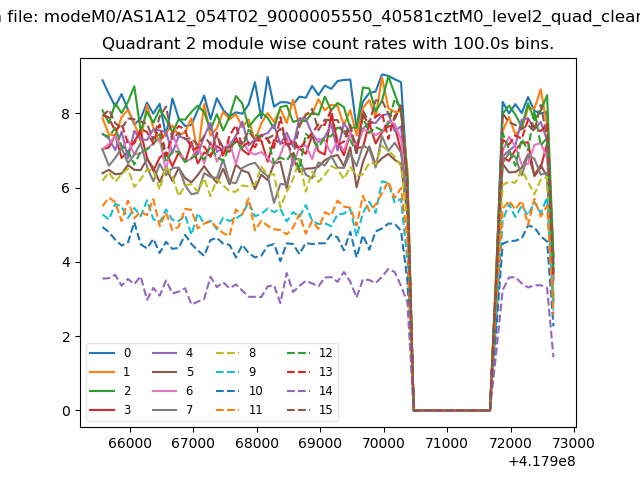
| Module-wise count rates for Quadrant B Data is divided into 100 sec bins |
 |
 |
| Module-wise count rates for Quadrant C Data is divided into 100 sec bins |
 |
 |
| Module-wise count rates for Quadrant D Data is divided into 100 sec bins |
 |
 |
| Parameter | Plot |
|---|---|
| CZT HV Monitor | 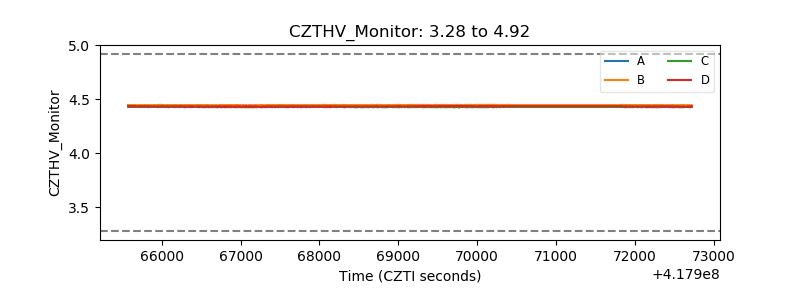 |
| D_VDD | 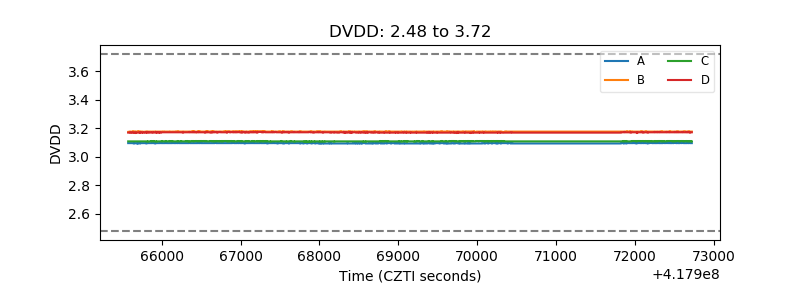 |
| Temperature 1 | 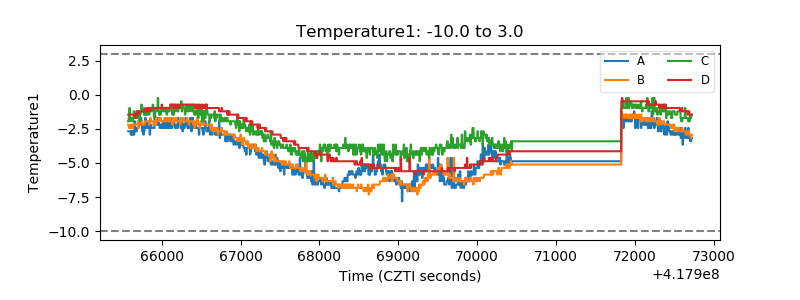 |
| Veto HV Monitor | 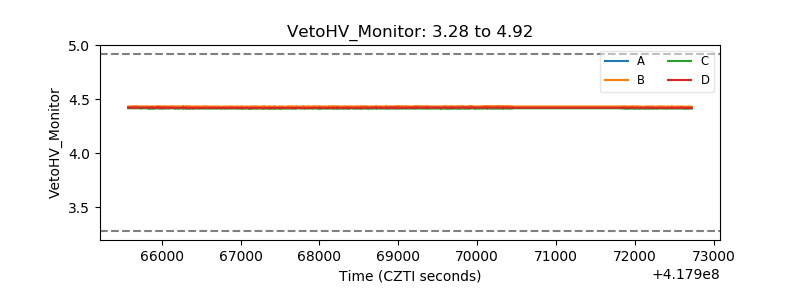 |
| Veto LLD | 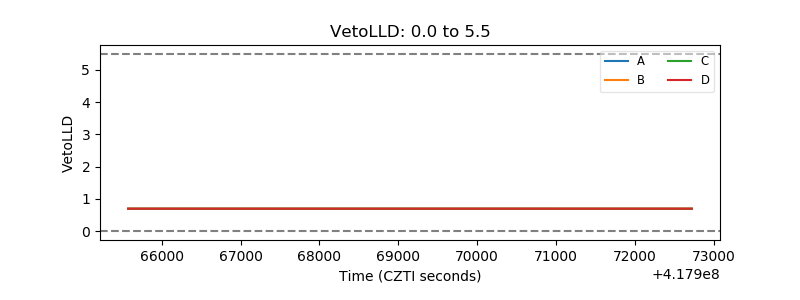 |
| Alpha Counter | 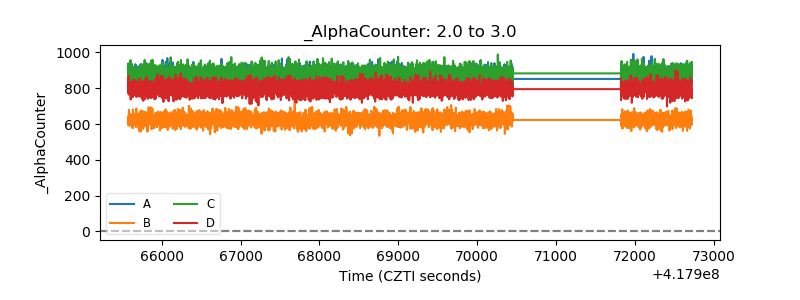 |
| _CPM_Rate | 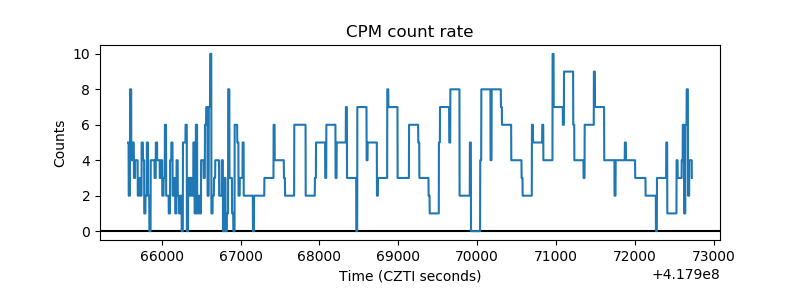 |
| CZT Counter | 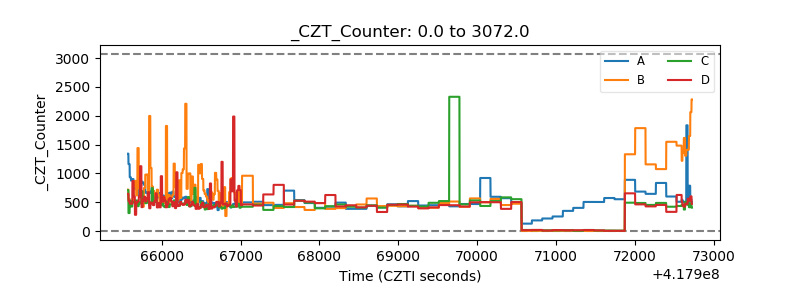 |
| +2.5 Volts monitor | 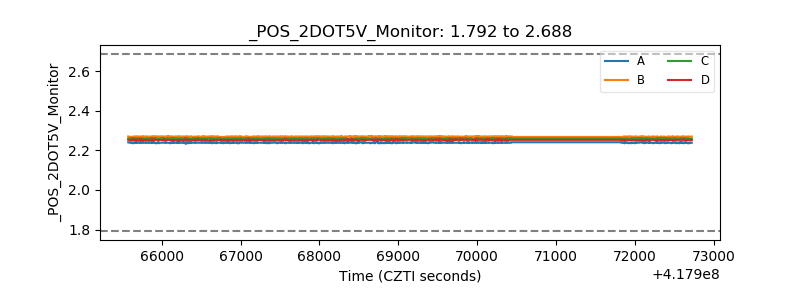 |
| +5 Volts monitor | 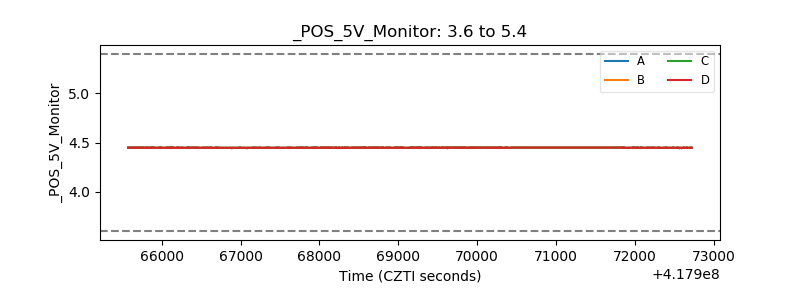 |
| _ROLL_ROT | 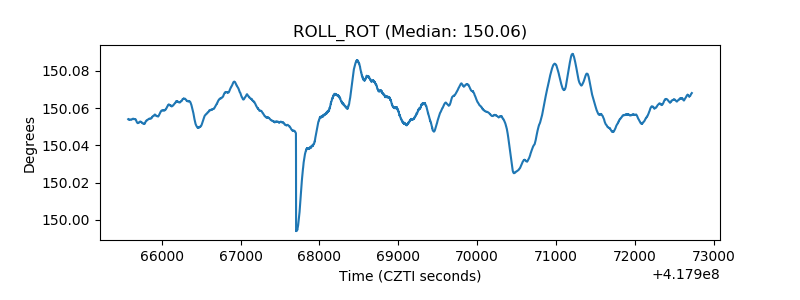 |
| _Roll_DEC | 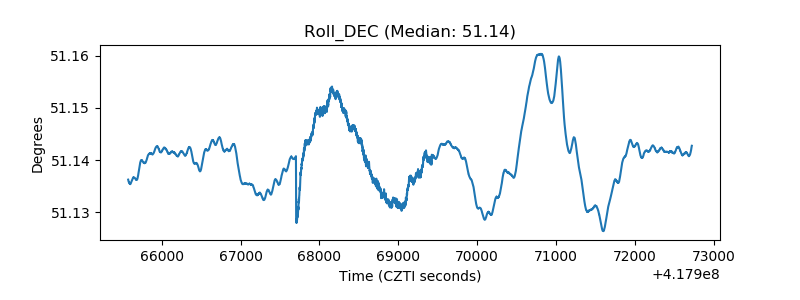 |
| _Roll_RA | 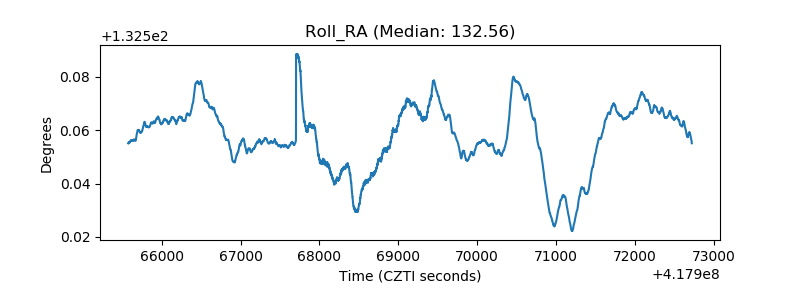 |
| Veto Counter | 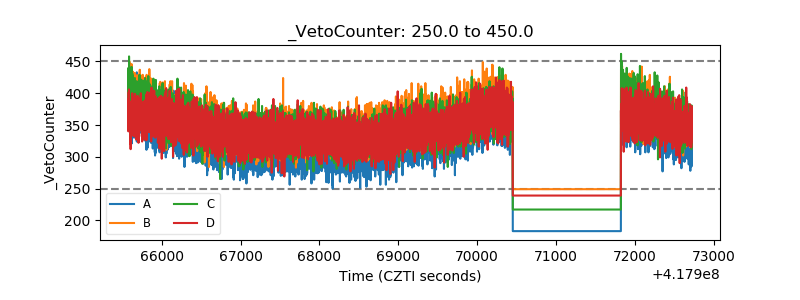 |