| Param | Original file | Final file |
|---|---|---|
| Filename | modeM0/AS1A12_054T02_9000005550_40582cztM0_level2.fits | modeM0/AS1A12_054T02_9000005550_40582cztM0_level2_quad_clean.evt |
| Size (bytes) | 435,677,760 | 91,719,360 |
| Size | 415.5 MB | 87.5 MB |
| Events in quadrant A | 3,209,312 | 643,432 |
| Events in quadrant B | 6,564,974 | 622,034 |
| Events in quadrant C | 2,750,851 | 624,248 |
| Events in quadrant D | 3,142,318 | 474,478 |
| Mode SS | |||
|---|---|---|---|
| Quadrant | BADHDUFLAG | Total packets | Discarded packets |
| A | 0 | 120 | 0 |
| B | 0 | 120 | 0 |
| C | 0 | 120 | 0 |
| D | 0 | 120 | 0 |
| Mode M0 | |||
|---|---|---|---|
| Quadrant | BADHDUFLAG | Total packets | Discarded packets |
| A | 0 | 13252 | 3 |
| B | 0 | 23700 | 2 |
| C | 0 | 12059 | 2 |
| D | 0 | 13553 | 2 |
| Mode M9 | |||
|---|---|---|---|
| Quadrant | BADHDUFLAG | Total packets | Discarded packets |
| A | 0 | 13 | 0 |
| B | 0 | 13 | 0 |
| C | 0 | 13 | 0 |
| D | 0 | 14 | 0 |
| Quadrant | Total seconds | Saturated seconds | Saturation percentage |
|---|---|---|---|
| A | 5906 | 20 | 0.338639% |
| B | 5906 | 511 | 8.652218% |
| C | 5906 | 13 | 0.220115% |
| D | 5906 | 1149 | 19.454792% |
Noise dominated data is calculated using 1-second bins in cleaned event files. If a bin has >2000 counts, and if more than 50% of those come from <1% of pixels, then it is considered to be noise-dominated and hence unusable.
| Quadrant | # 1 sec bins | Bins with >0 counts | Bins with >2000 counts | High rate bins dominated by noise | Noise dominated (total time) | Noise dominated (detector-on time) | Marked lightcurve |
|---|---|---|---|---|---|---|---|
| A | 7187 | 5907 | 9 | 9 | 0.13% | 0.15% | 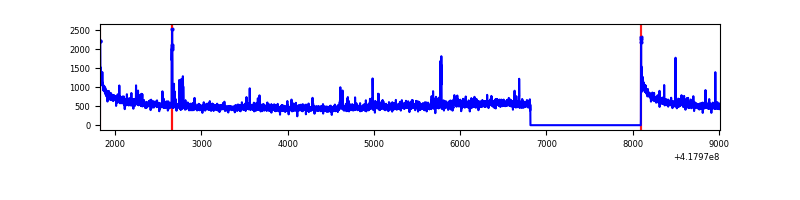 |
| B | 7187 | 5907 | 348 | 348 | 4.84% | 5.89% | 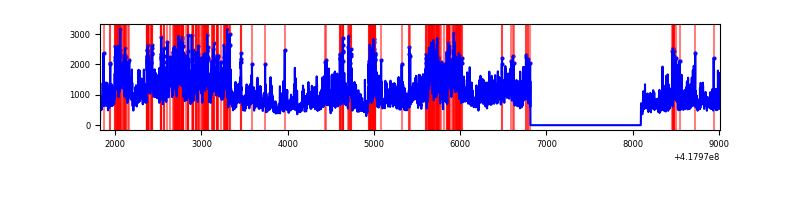 |
| C | 7187 | 5907 | 9 | 9 | 0.13% | 0.15% | 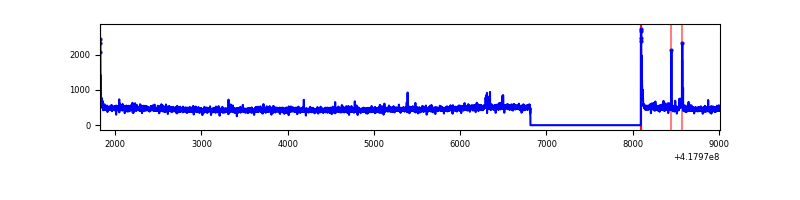 |
| D | 7186 | 5906 | 89 | 89 | 1.24% | 1.51% | 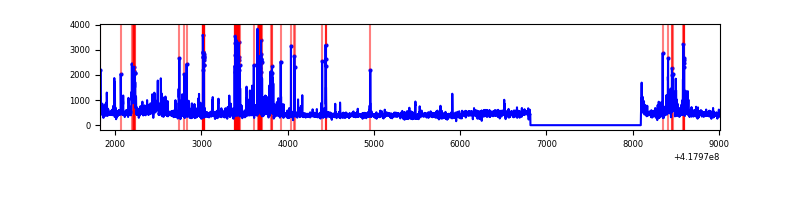 |
Top three noisy pixels from each quadrant. If the there are fewer than three noisy pixels in the level2.evt file, extra rows are filled as -1
| Pixel properties | Quadrant properties | ||||||
|---|---|---|---|---|---|---|---|
| Quadrant | DetID | PixID | Counts | Sigma | Mean | Median | Sigma |
| A | 10 | 83 | 548820 | 4221.36 | 634 | 620 | 129.9 |
| A | 2 | 79 | 81464 | 622.53 | 634 | 620 | 129.9 |
| A | 12 | 189 | 70100 | 535.02 | 634 | 620 | 129.9 |
| B | 3 | 112 | 3819344 | 32083.39 | 617 | 600 | 119.0 |
| B | 0 | 190 | 149571 | 1251.59 | 617 | 600 | 119.0 |
| B | 5 | 255 | 76759 | 639.85 | 617 | 600 | 119.0 |
| C | 15 | 214 | 256636 | 1775.53 | 619 | 622 | 144.2 |
| C | 0 | 10 | 36979 | 252.15 | 619 | 622 | 144.2 |
| C | 14 | 254 | 28463 | 193.09 | 619 | 622 | 144.2 |
| D | 12 | 191 | 257289 | 1854.59 | 557 | 542 | 138.4 |
| D | 12 | 227 | 220579 | 1589.42 | 557 | 542 | 138.4 |
| D | 13 | 249 | 166806 | 1201.0 | 557 | 542 | 138.4 |
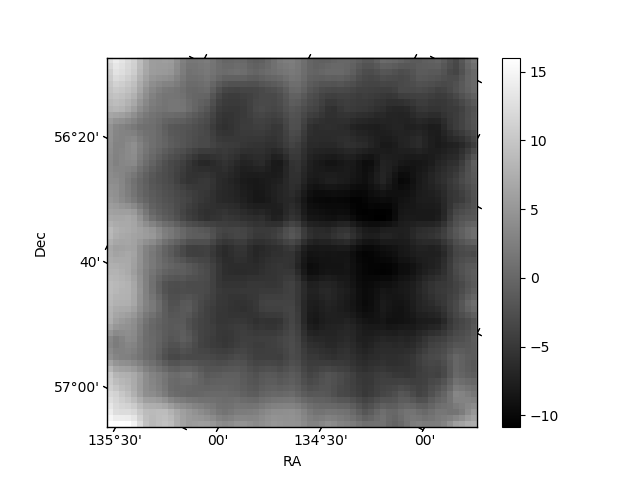
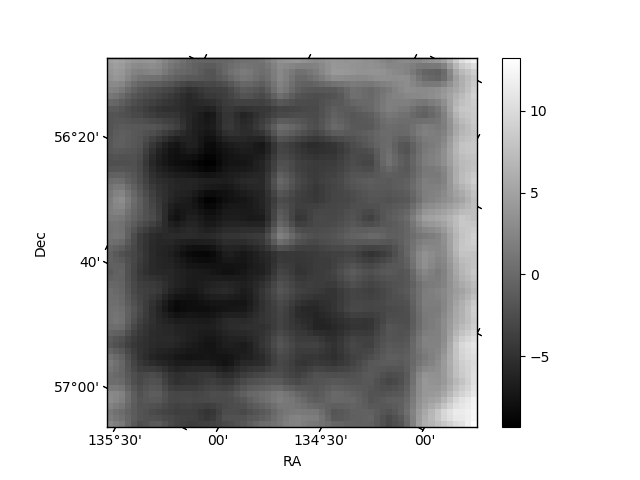
Histogram calculated using DETX and DETY for each event in the final _common_clean file
| Quadrant A | 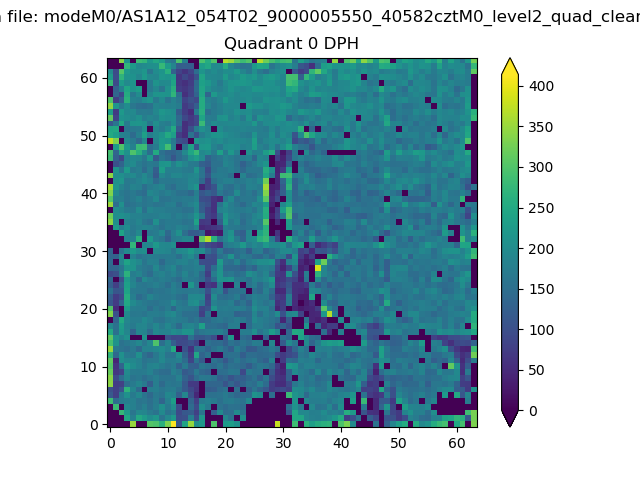 |
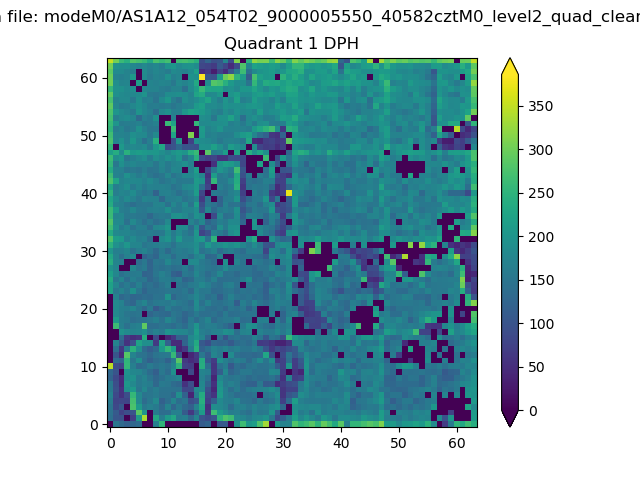 |
Quadrant B |
|---|---|---|---|
| Quadrant D |  |
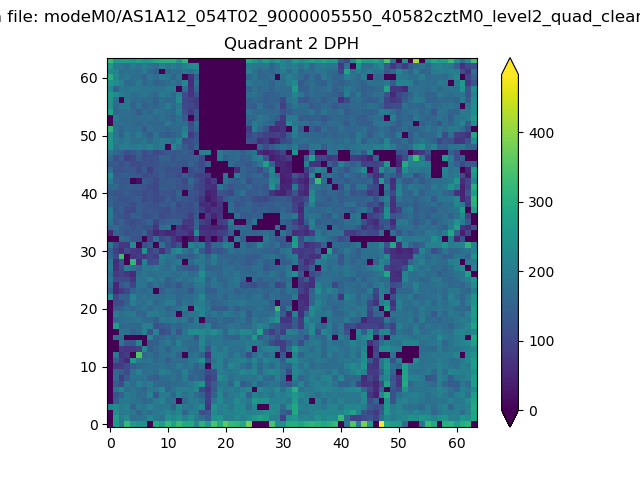 |
Quadrant C |
| Plot type | Count rate plots | Images |
|---|---|---|
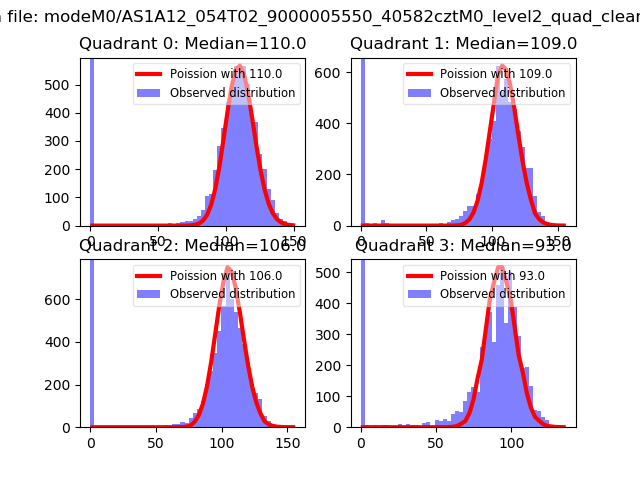
| Comparison with Poisson distribution Blue bars denote a histogram of data divided into 1 sec bins. Red curve is a Poisson curve with rate = median count rate of data. |
 |
 |
| Quadrant-wise count rates Data is divided into 100 sec bins |
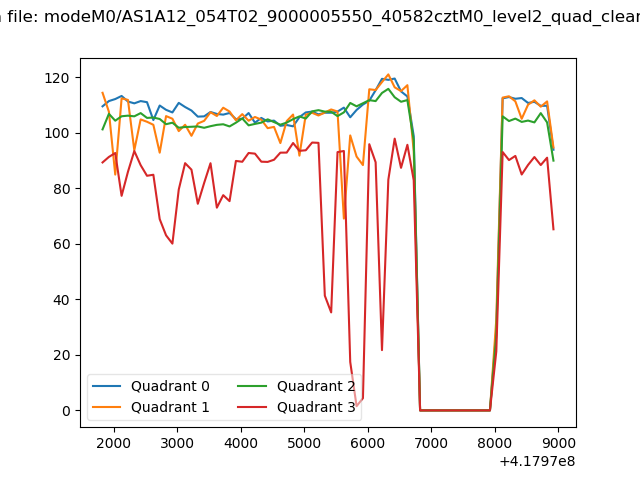 |
|
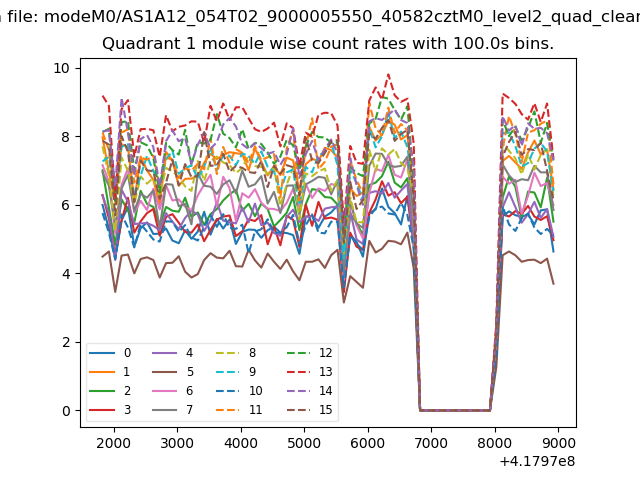
| Module-wise count rates for Quadrant A Data is divided into 100 sec bins |
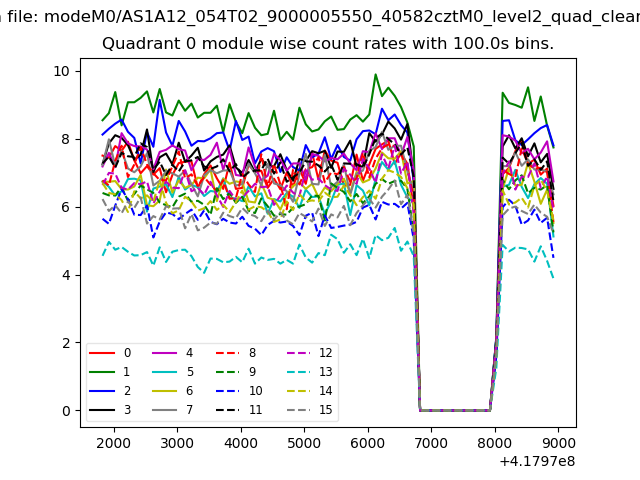 |
 |
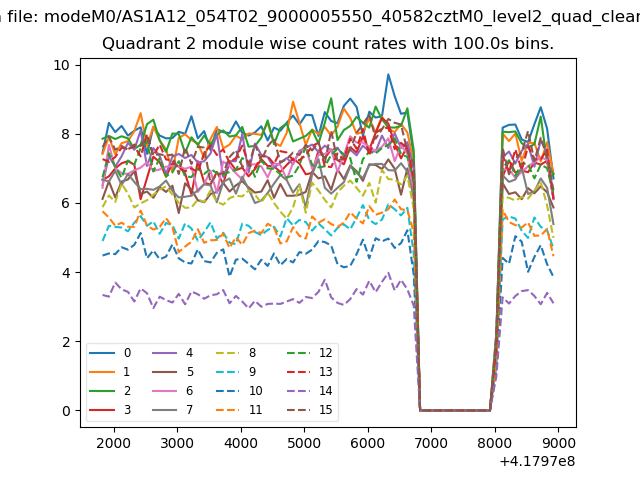
| Module-wise count rates for Quadrant B Data is divided into 100 sec bins |
 |
 |
| Module-wise count rates for Quadrant C Data is divided into 100 sec bins |
 |
 |
| Module-wise count rates for Quadrant D Data is divided into 100 sec bins |
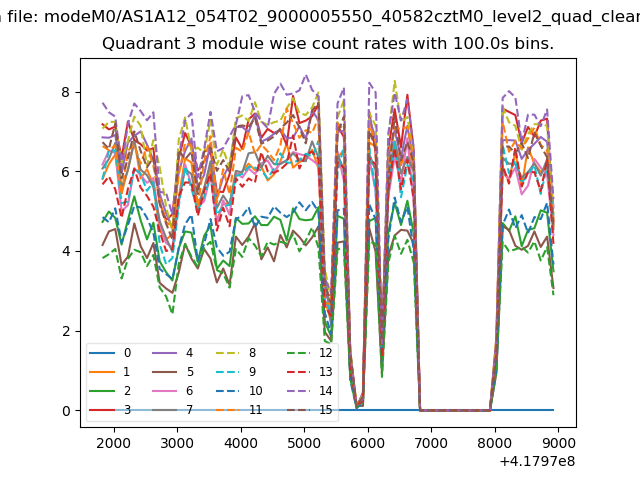 |
 |
| Parameter | Plot |
|---|---|
| CZT HV Monitor |  |
| D_VDD | 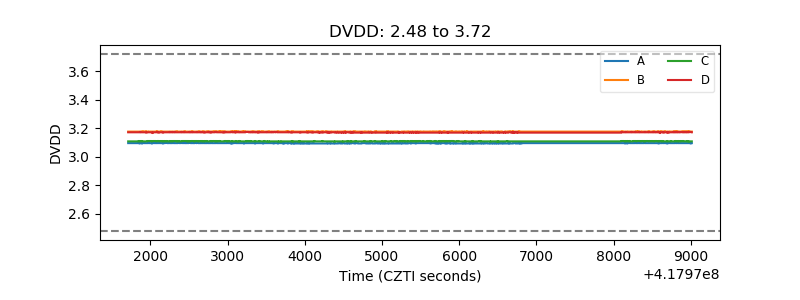 |
| Temperature 1 | 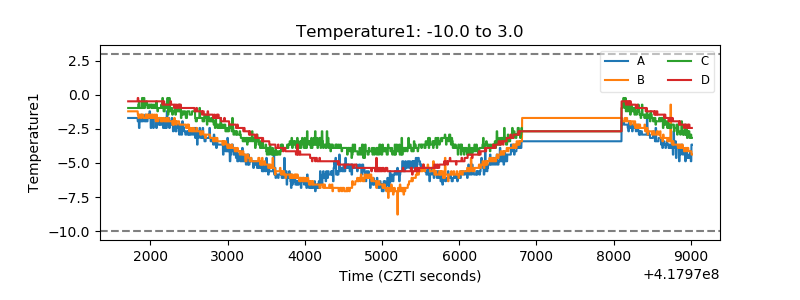 |
| Veto HV Monitor | 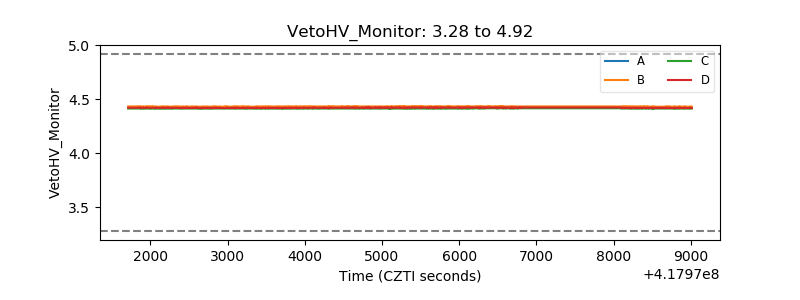 |
| Veto LLD | 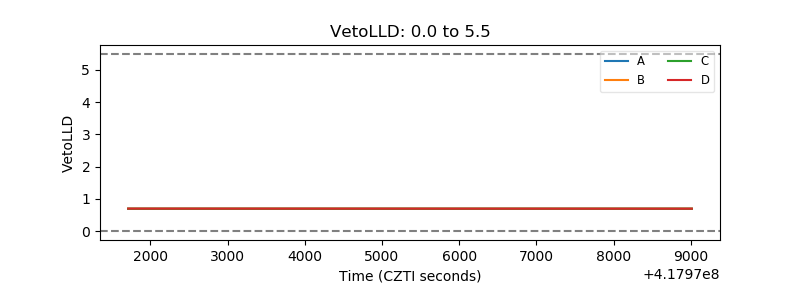 |
| Alpha Counter | 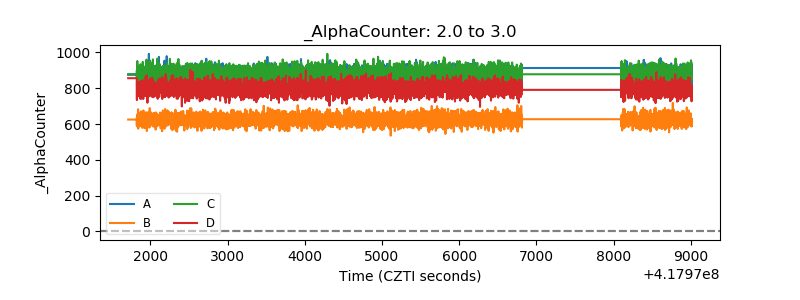 |
| _CPM_Rate | 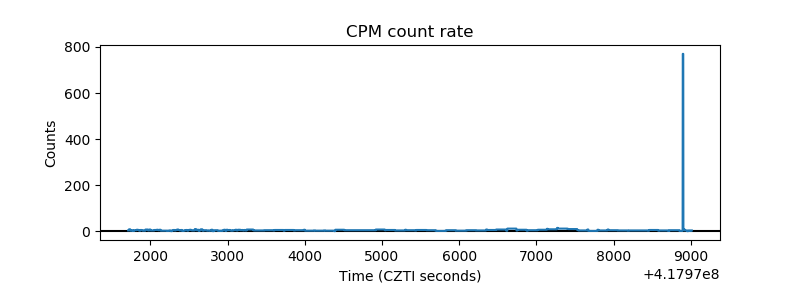 |
| CZT Counter | 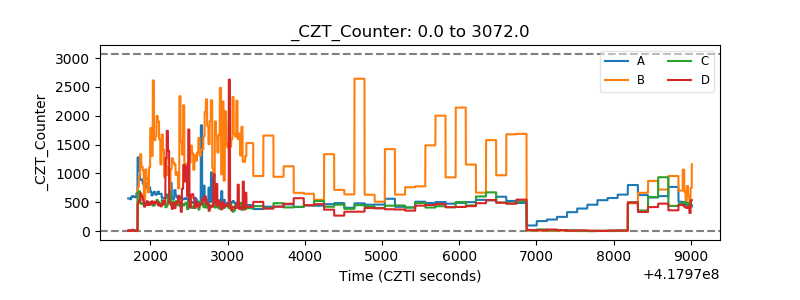 |
| +2.5 Volts monitor |  |
| +5 Volts monitor | 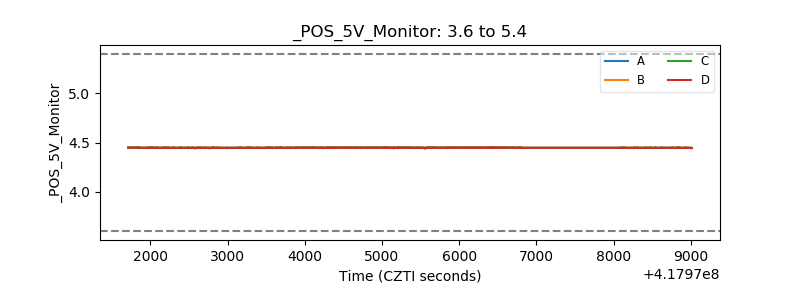 |
| _ROLL_ROT | 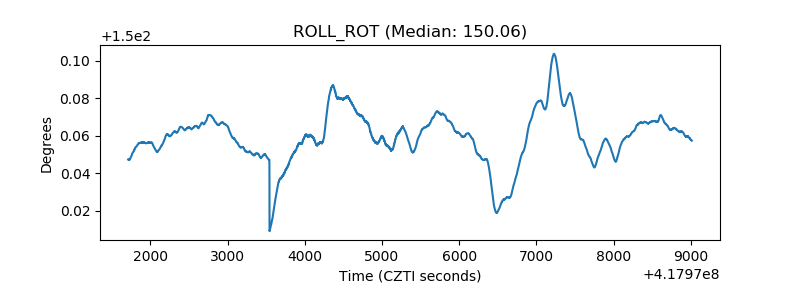 |
| _Roll_DEC | 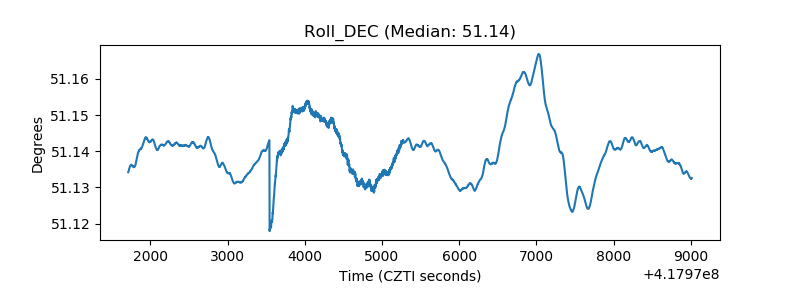 |
| _Roll_RA | 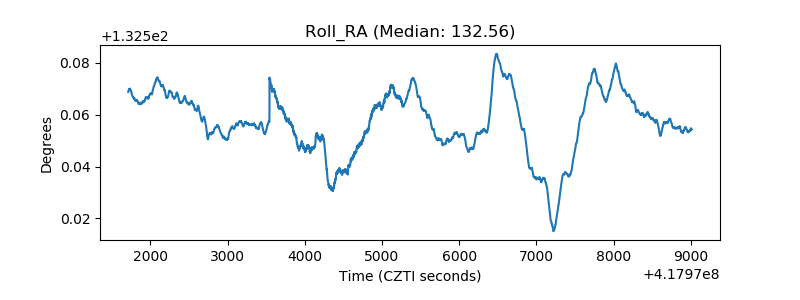 |
| Veto Counter | 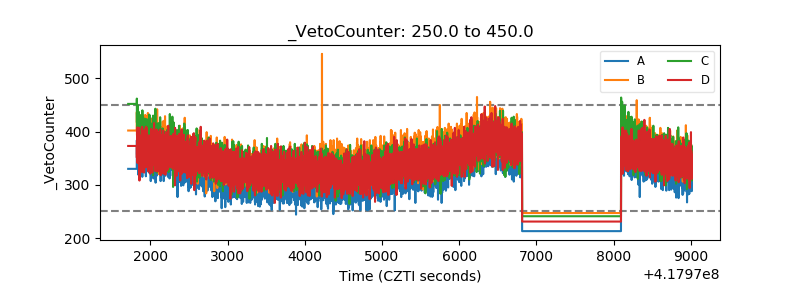 |