| Param | Original file | Final file |
|---|---|---|
| Filename | modeM0/AS1A12_054T02_9000005550_40586cztM0_level2.fits | modeM0/AS1A12_054T02_9000005550_40586cztM0_level2_quad_clean.evt |
| Size (bytes) | 300,061,440 | 84,110,400 |
| Size | 286.2 MB | 80.2 MB |
| Events in quadrant A | 2,932,161 | 590,164 |
| Events in quadrant B | 2,495,215 | 602,768 |
| Events in quadrant C | 2,552,339 | 579,223 |
| Events in quadrant D | 2,698,170 | 390,787 |
| Mode SS | |||
|---|---|---|---|
| Quadrant | BADHDUFLAG | Total packets | Discarded packets |
| A | 0 | 112 | 0 |
| B | 0 | 112 | 0 |
| C | 0 | 112 | 0 |
| D | 0 | 112 | 0 |
| Mode M0 | |||
|---|---|---|---|
| Quadrant | BADHDUFLAG | Total packets | Discarded packets |
| A | 0 | 12317 | 3 |
| B | 0 | 11330 | 2 |
| C | 0 | 11187 | 2 |
| D | 0 | 12288 | 2 |
| Mode M9 | |||
|---|---|---|---|
| Quadrant | BADHDUFLAG | Total packets | Discarded packets |
| A | 0 | 30 | 0 |
| B | 0 | 30 | 0 |
| C | 0 | 30 | 0 |
| D | 0 | 31 | 0 |
| Quadrant | Total seconds | Saturated seconds | Saturation percentage |
|---|---|---|---|
| A | 5481 | 9 | 0.164204% |
| B | 5481 | 22 | 0.401387% |
| C | 5481 | 13 | 0.237183% |
| D | 5481 | 1576 | 28.753877% |
Noise dominated data is calculated using 1-second bins in cleaned event files. If a bin has >2000 counts, and if more than 50% of those come from <1% of pixels, then it is considered to be noise-dominated and hence unusable.
| Quadrant | # 1 sec bins | Bins with >0 counts | Bins with >2000 counts | High rate bins dominated by noise | Noise dominated (total time) | Noise dominated (detector-on time) | Marked lightcurve |
|---|---|---|---|---|---|---|---|
| A | 7125 | 5482 | 4 | 4 | 0.06% | 0.07% | 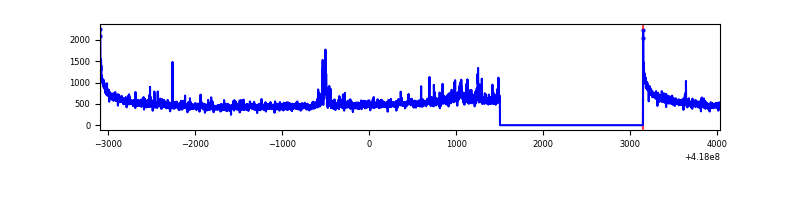 |
| B | 7125 | 5482 | 15 | 15 | 0.21% | 0.27% | 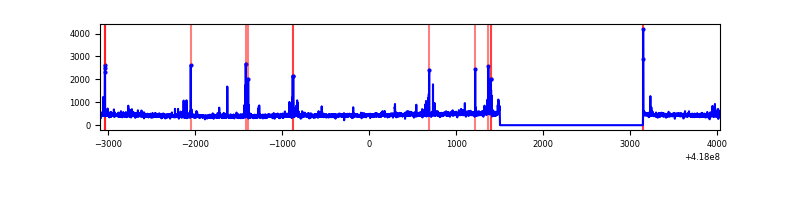 |
| C | 7125 | 5482 | 9 | 9 | 0.13% | 0.16% | 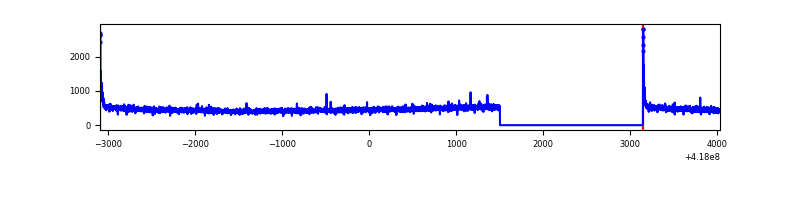 |
| D | 7124 | 5480 | 41 | 41 | 0.58% | 0.75% | 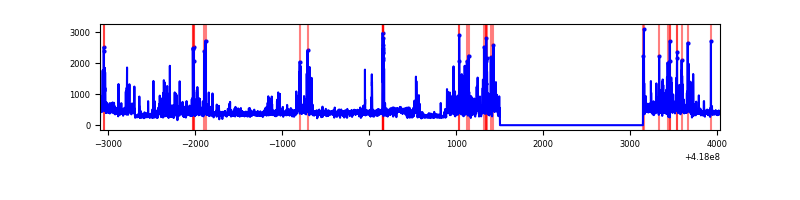 |
Top three noisy pixels from each quadrant. If the there are fewer than three noisy pixels in the level2.evt file, extra rows are filled as -1
| Pixel properties | Quadrant properties | ||||||
|---|---|---|---|---|---|---|---|
| Quadrant | DetID | PixID | Counts | Sigma | Mean | Median | Sigma |
| A | 10 | 83 | 483270 | 3959.8 | 586 | 573 | 121.9 |
| A | 12 | 189 | 140334 | 1146.53 | 586 | 573 | 121.9 |
| A | 2 | 79 | 31755 | 255.8 | 586 | 573 | 121.9 |
| B | 5 | 255 | 88897 | 773.06 | 584 | 567 | 114.3 |
| B | 0 | 190 | 28868 | 247.69 | 584 | 567 | 114.3 |
| B | 3 | 112 | 23373 | 199.6 | 584 | 567 | 114.3 |
| C | 15 | 214 | 238760 | 1750.34 | 576 | 579 | 136.1 |
| C | 0 | 10 | 51460 | 373.91 | 576 | 579 | 136.1 |
| C | 3 | 233 | 12359 | 86.57 | 576 | 579 | 136.1 |
| D | 12 | 191 | 324385 | 2862.85 | 457 | 445 | 113.2 |
| D | 2 | 249 | 178738 | 1575.68 | 457 | 445 | 113.2 |
| D | 2 | 250 | 101100 | 889.55 | 457 | 445 | 113.2 |
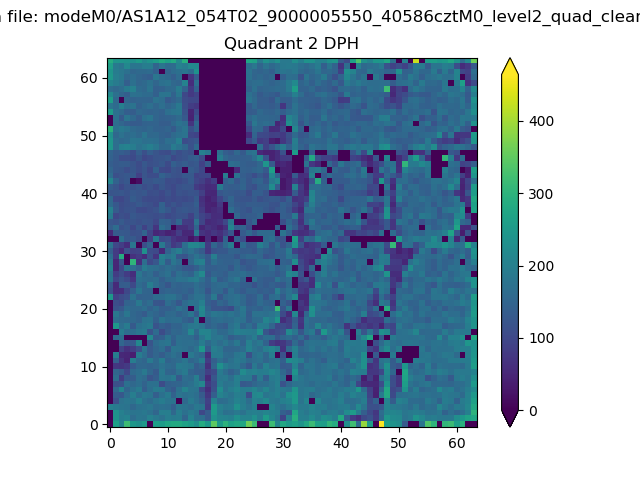
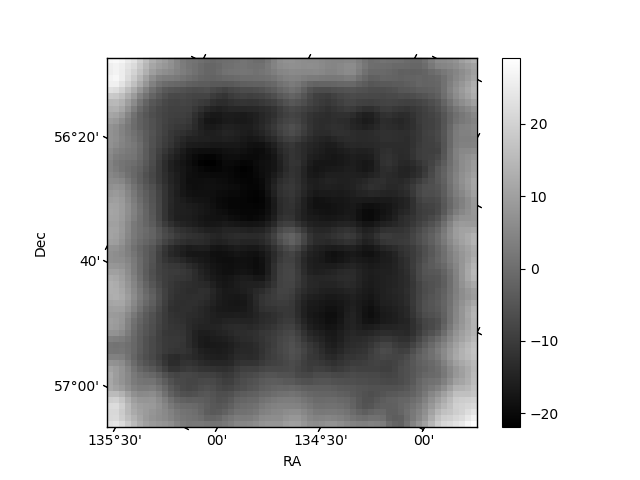
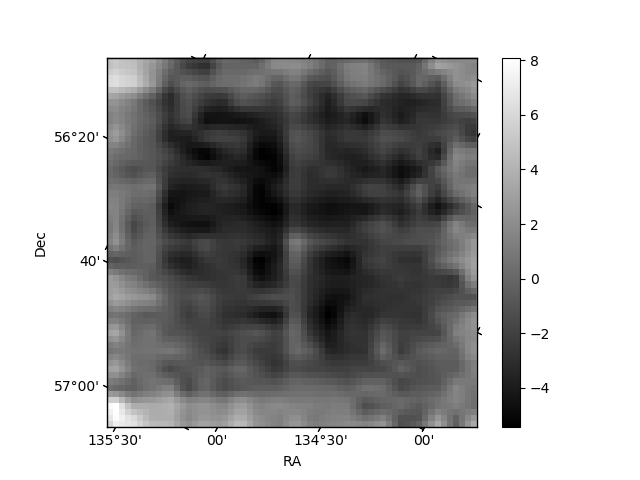
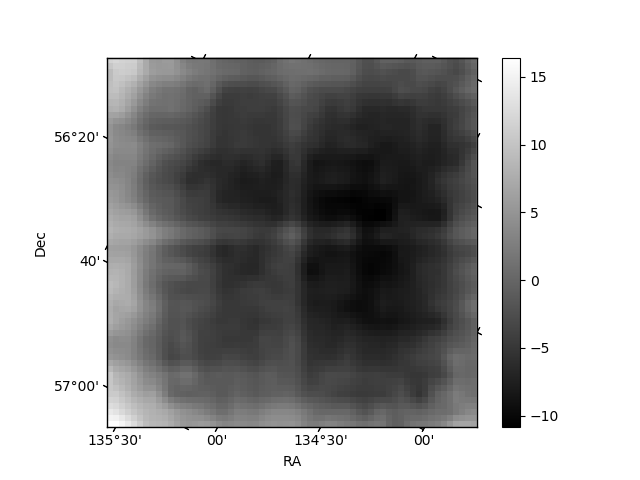
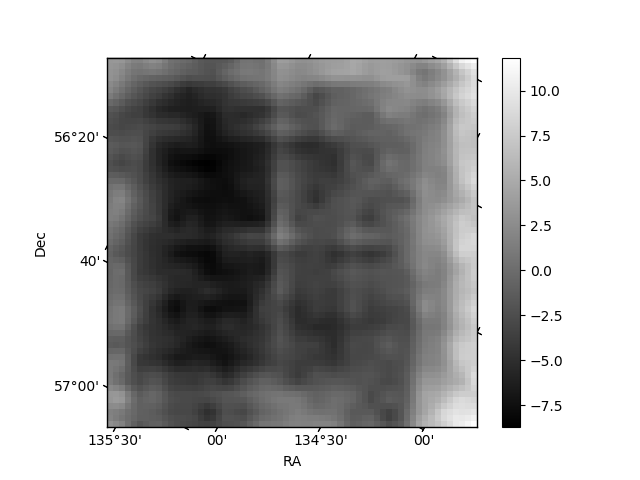
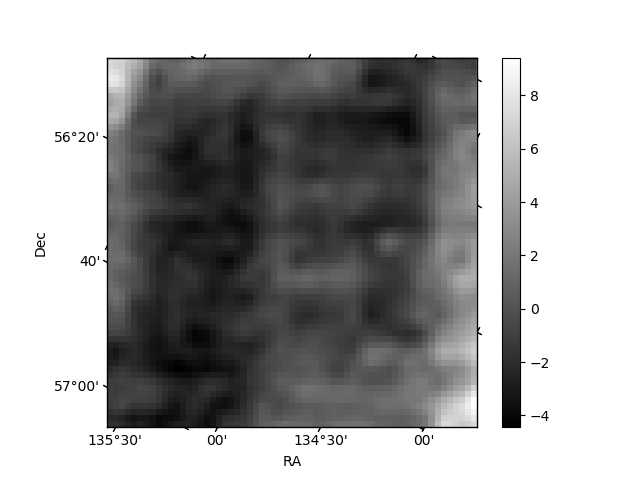
Histogram calculated using DETX and DETY for each event in the final _common_clean file
| Quadrant A | 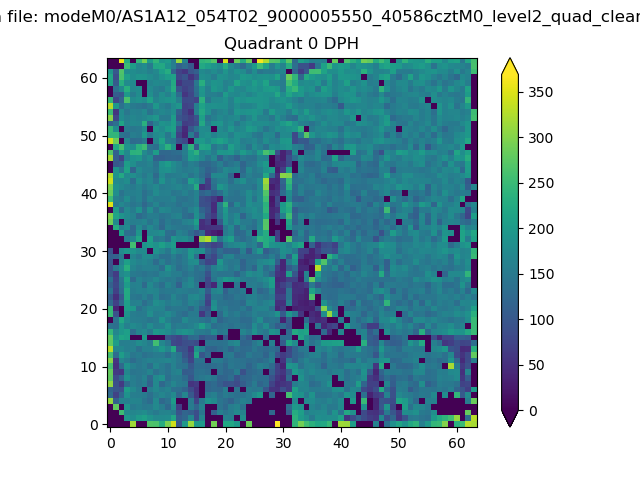 |
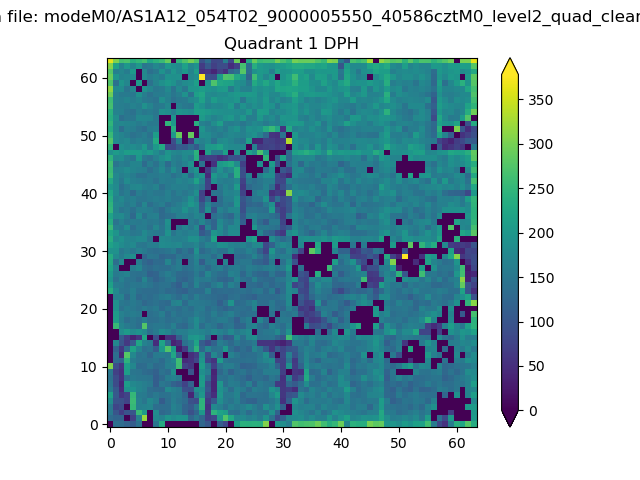 |
Quadrant B |
|---|---|---|---|
| Quadrant D | 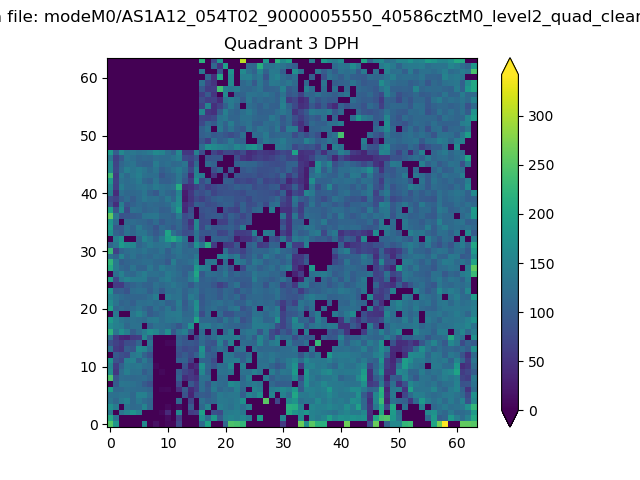 |
 |
Quadrant C |
| Plot type | Count rate plots | Images |
|---|---|---|
| Comparison with Poisson distribution Blue bars denote a histogram of data divided into 1 sec bins. Red curve is a Poisson curve with rate = median count rate of data. |
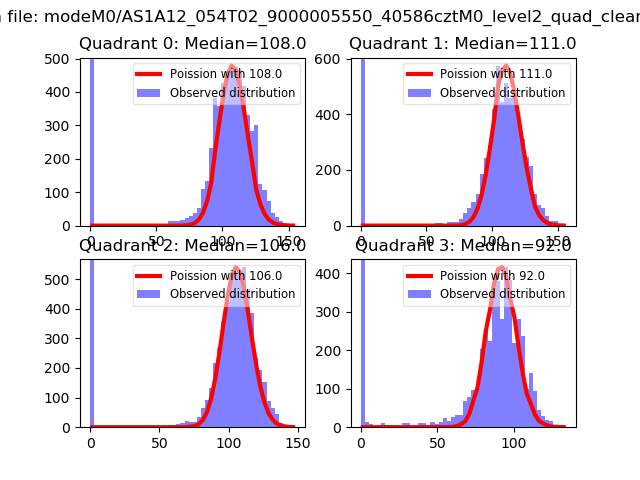 |
 |
| Quadrant-wise count rates Data is divided into 100 sec bins |
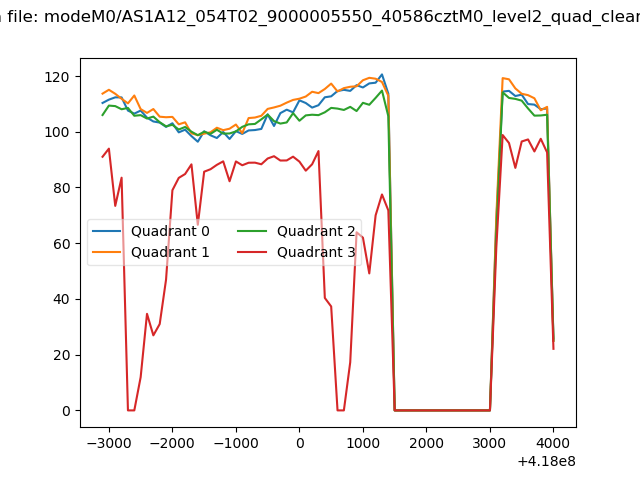 |
|
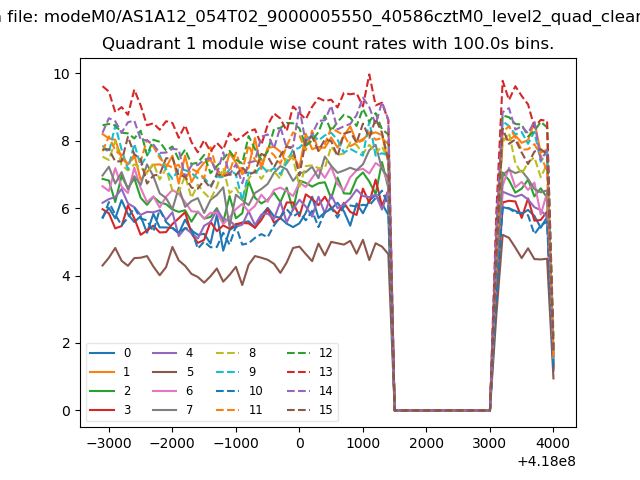
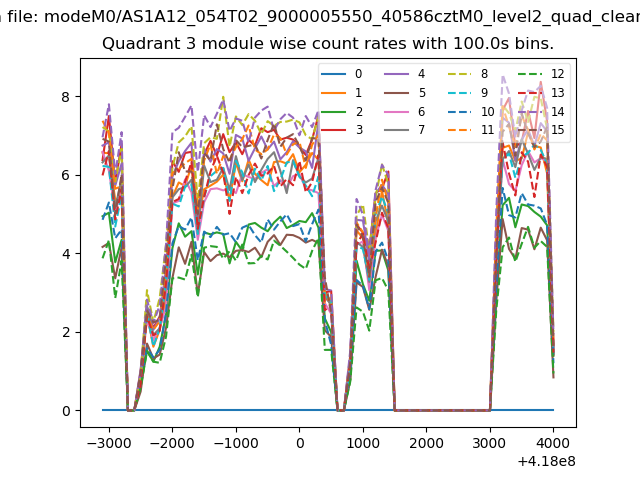
| Module-wise count rates for Quadrant A Data is divided into 100 sec bins |
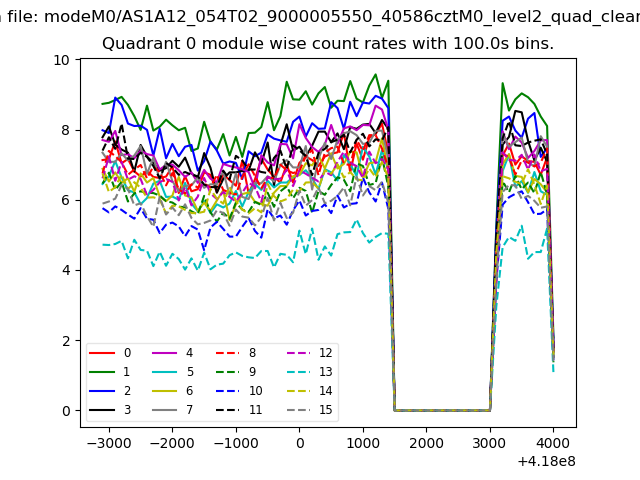 |
 |
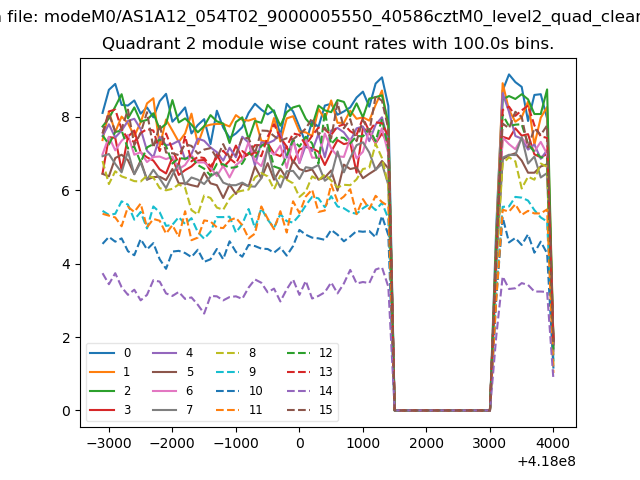
| Module-wise count rates for Quadrant B Data is divided into 100 sec bins |
 |
 |
| Module-wise count rates for Quadrant C Data is divided into 100 sec bins |
 |
 |
| Module-wise count rates for Quadrant D Data is divided into 100 sec bins |
 |
 |
| Parameter | Plot |
|---|---|
| CZT HV Monitor | 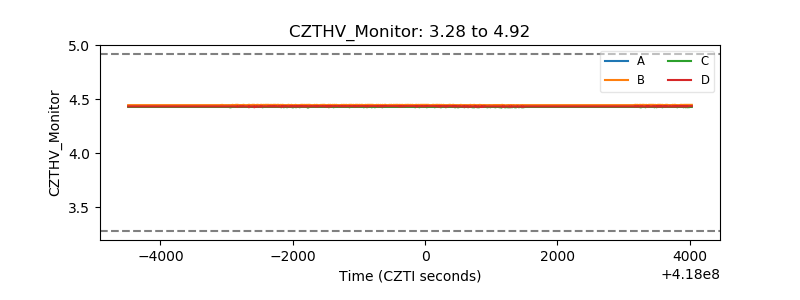 |
| D_VDD | 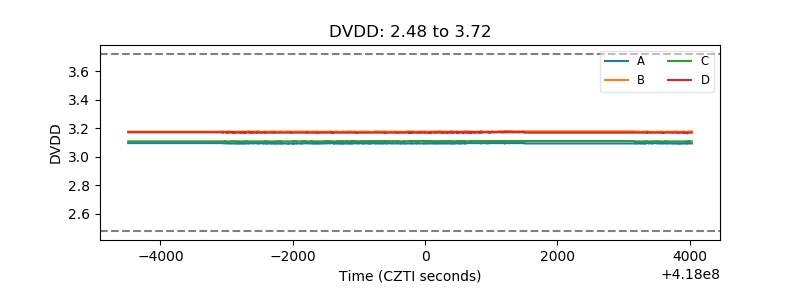 |
| Temperature 1 | 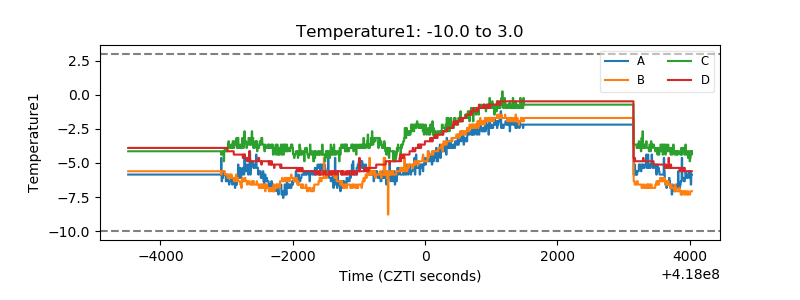 |
| Veto HV Monitor | 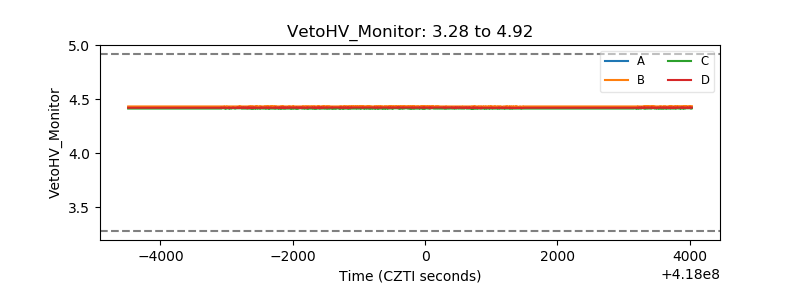 |
| Veto LLD | 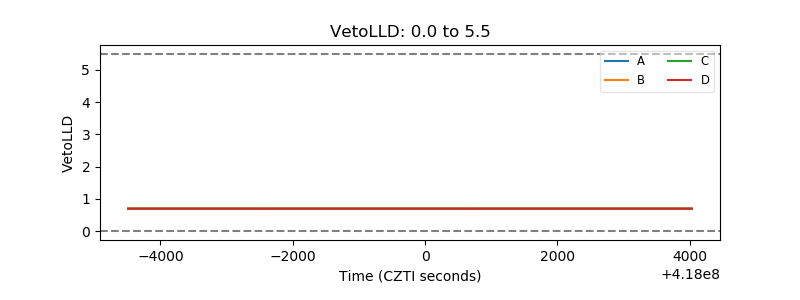 |
| Alpha Counter | 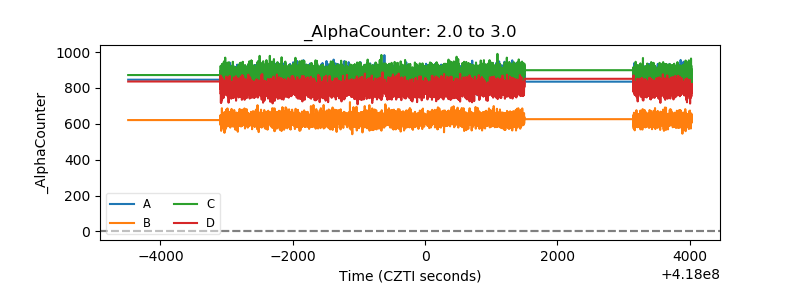 |
| _CPM_Rate | 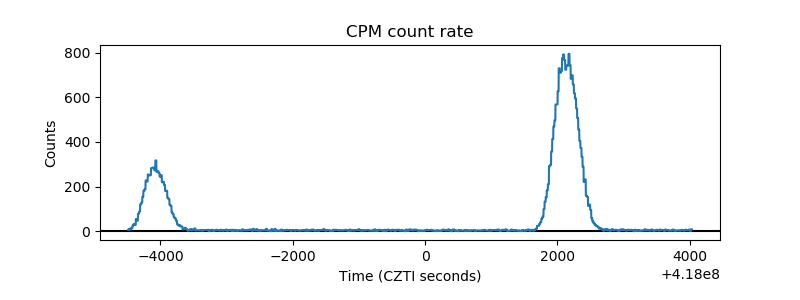 |
| CZT Counter | 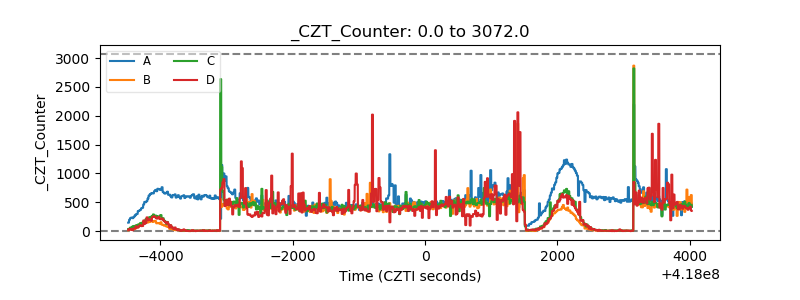 |
| +2.5 Volts monitor | 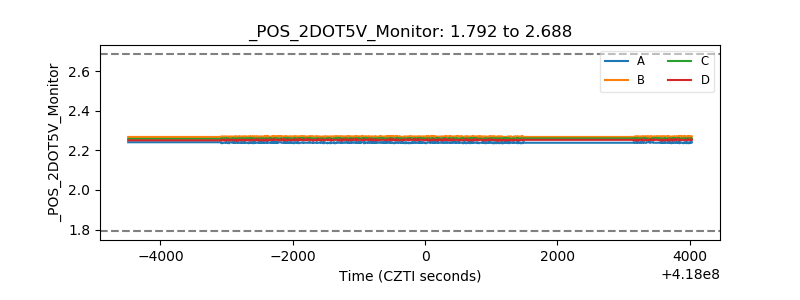 |
| +5 Volts monitor | 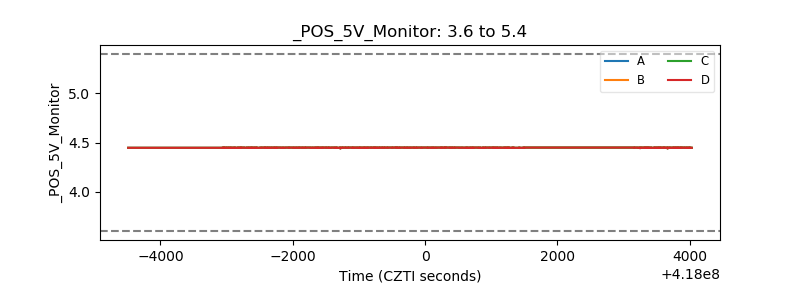 |
| _ROLL_ROT | 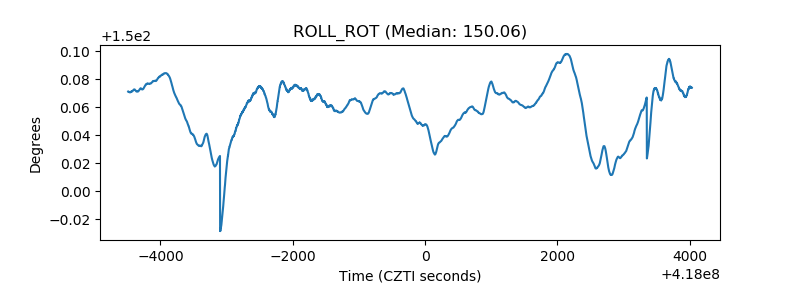 |
| _Roll_DEC | 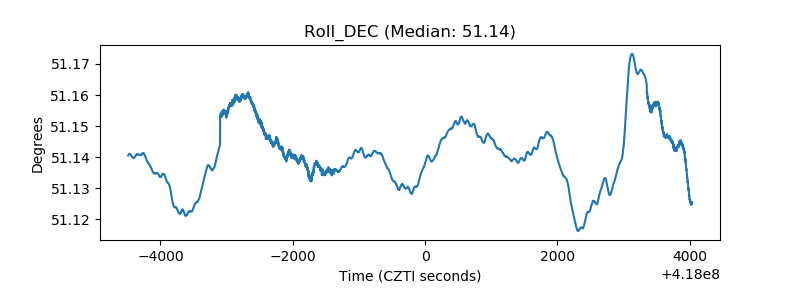 |
| _Roll_RA | 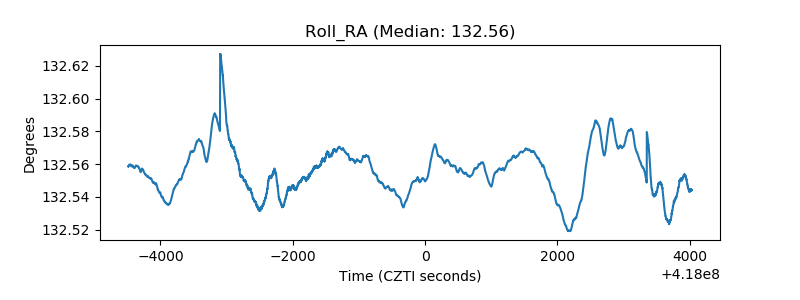 |
| Veto Counter | 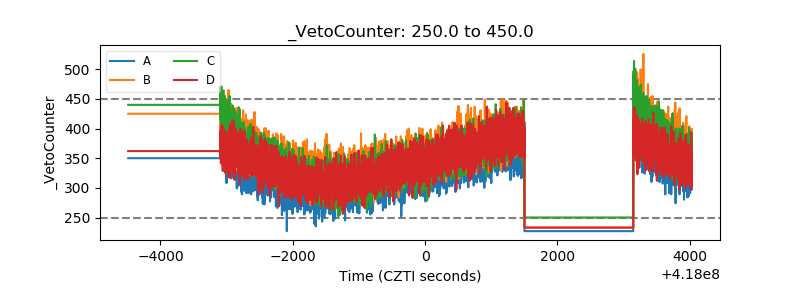 |