| Param | Original file | Final file |
|---|---|---|
| Filename | modeM0/AS1A12_054T02_9000005550_40588cztM0_level2.fits | modeM0/AS1A12_054T02_9000005550_40588cztM0_level2_quad_clean.evt |
| Size (bytes) | 295,211,520 | 87,229,440 |
| Size | 281.5 MB | 83.2 MB |
| Events in quadrant A | 2,770,232 | 591,709 |
| Events in quadrant B | 2,447,251 | 605,724 |
| Events in quadrant C | 2,649,303 | 578,093 |
| Events in quadrant D | 2,640,975 | 489,080 |
| Mode SS | |||
|---|---|---|---|
| Quadrant | BADHDUFLAG | Total packets | Discarded packets |
| A | 0 | 110 | 0 |
| B | 0 | 110 | 0 |
| C | 0 | 110 | 0 |
| D | 0 | 110 | 0 |
| Mode M0 | |||
|---|---|---|---|
| Quadrant | BADHDUFLAG | Total packets | Discarded packets |
| A | 0 | 11568 | 3 |
| B | 0 | 11088 | 2 |
| C | 0 | 11358 | 2 |
| D | 0 | 11825 | 2 |
| Mode M9 | |||
|---|---|---|---|
| Quadrant | BADHDUFLAG | Total packets | Discarded packets |
| A | 0 | 32 | 0 |
| B | 0 | 32 | 0 |
| C | 0 | 32 | 0 |
| D | 0 | 33 | 0 |
| Quadrant | Total seconds | Saturated seconds | Saturation percentage |
|---|---|---|---|
| A | 5377 | 11 | 0.204575% |
| B | 5377 | 20 | 0.371955% |
| C | 5377 | 32 | 0.595127% |
| D | 5377 | 507 | 9.429050% |
Noise dominated data is calculated using 1-second bins in cleaned event files. If a bin has >2000 counts, and if more than 50% of those come from <1% of pixels, then it is considered to be noise-dominated and hence unusable.
| Quadrant | # 1 sec bins | Bins with >0 counts | Bins with >2000 counts | High rate bins dominated by noise | Noise dominated (total time) | Noise dominated (detector-on time) | Marked lightcurve |
|---|---|---|---|---|---|---|---|
| A | 7170 | 5378 | 4 | 4 | 0.06% | 0.07% | 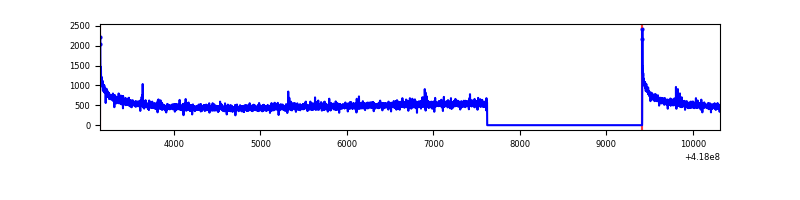 |
| B | 7170 | 5378 | 11 | 11 | 0.15% | 0.20% | 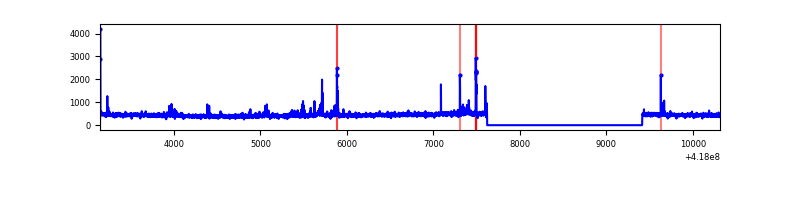 |
| C | 7170 | 5378 | 27 | 27 | 0.38% | 0.50% | 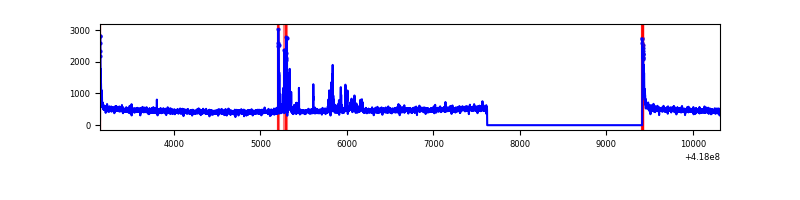 |
| D | 7170 | 5378 | 34 | 34 | 0.47% | 0.63% | 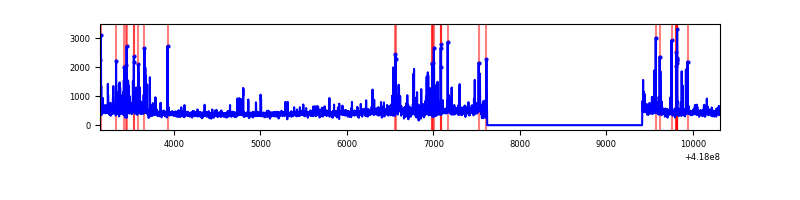 |
Top three noisy pixels from each quadrant. If the there are fewer than three noisy pixels in the level2.evt file, extra rows are filled as -1
| Pixel properties | Quadrant properties | ||||||
|---|---|---|---|---|---|---|---|
| Quadrant | DetID | PixID | Counts | Sigma | Mean | Median | Sigma |
| A | 10 | 83 | 486287 | 4031.37 | 584 | 572 | 120.5 |
| A | 12 | 189 | 13511 | 107.39 | 584 | 572 | 120.5 |
| A | 13 | 254 | 7075 | 53.97 | 584 | 572 | 120.5 |
| B | 0 | 190 | 99363 | 870.51 | 581 | 564 | 113.5 |
| B | 5 | 255 | 45670 | 397.42 | 581 | 564 | 113.5 |
| B | 12 | 111 | 14398 | 121.89 | 581 | 564 | 113.5 |
| C | 15 | 214 | 234019 | 1764.55 | 567 | 570 | 132.3 |
| C | 14 | 254 | 126596 | 952.58 | 567 | 570 | 132.3 |
| C | 0 | 10 | 68419 | 512.85 | 567 | 570 | 132.3 |
| D | 12 | 191 | 160713 | 1208.32 | 534 | 519 | 132.6 |
| D | 2 | 249 | 116912 | 877.93 | 534 | 519 | 132.6 |
| D | 13 | 249 | 112350 | 843.52 | 534 | 519 | 132.6 |
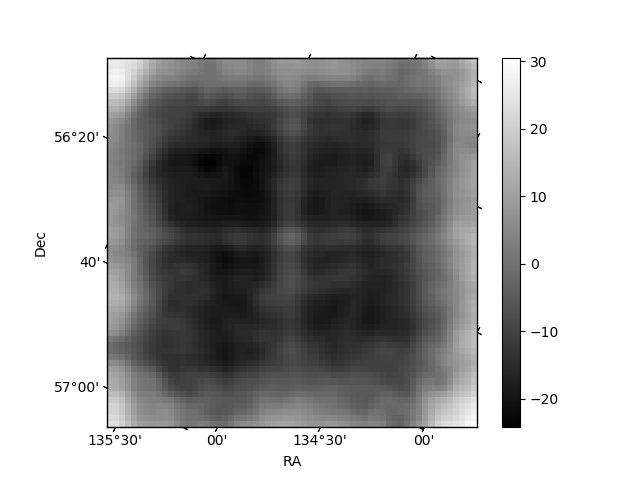
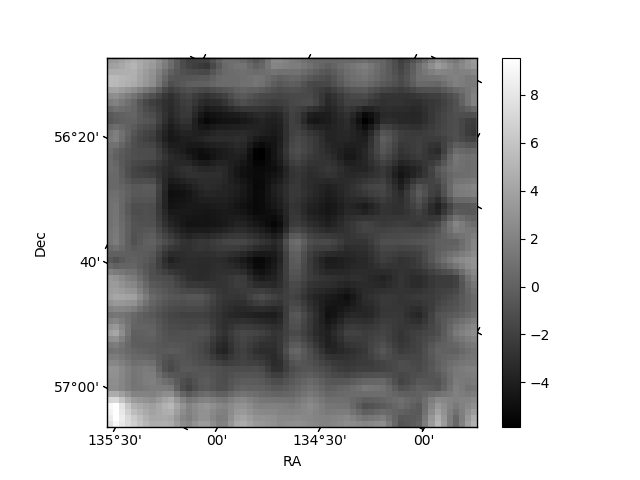
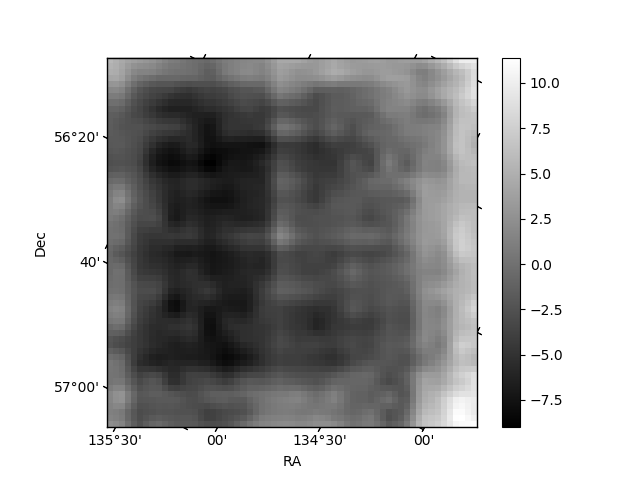
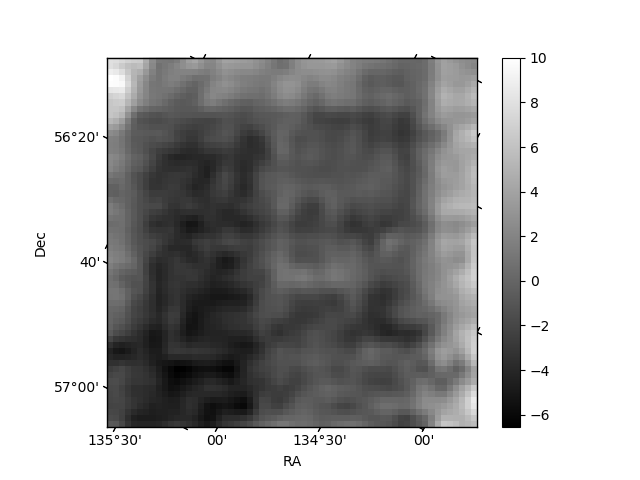
Histogram calculated using DETX and DETY for each event in the final _common_clean file
| Quadrant A | 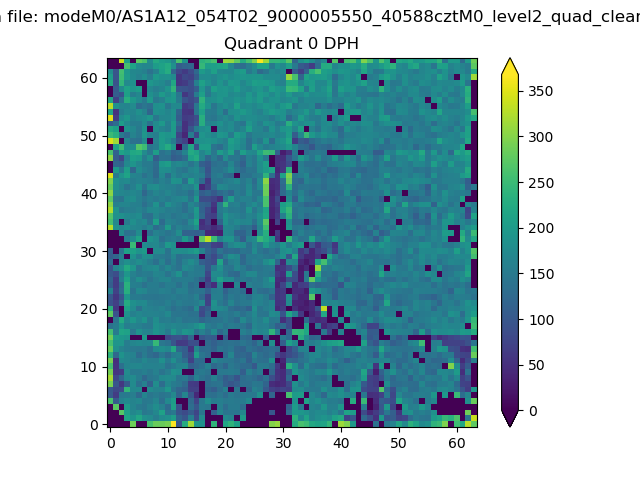 |
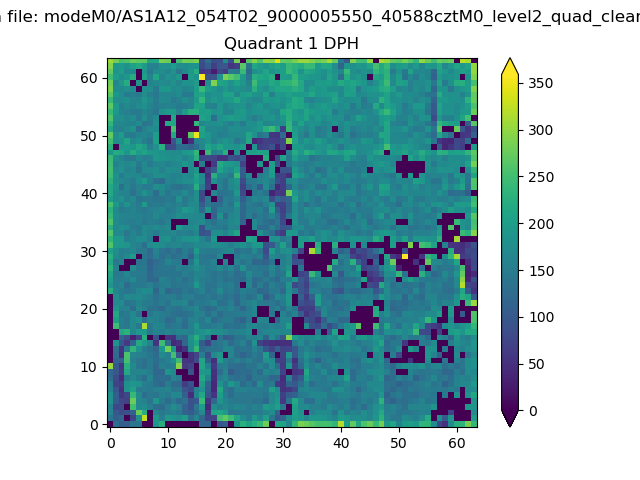 |
Quadrant B |
|---|---|---|---|
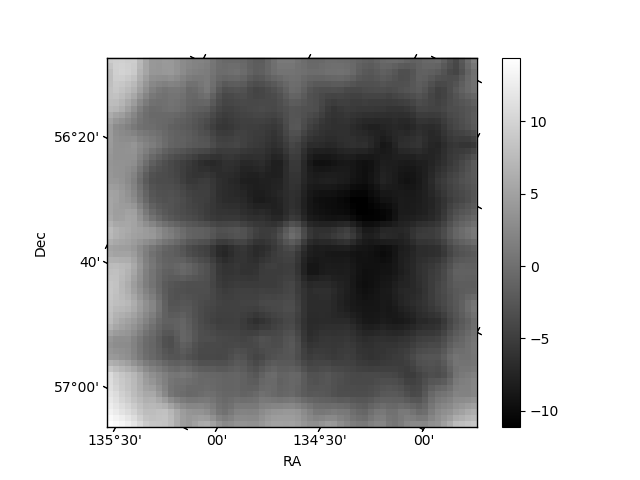
| Quadrant D | 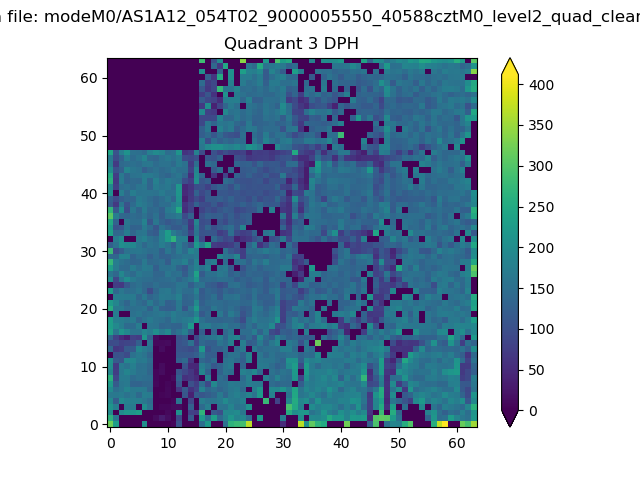 |
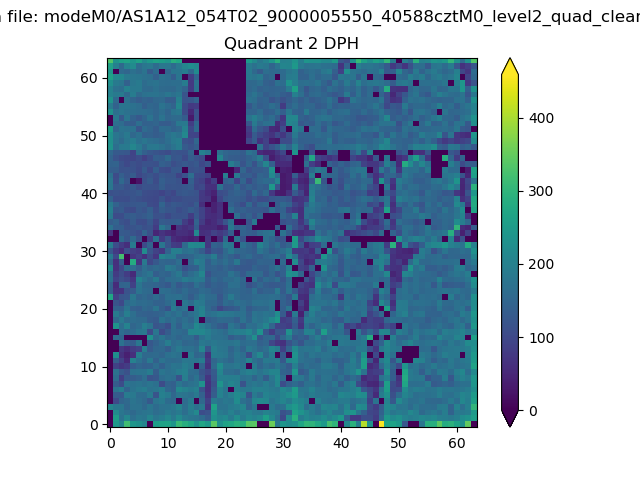 |
Quadrant C |
| Plot type | Count rate plots | Images |
|---|---|---|
| Comparison with Poisson distribution Blue bars denote a histogram of data divided into 1 sec bins. Red curve is a Poisson curve with rate = median count rate of data. |
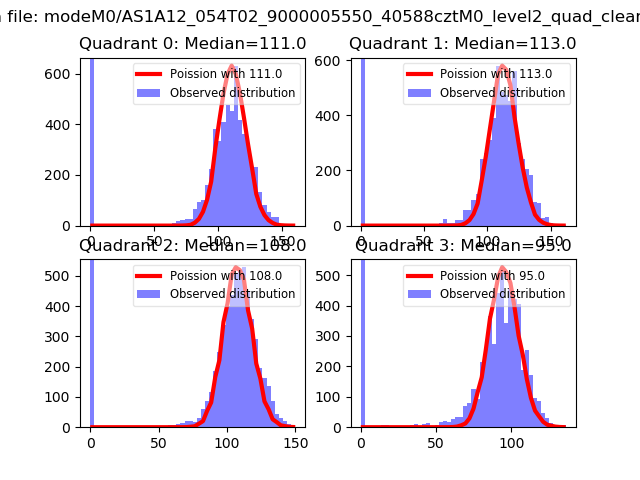 |
 |
| Quadrant-wise count rates Data is divided into 100 sec bins |
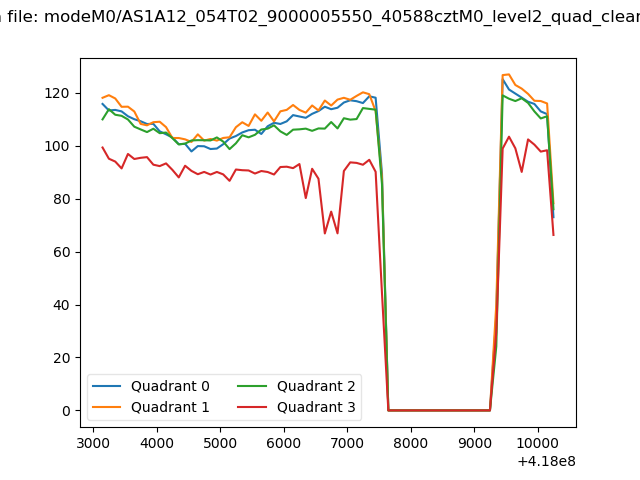 |
|
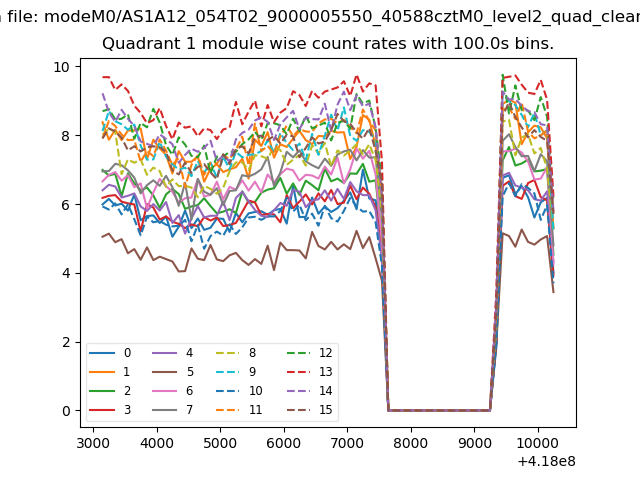
| Module-wise count rates for Quadrant A Data is divided into 100 sec bins |
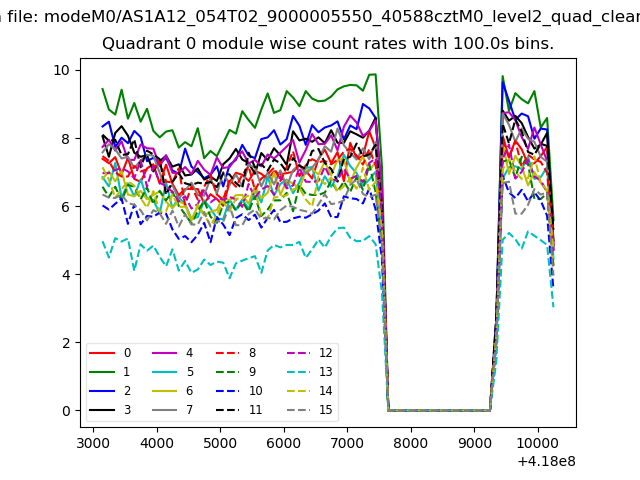 |
 |
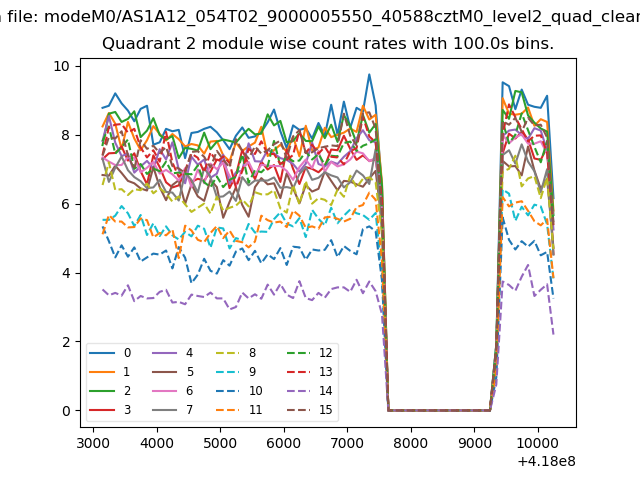
| Module-wise count rates for Quadrant B Data is divided into 100 sec bins |
 |
 |
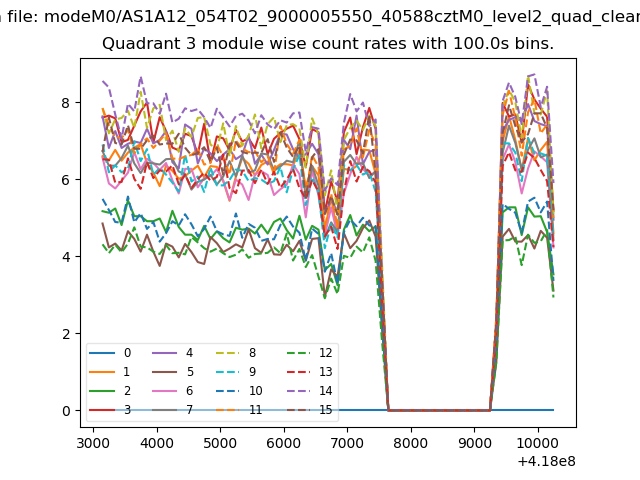
| Module-wise count rates for Quadrant C Data is divided into 100 sec bins |
 |
 |
| Module-wise count rates for Quadrant D Data is divided into 100 sec bins |
 |
 |
| Parameter | Plot |
|---|---|
| CZT HV Monitor | 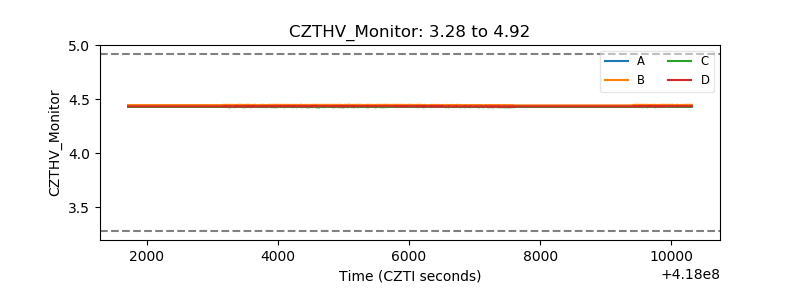 |
| D_VDD | 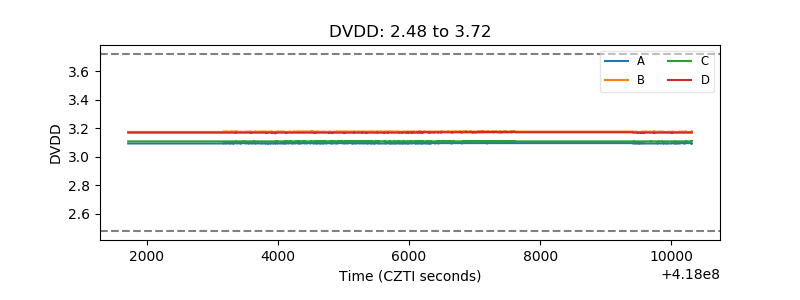 |
| Temperature 1 | 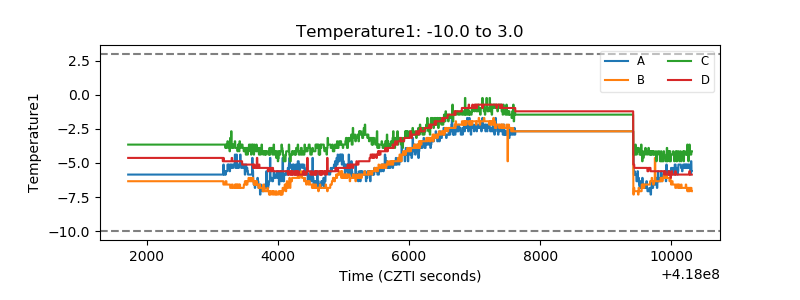 |
| Veto HV Monitor | 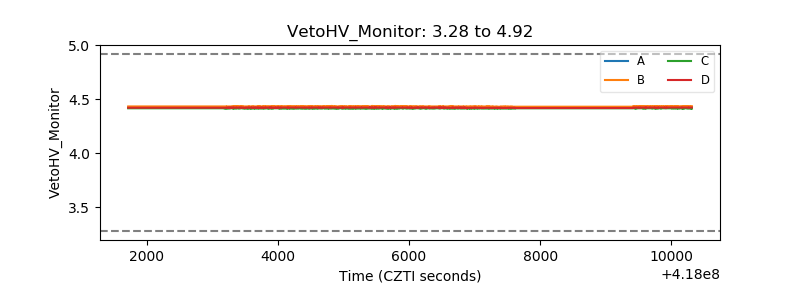 |
| Veto LLD | 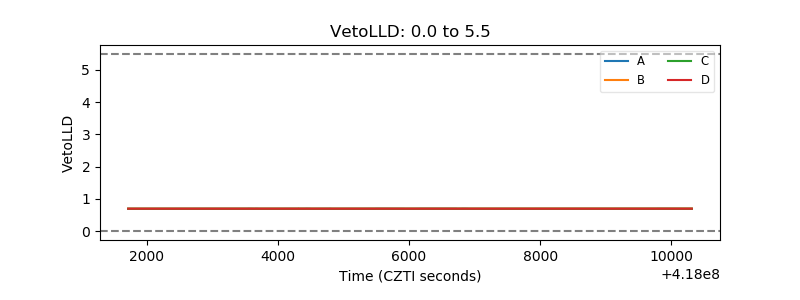 |
| Alpha Counter | 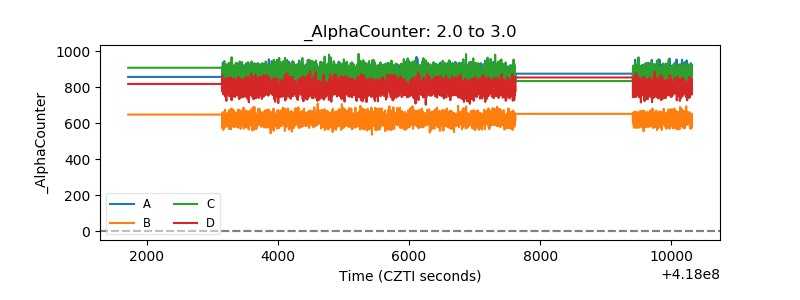 |
| _CPM_Rate | 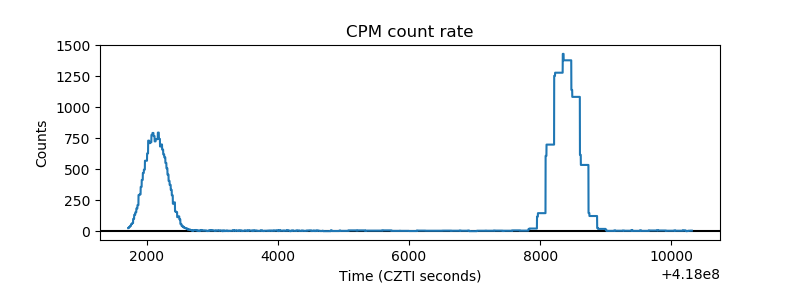 |
| CZT Counter | 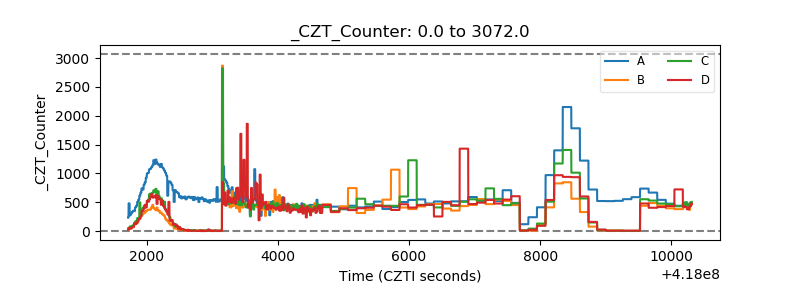 |
| +2.5 Volts monitor | 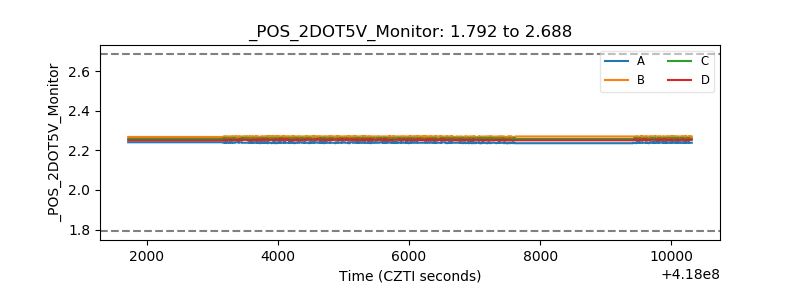 |
| +5 Volts monitor | 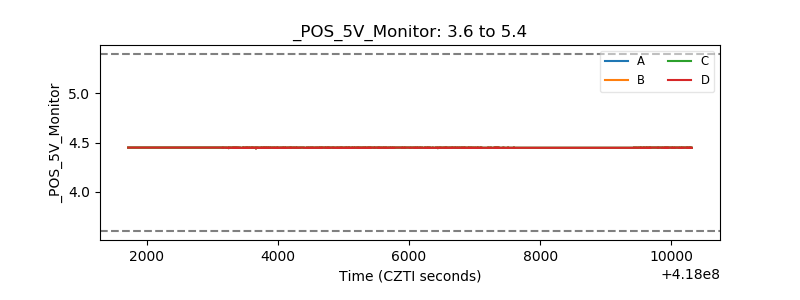 |
| _ROLL_ROT | 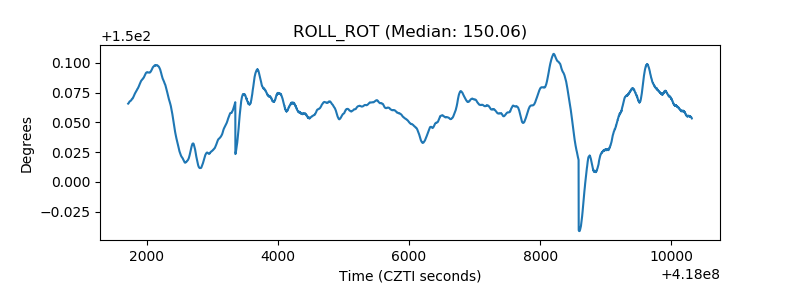 |
| _Roll_DEC | 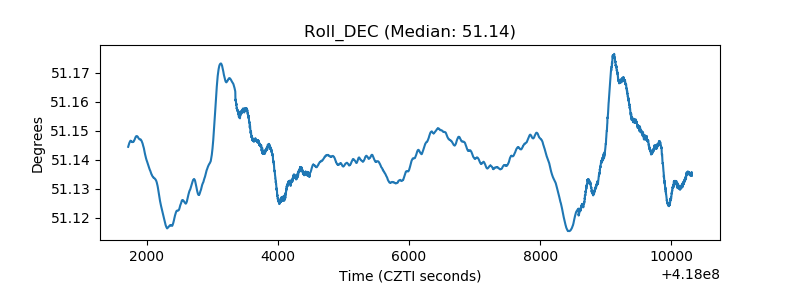 |
| _Roll_RA | 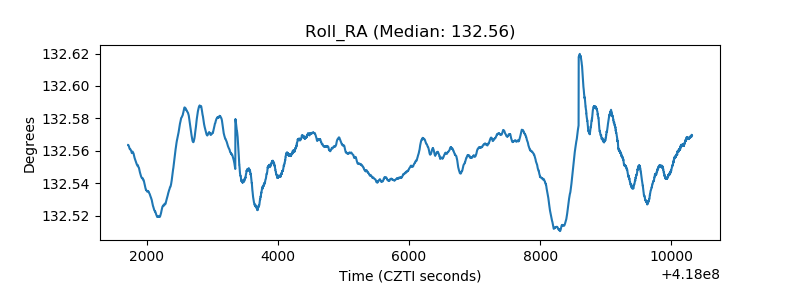 |
| Veto Counter | 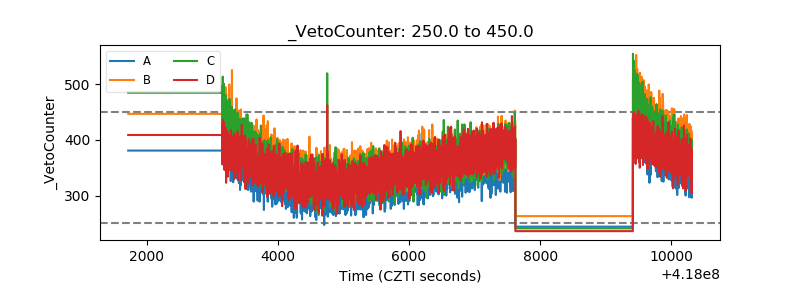 |