| Param | Original file | Final file |
|---|---|---|
| Filename | modeM0/AS1A12_054T02_9000005550_40589cztM0_level2.fits | modeM0/AS1A12_054T02_9000005550_40589cztM0_level2_quad_clean.evt |
| Size (bytes) | 304,764,480 | 92,332,800 |
| Size | 290.6 MB | 88.1 MB |
| Events in quadrant A | 2,875,833 | 628,860 |
| Events in quadrant B | 2,562,513 | 647,922 |
| Events in quadrant C | 2,643,758 | 612,732 |
| Events in quadrant D | 2,773,120 | 524,405 |
| Mode SS | |||
|---|---|---|---|
| Quadrant | BADHDUFLAG | Total packets | Discarded packets |
| A | 0 | 110 | 0 |
| B | 0 | 110 | 0 |
| C | 0 | 110 | 0 |
| D | 0 | 110 | 0 |
| Mode M0 | |||
|---|---|---|---|
| Quadrant | BADHDUFLAG | Total packets | Discarded packets |
| A | 0 | 11786 | 3 |
| B | 0 | 11380 | 2 |
| C | 0 | 11245 | 2 |
| D | 0 | 12054 | 2 |
| Mode M9 | |||
|---|---|---|---|
| Quadrant | BADHDUFLAG | Total packets | Discarded packets |
| A | 0 | 32 | 0 |
| B | 0 | 32 | 0 |
| C | 0 | 32 | 0 |
| D | 0 | 33 | 0 |
| Quadrant | Total seconds | Saturated seconds | Saturation percentage |
|---|---|---|---|
| A | 5461 | 11 | 0.201428% |
| B | 5461 | 9 | 0.164805% |
| C | 5461 | 22 | 0.402857% |
| D | 5461 | 422 | 7.727522% |
Noise dominated data is calculated using 1-second bins in cleaned event files. If a bin has >2000 counts, and if more than 50% of those come from <1% of pixels, then it is considered to be noise-dominated and hence unusable.
| Quadrant | # 1 sec bins | Bins with >0 counts | Bins with >2000 counts | High rate bins dominated by noise | Noise dominated (total time) | Noise dominated (detector-on time) | Marked lightcurve |
|---|---|---|---|---|---|---|---|
| A | 7374 | 5462 | 4 | 4 | 0.05% | 0.07% | 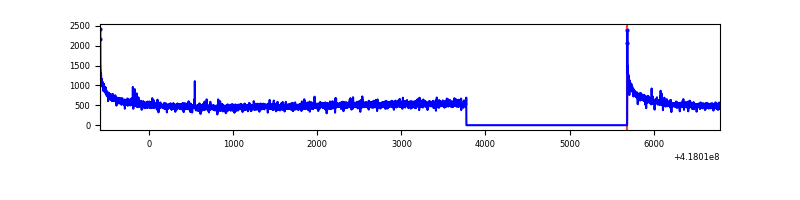 |
| B | 7374 | 5462 | 2 | 2 | 0.03% | 0.04% | 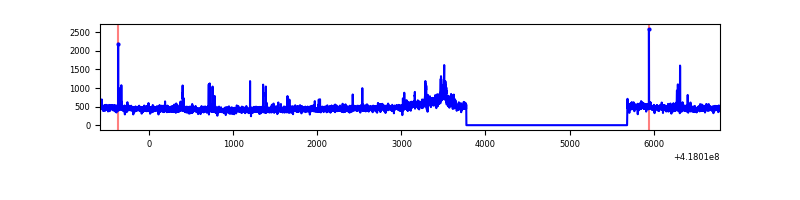 |
| C | 7374 | 5462 | 16 | 16 | 0.22% | 0.29% | 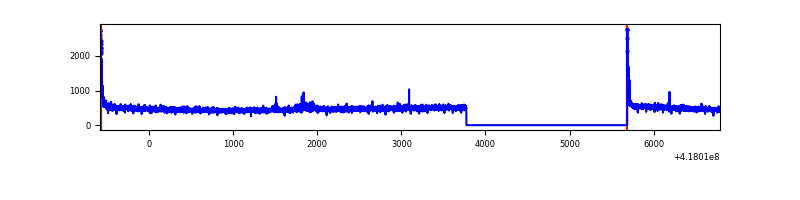 |
| D | 7374 | 5462 | 30 | 30 | 0.41% | 0.55% | 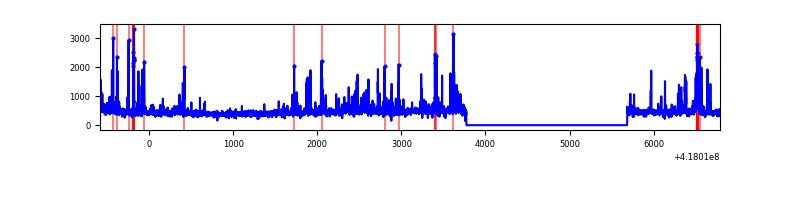 |
Top three noisy pixels from each quadrant. If the there are fewer than three noisy pixels in the level2.evt file, extra rows are filled as -1
| Pixel properties | Quadrant properties | ||||||
|---|---|---|---|---|---|---|---|
| Quadrant | DetID | PixID | Counts | Sigma | Mean | Median | Sigma |
| A | 10 | 83 | 495716 | 4025.26 | 607 | 597 | 123.0 |
| A | 3 | 1 | 12698 | 98.38 | 607 | 597 | 123.0 |
| A | 13 | 6 | 9362 | 71.26 | 607 | 597 | 123.0 |
| B | 5 | 255 | 117345 | 999.45 | 607 | 591 | 116.8 |
| B | 3 | 112 | 23366 | 194.96 | 607 | 591 | 116.8 |
| B | 0 | 190 | 18394 | 152.4 | 607 | 591 | 116.8 |
| C | 15 | 214 | 244820 | 1794.26 | 589 | 593 | 136.1 |
| C | 0 | 10 | 74792 | 545.11 | 589 | 593 | 136.1 |
| C | 9 | 187 | 26016 | 186.77 | 589 | 593 | 136.1 |
| D | 12 | 191 | 159837 | 1137.42 | 561 | 545 | 140.0 |
| D | 2 | 249 | 156271 | 1111.96 | 561 | 545 | 140.0 |
| D | 13 | 249 | 89360 | 634.18 | 561 | 545 | 140.0 |
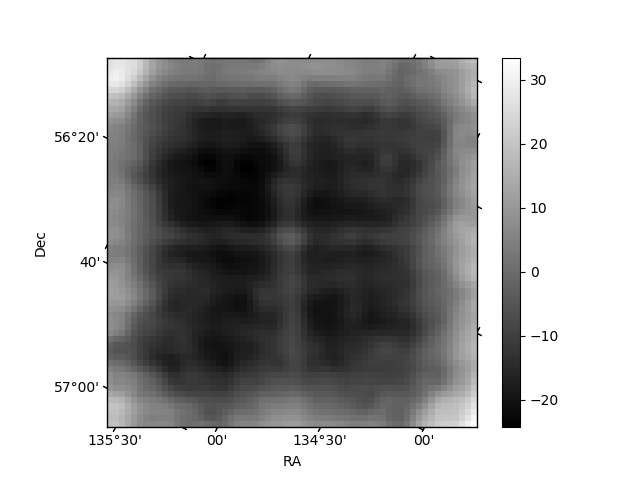
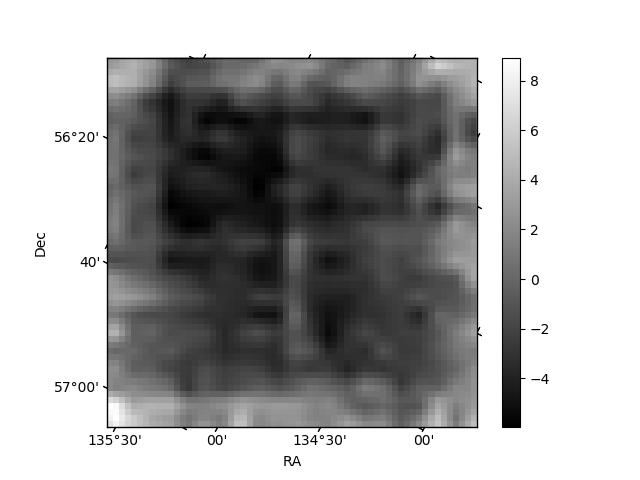
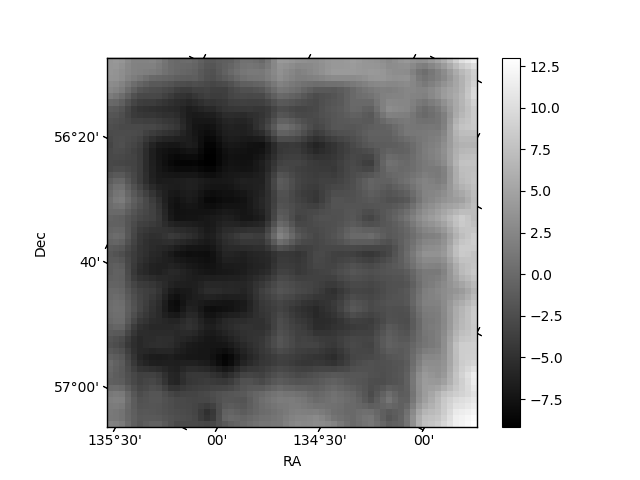
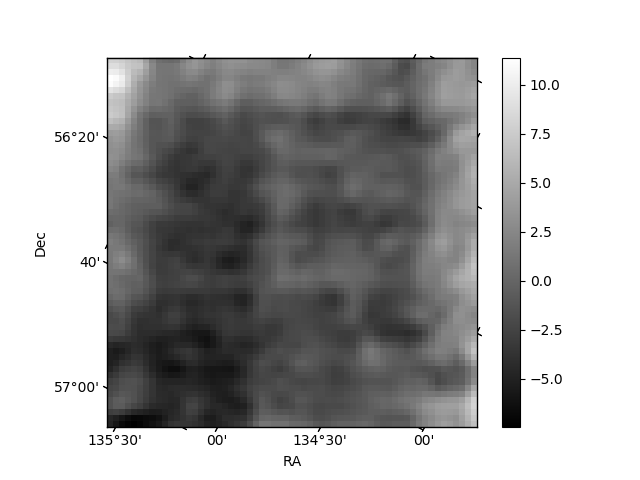
Histogram calculated using DETX and DETY for each event in the final _common_clean file
| Quadrant A | 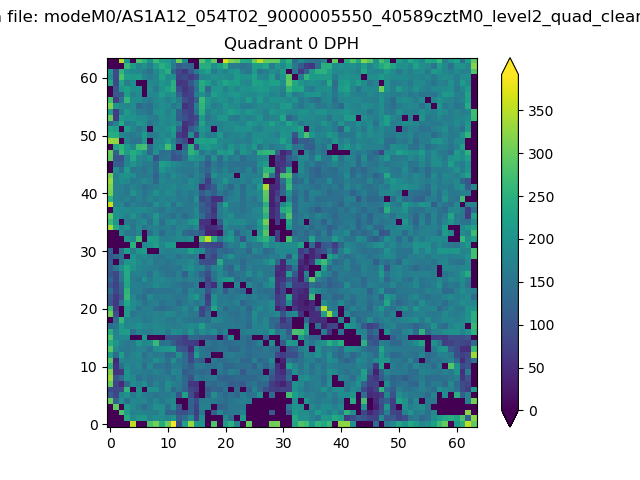 |
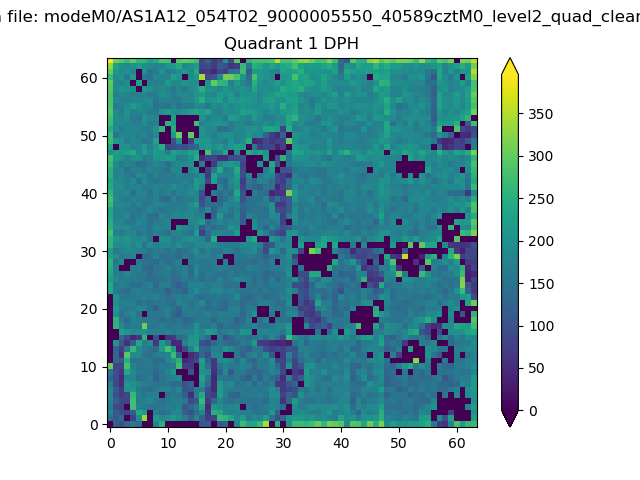 |
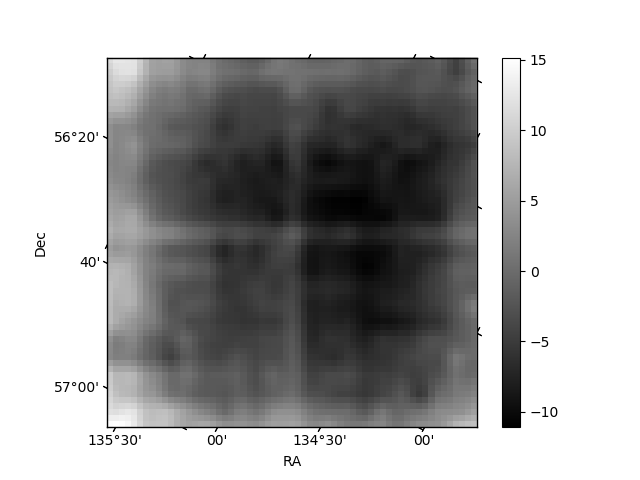
Quadrant B |
|---|---|---|---|
| Quadrant D | 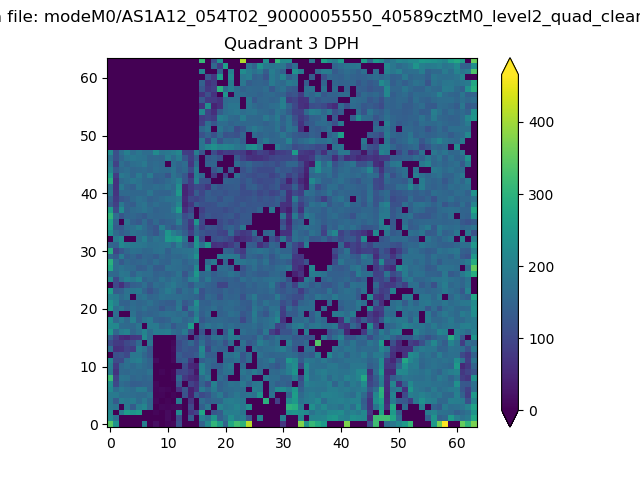 |
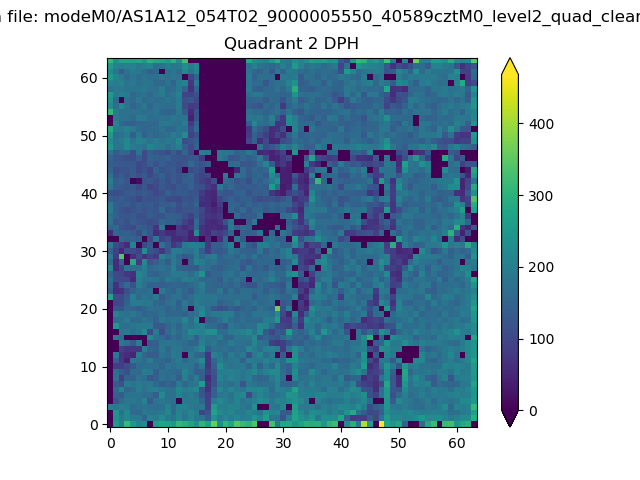 |
Quadrant C |
| Plot type | Count rate plots | Images |
|---|---|---|
| Comparison with Poisson distribution Blue bars denote a histogram of data divided into 1 sec bins. Red curve is a Poisson curve with rate = median count rate of data. |
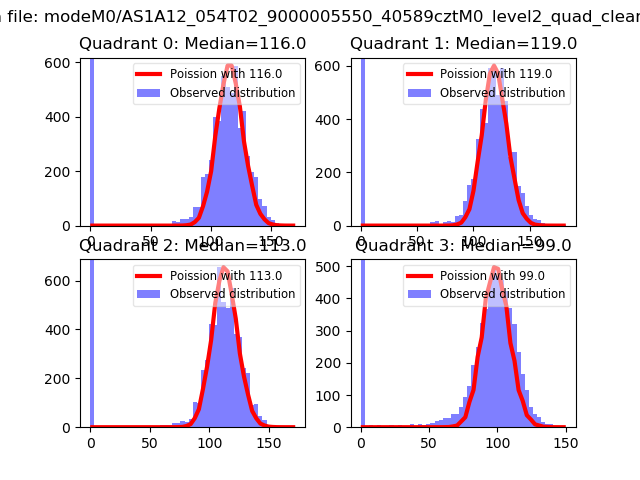 |
 |
| Quadrant-wise count rates Data is divided into 100 sec bins |
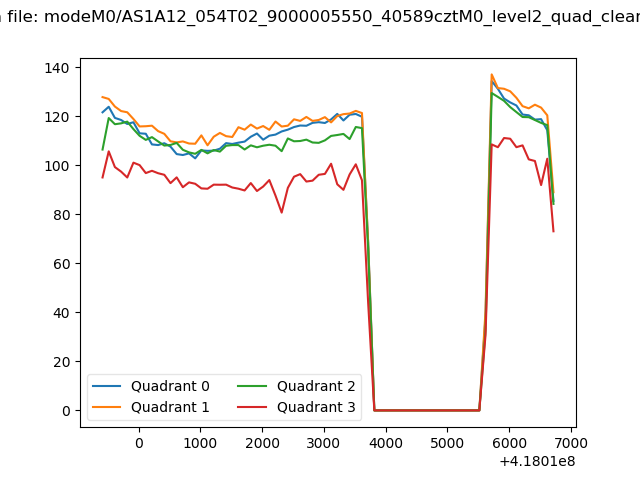 |
|
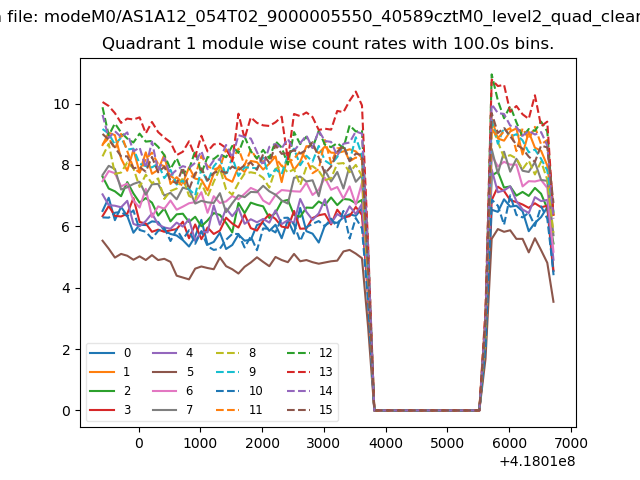
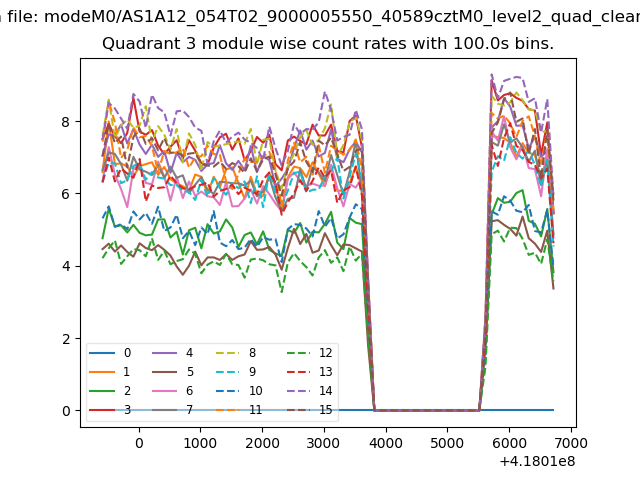
| Module-wise count rates for Quadrant A Data is divided into 100 sec bins |
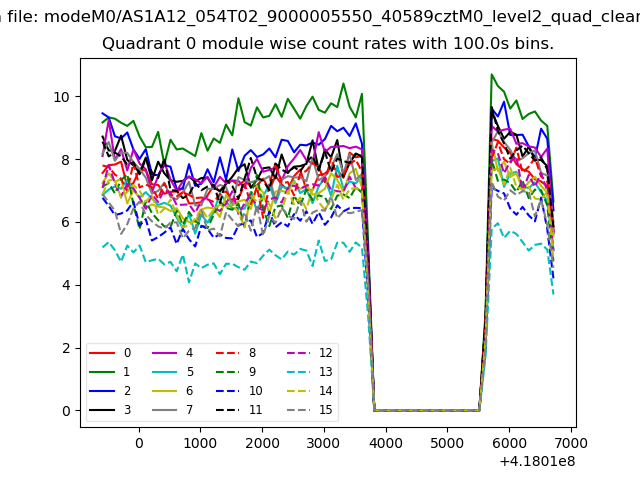 |
 |
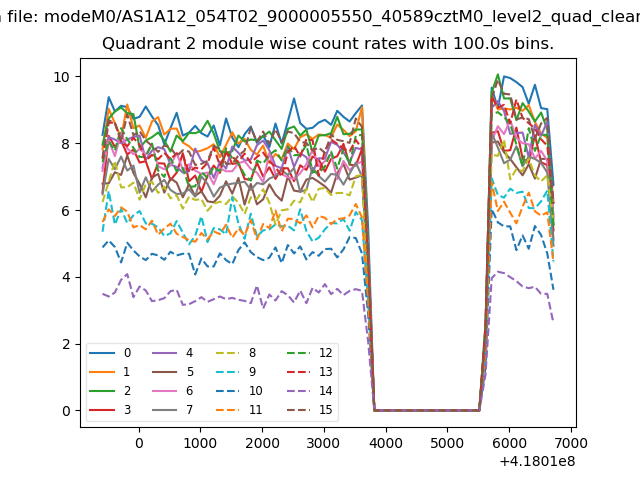
| Module-wise count rates for Quadrant B Data is divided into 100 sec bins |
 |
 |
| Module-wise count rates for Quadrant C Data is divided into 100 sec bins |
 |
 |
| Module-wise count rates for Quadrant D Data is divided into 100 sec bins |
 |
 |
| Parameter | Plot |
|---|---|
| CZT HV Monitor | 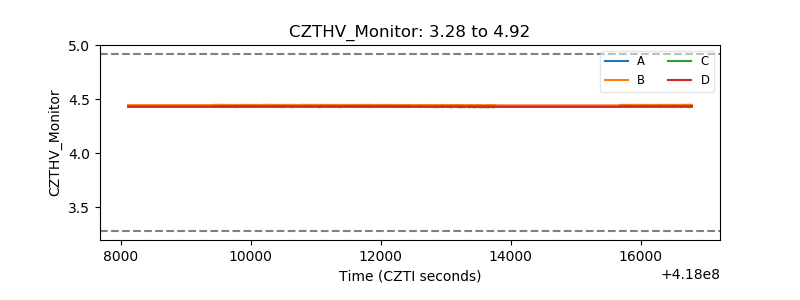 |
| D_VDD | 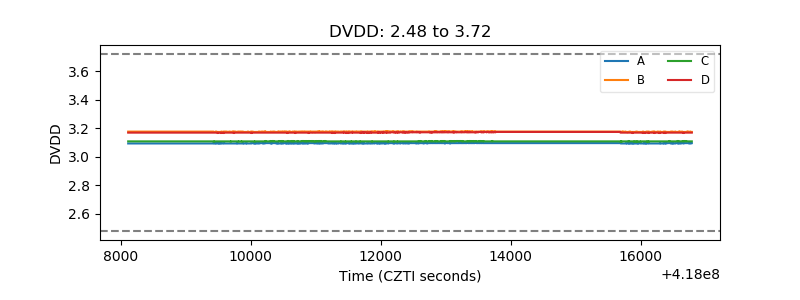 |
| Temperature 1 | 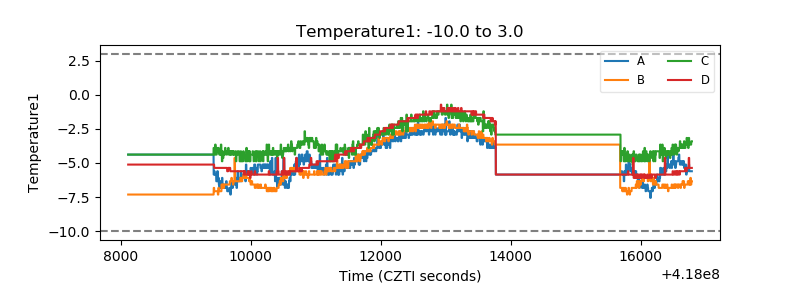 |
| Veto HV Monitor | 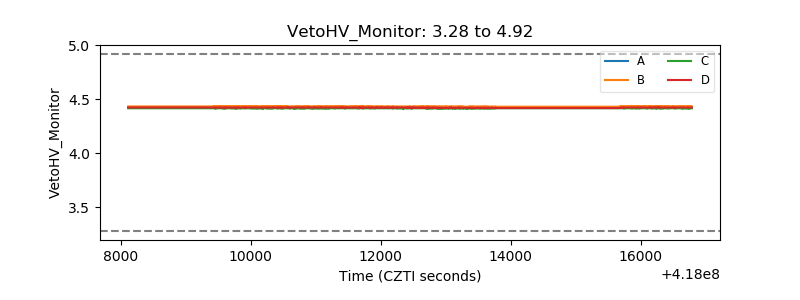 |
| Veto LLD | 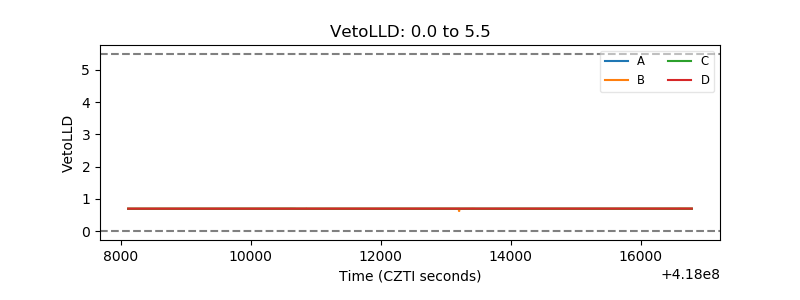 |
| Alpha Counter | 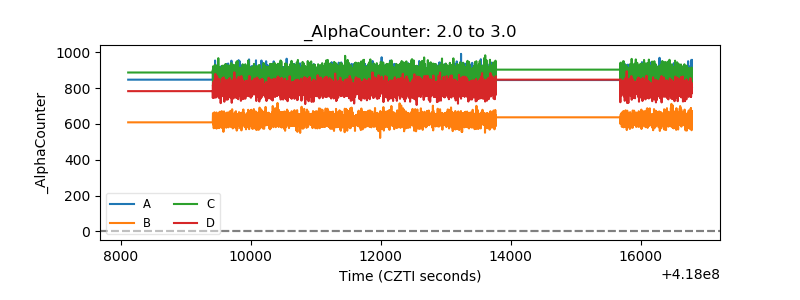 |
| _CPM_Rate | 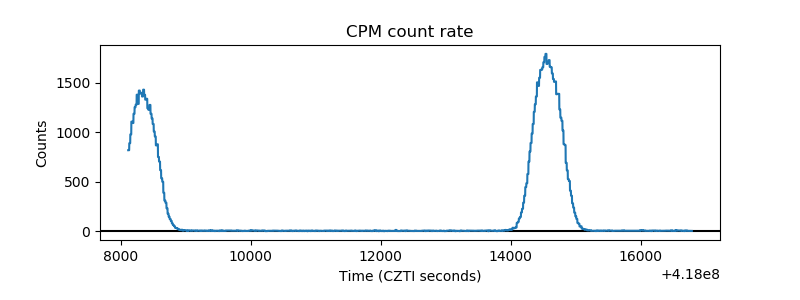 |
| CZT Counter | 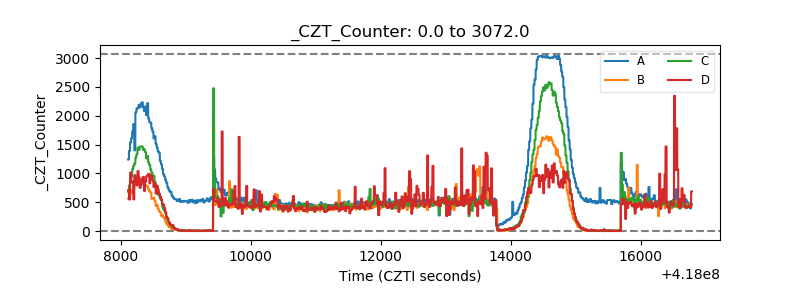 |
| +2.5 Volts monitor | 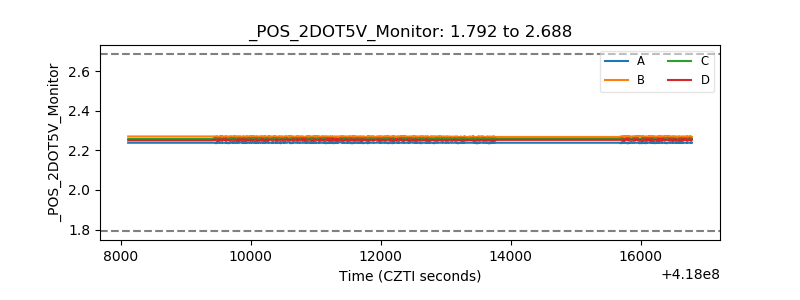 |
| +5 Volts monitor | 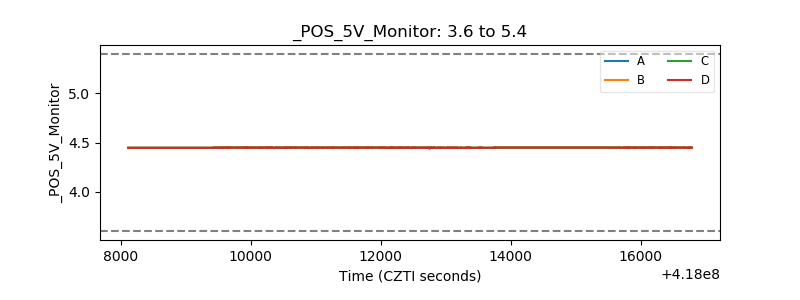 |
| _ROLL_ROT | 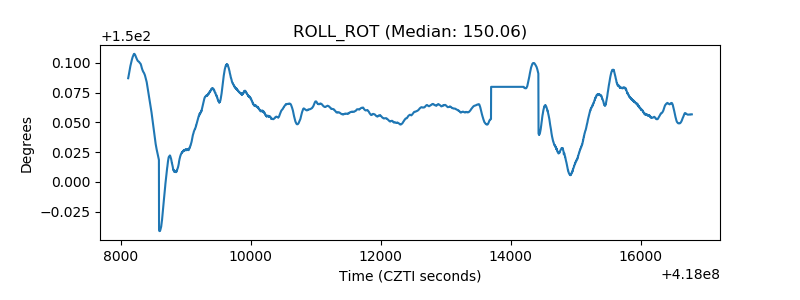 |
| _Roll_DEC | 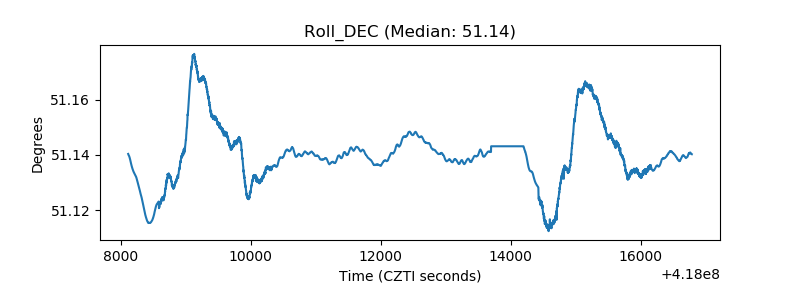 |
| _Roll_RA | 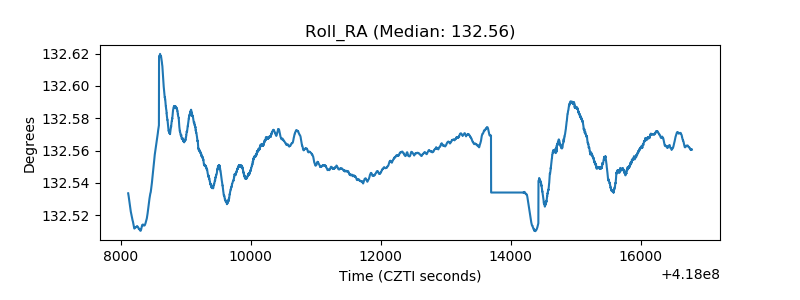 |
| Veto Counter | 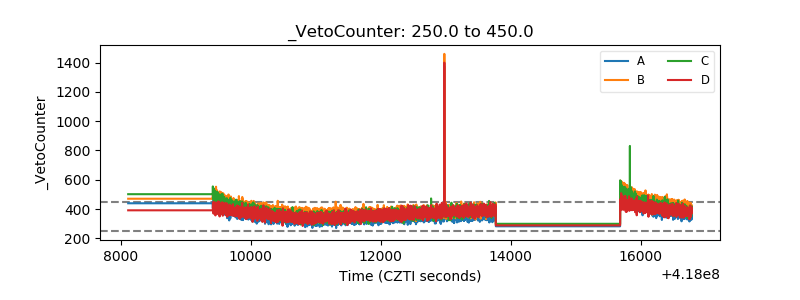 |