| Param | Original file | Final file |
|---|---|---|
| Filename | modeM0/AS1A12_054T02_9000005550_40591cztM0_level2.fits | modeM0/AS1A12_054T02_9000005550_40591cztM0_level2_quad_clean.evt |
| Size (bytes) | 324,250,560 | 85,654,080 |
| Size | 309.2 MB | 81.7 MB |
| Events in quadrant A | 2,778,702 | 611,492 |
| Events in quadrant B | 2,738,192 | 621,594 |
| Events in quadrant C | 2,457,834 | 587,464 |
| Events in quadrant D | 3,639,228 | 424,578 |
| Mode SS | |||
|---|---|---|---|
| Quadrant | BADHDUFLAG | Total packets | Discarded packets |
| A | 0 | 100 | 0 |
| B | 0 | 100 | 0 |
| C | 0 | 100 | 0 |
| D | 0 | 100 | 0 |
| Mode M0 | |||
|---|---|---|---|
| Quadrant | BADHDUFLAG | Total packets | Discarded packets |
| A | 0 | 11031 | 3 |
| B | 0 | 11116 | 2 |
| C | 0 | 10155 | 2 |
| D | 0 | 14204 | 2 |
| Mode M9 | |||
|---|---|---|---|
| Quadrant | BADHDUFLAG | Total packets | Discarded packets |
| A | 0 | 39 | 0 |
| B | 0 | 39 | 0 |
| C | 0 | 39 | 0 |
| D | 0 | 40 | 0 |
| Quadrant | Total seconds | Saturated seconds | Saturation percentage |
|---|---|---|---|
| A | 4974 | 8 | 0.160836% |
| B | 4974 | 93 | 1.869723% |
| C | 4974 | 9 | 0.180941% |
| D | 4974 | 1239 | 24.909530% |
Noise dominated data is calculated using 1-second bins in cleaned event files. If a bin has >2000 counts, and if more than 50% of those come from <1% of pixels, then it is considered to be noise-dominated and hence unusable.
| Quadrant | # 1 sec bins | Bins with >0 counts | Bins with >2000 counts | High rate bins dominated by noise | Noise dominated (total time) | Noise dominated (detector-on time) | Marked lightcurve |
|---|---|---|---|---|---|---|---|
| A | 7097 | 4975 | 4 | 4 | 0.06% | 0.08% | 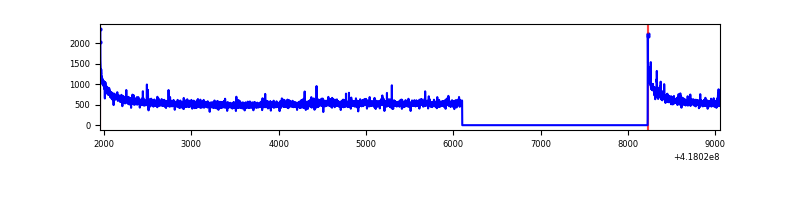 |
| B | 7097 | 4975 | 77 | 77 | 1.08% | 1.55% | 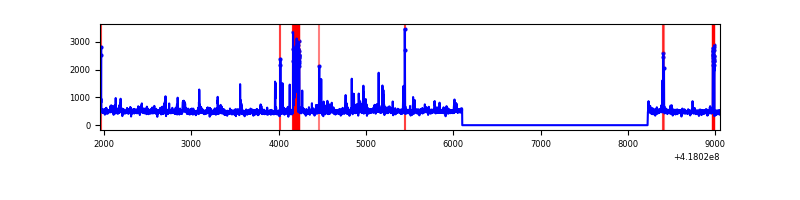 |
| C | 7097 | 4975 | 5 | 5 | 0.07% | 0.10% | 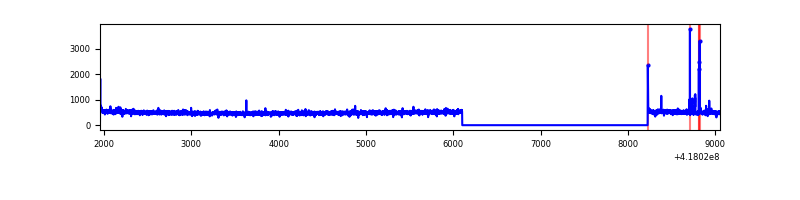 |
| D | 7096 | 4974 | 330 | 330 | 4.65% | 6.63% | 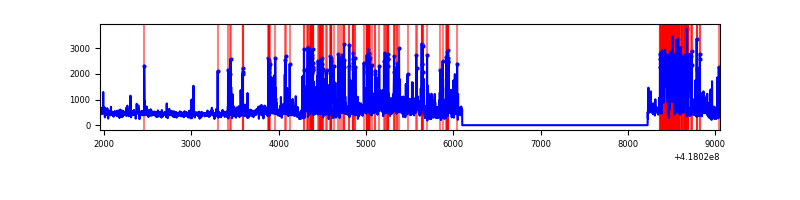 |
Top three noisy pixels from each quadrant. If the there are fewer than three noisy pixels in the level2.evt file, extra rows are filled as -1
| Pixel properties | Quadrant properties | ||||||
|---|---|---|---|---|---|---|---|
| Quadrant | DetID | PixID | Counts | Sigma | Mean | Median | Sigma |
| A | 10 | 83 | 481221 | 4066.2 | 580 | 570 | 118.2 |
| A | 2 | 79 | 25137 | 207.83 | 580 | 570 | 118.2 |
| A | 3 | 1 | 15781 | 128.68 | 580 | 570 | 118.2 |
| B | 5 | 255 | 245535 | 2238.11 | 571 | 557 | 109.5 |
| B | 0 | 190 | 145695 | 1325.97 | 571 | 557 | 109.5 |
| B | 3 | 112 | 76437 | 693.24 | 571 | 557 | 109.5 |
| C | 15 | 214 | 234341 | 1813.71 | 556 | 560 | 128.9 |
| C | 14 | 254 | 26929 | 204.57 | 556 | 560 | 128.9 |
| C | 0 | 10 | 13788 | 102.62 | 556 | 560 | 128.9 |
| D | 12 | 227 | 1154904 | 9594.04 | 486 | 473 | 120.3 |
| D | 12 | 191 | 212168 | 1759.32 | 486 | 473 | 120.3 |
| D | 13 | 249 | 86675 | 716.39 | 486 | 473 | 120.3 |
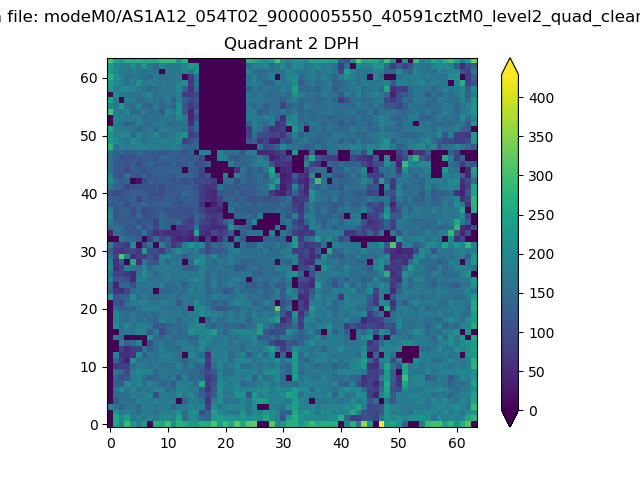
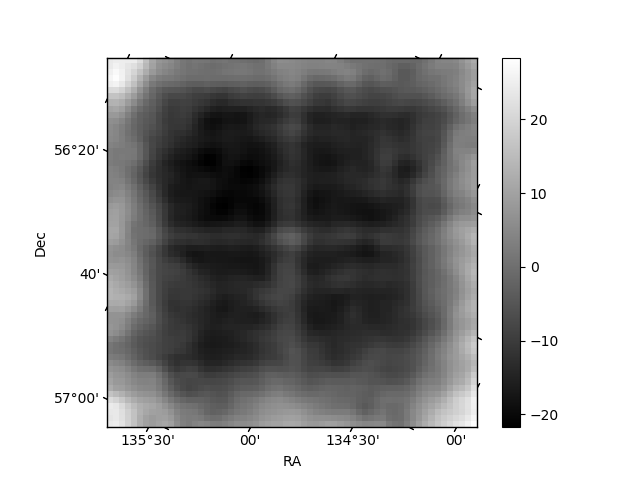
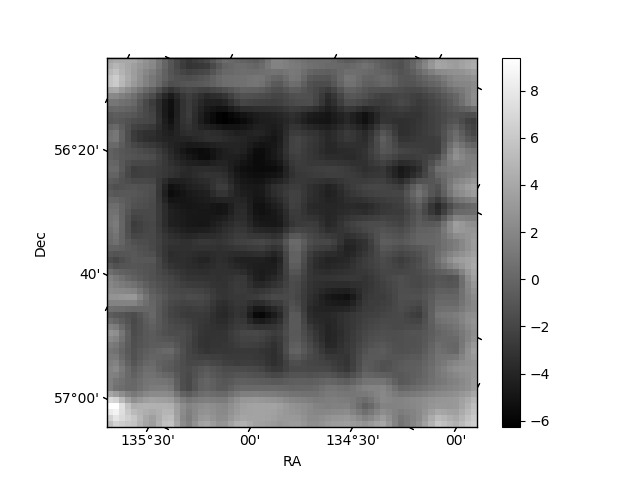
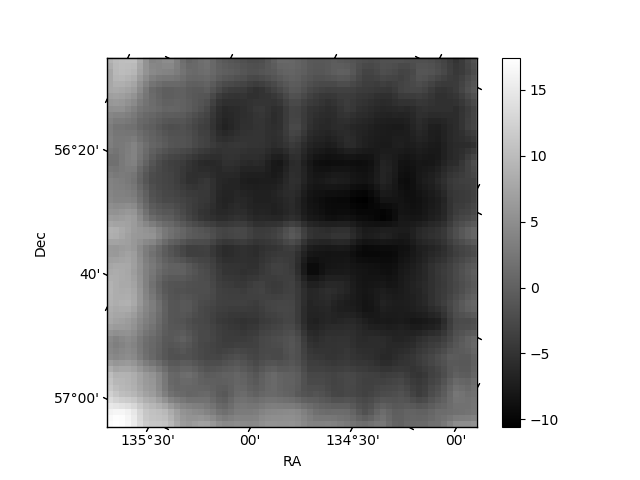
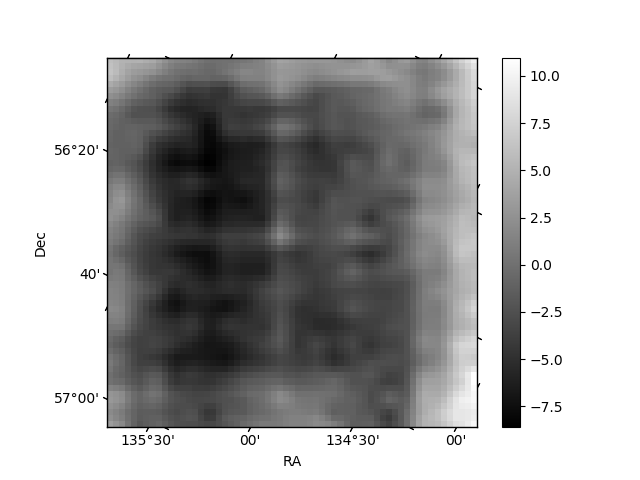
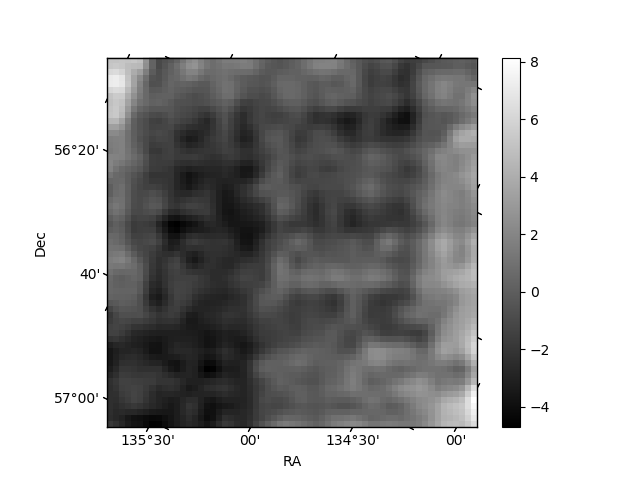
Histogram calculated using DETX and DETY for each event in the final _common_clean file
| Quadrant A | 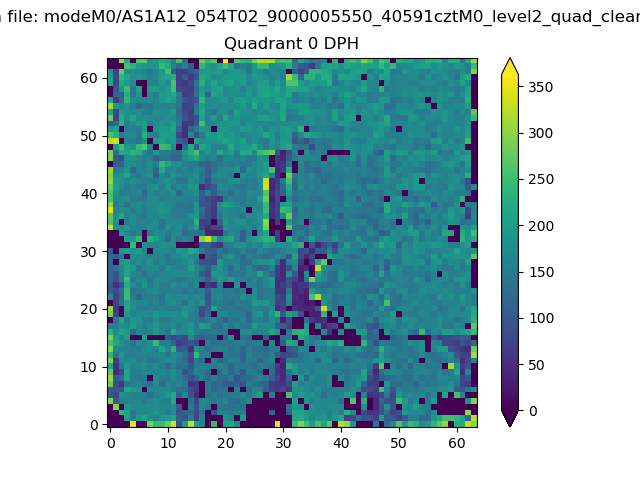 |
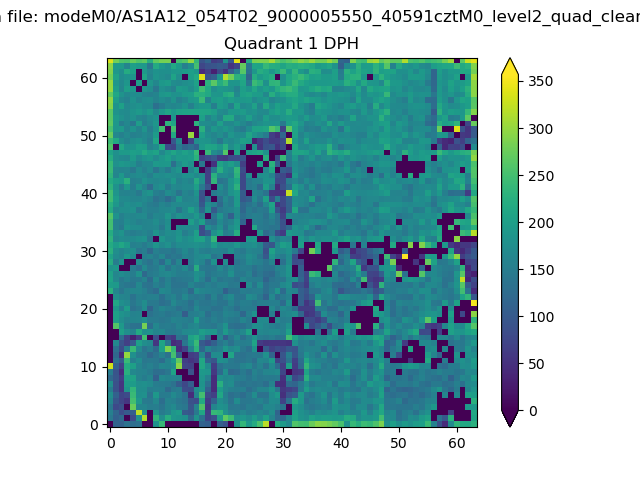 |
Quadrant B |
|---|---|---|---|
| Quadrant D | 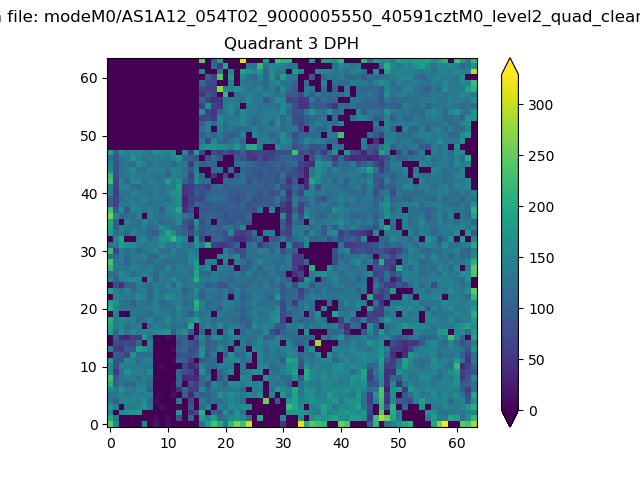 |
 |
Quadrant C |
| Plot type | Count rate plots | Images |
|---|---|---|
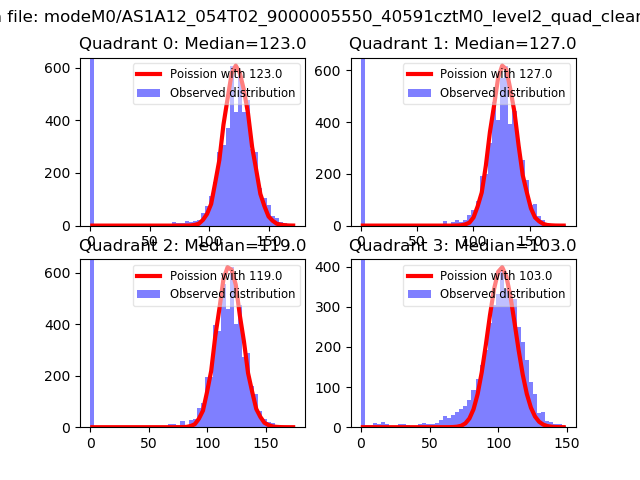
| Comparison with Poisson distribution Blue bars denote a histogram of data divided into 1 sec bins. Red curve is a Poisson curve with rate = median count rate of data. |
 |
 |
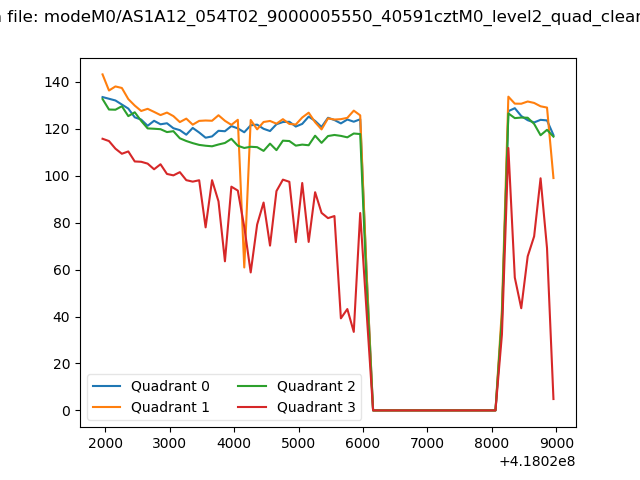
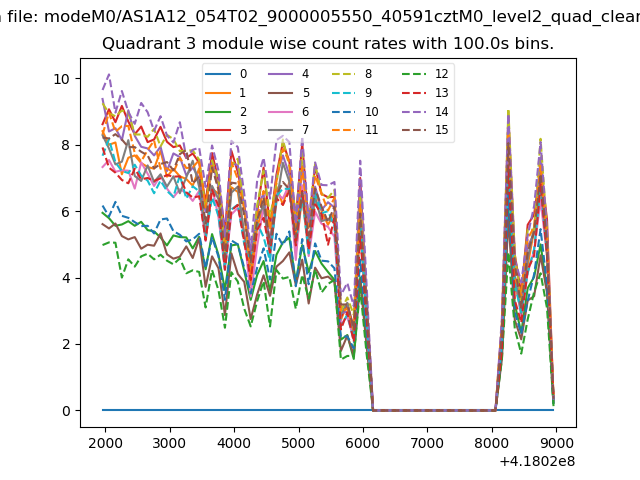
| Quadrant-wise count rates Data is divided into 100 sec bins |
 |
|
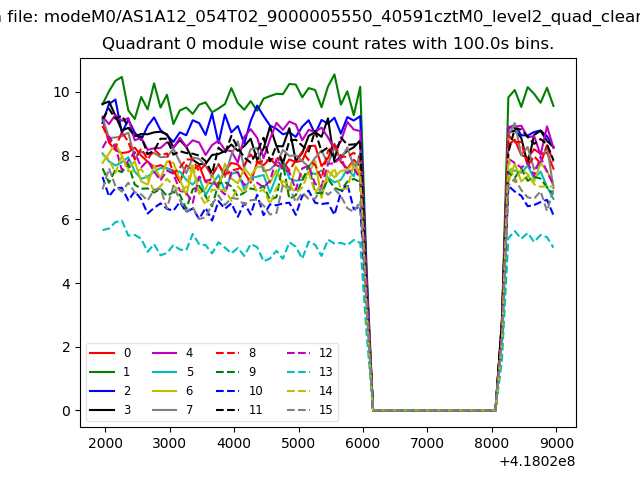
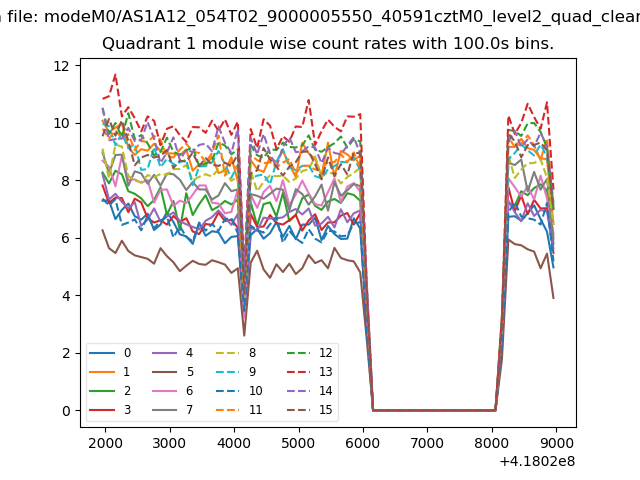
| Module-wise count rates for Quadrant A Data is divided into 100 sec bins |
 |
 |
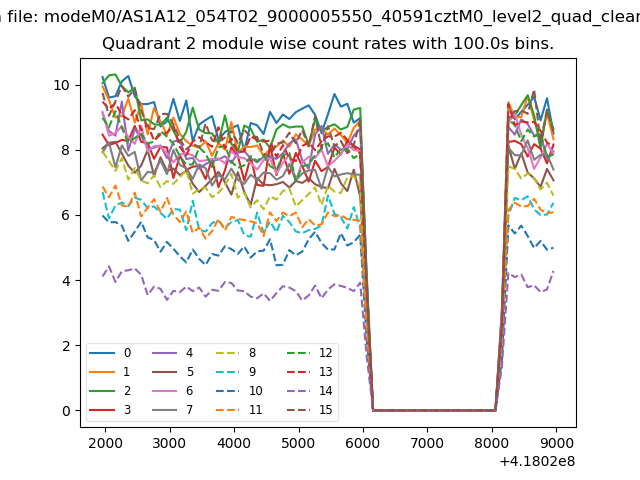
| Module-wise count rates for Quadrant B Data is divided into 100 sec bins |
 |
 |
| Module-wise count rates for Quadrant C Data is divided into 100 sec bins |
 |
 |
| Module-wise count rates for Quadrant D Data is divided into 100 sec bins |
 |
 |
| Parameter | Plot |
|---|---|
| CZT HV Monitor | 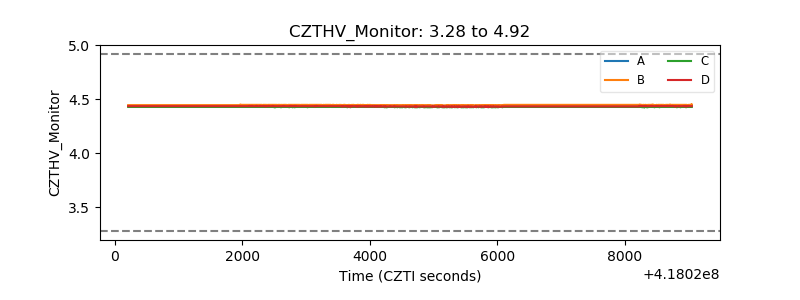 |
| D_VDD | 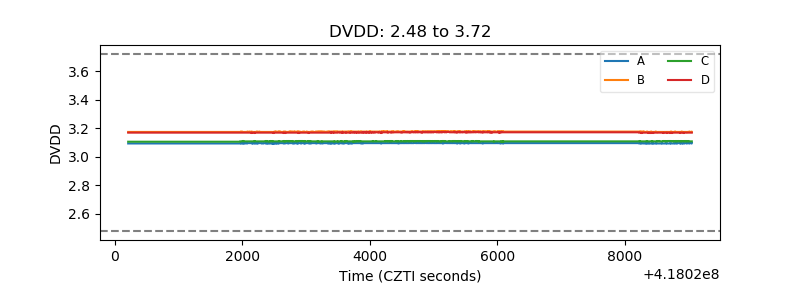 |
| Temperature 1 | 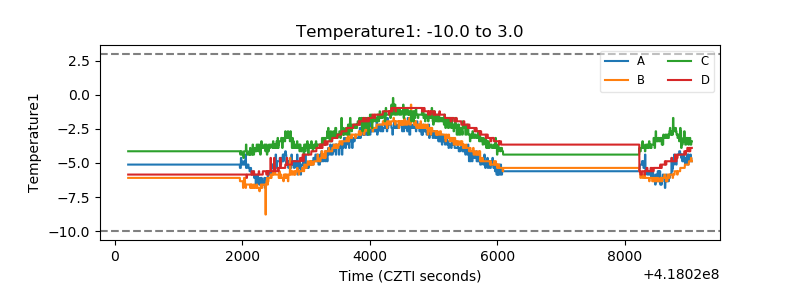 |
| Veto HV Monitor | 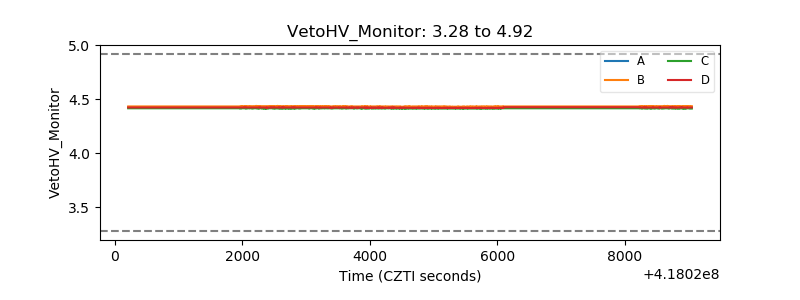 |
| Veto LLD |  |
| Alpha Counter | 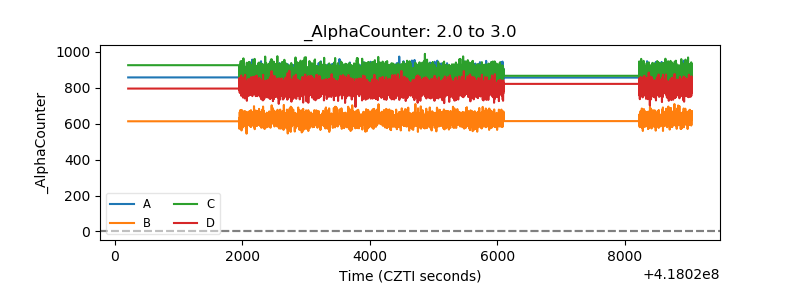 |
| _CPM_Rate | 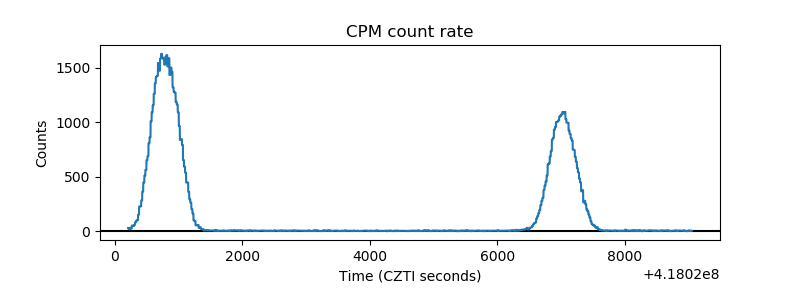 |
| CZT Counter | 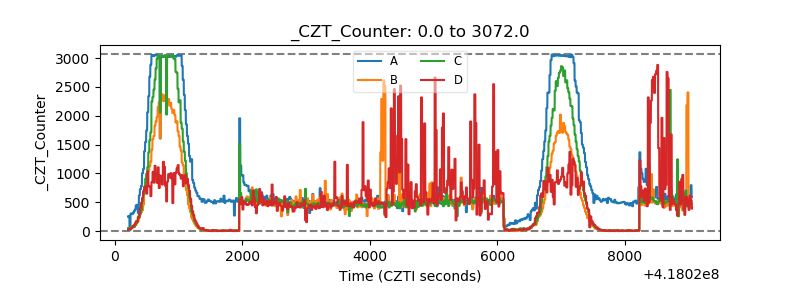 |
| +2.5 Volts monitor | 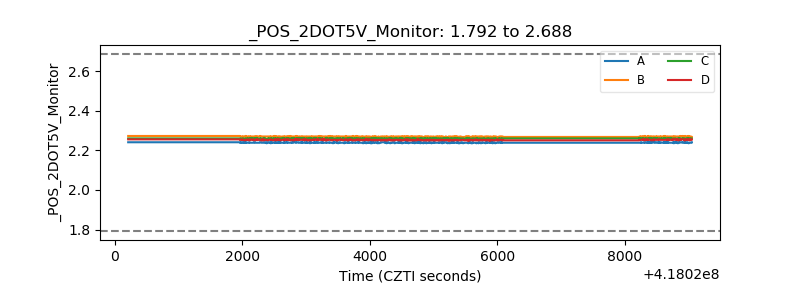 |
| +5 Volts monitor | 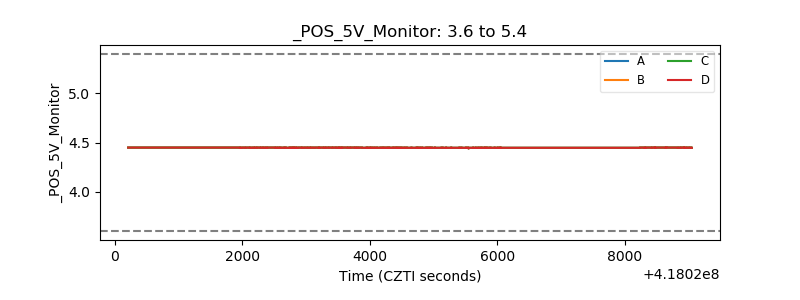 |
| _ROLL_ROT | 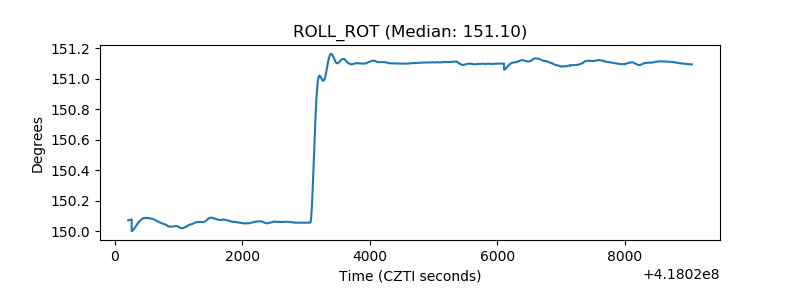 |
| _Roll_DEC | 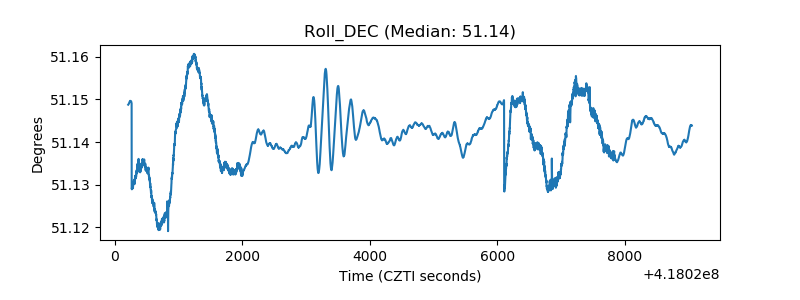 |
| _Roll_RA | 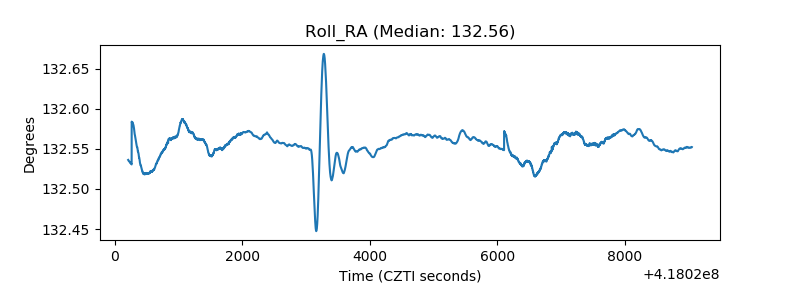 |
| Veto Counter | 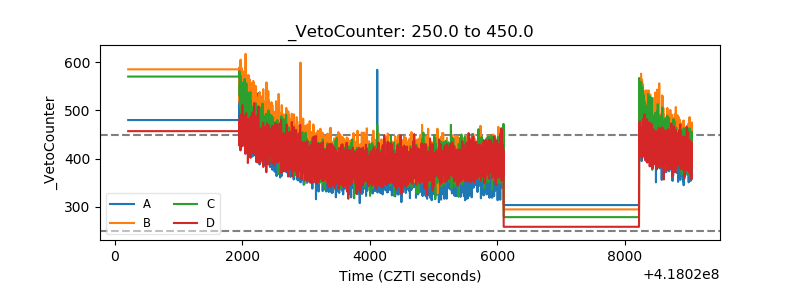 |