| Param | Original file | Final file |
|---|---|---|
| Filename | modeM0/AS1A12_054T02_9000005550_40592cztM0_level2.fits | modeM0/AS1A12_054T02_9000005550_40592cztM0_level2_quad_clean.evt |
| Size (bytes) | 344,191,680 | 80,357,760 |
| Size | 328.2 MB | 76.6 MB |
| Events in quadrant A | 2,749,455 | 595,117 |
| Events in quadrant B | 2,427,301 | 607,837 |
| Events in quadrant C | 2,541,454 | 570,458 |
| Events in quadrant D | 4,636,477 | 314,015 |
| Mode SS | |||
|---|---|---|---|
| Quadrant | BADHDUFLAG | Total packets | Discarded packets |
| A | 0 | 101 | 1 |
| B | 0 | 102 | 0 |
| C | 0 | 102 | 0 |
| D | 0 | 102 | 0 |
| Mode M0 | |||
|---|---|---|---|
| Quadrant | BADHDUFLAG | Total packets | Discarded packets |
| A | 0 | 10971 | 9 |
| B | 0 | 10263 | 11 |
| C | 0 | 10435 | 2 |
| D | 0 | 17234 | 35 |
| Mode M9 | |||
|---|---|---|---|
| Quadrant | BADHDUFLAG | Total packets | Discarded packets |
| A | 0 | 43 | 0 |
| B | 0 | 43 | 0 |
| C | 0 | 43 | 0 |
| D | 0 | 43 | 0 |
| Quadrant | Total seconds | Saturated seconds | Saturation percentage |
|---|---|---|---|
| A | 4934 | 9 | 0.182408% |
| B | 4931 | 33 | 0.669235% |
| C | 4937 | 23 | 0.465870% |
| D | 4933 | 2212 | 44.840868% |
Noise dominated data is calculated using 1-second bins in cleaned event files. If a bin has >2000 counts, and if more than 50% of those come from <1% of pixels, then it is considered to be noise-dominated and hence unusable.
| Quadrant | # 1 sec bins | Bins with >0 counts | Bins with >2000 counts | High rate bins dominated by noise | Noise dominated (total time) | Noise dominated (detector-on time) | Marked lightcurve |
|---|---|---|---|---|---|---|---|
| A | 9213 | 4938 | 3 | 3 | 0.03% | 0.06% | 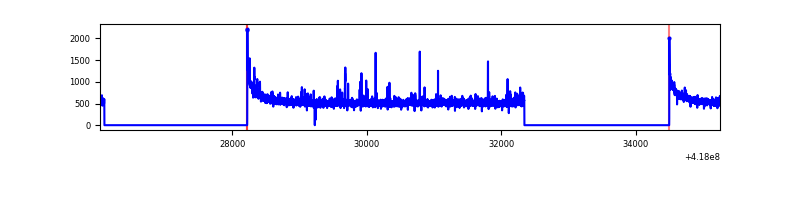 |
| B | 9213 | 4936 | 22 | 22 | 0.24% | 0.45% | 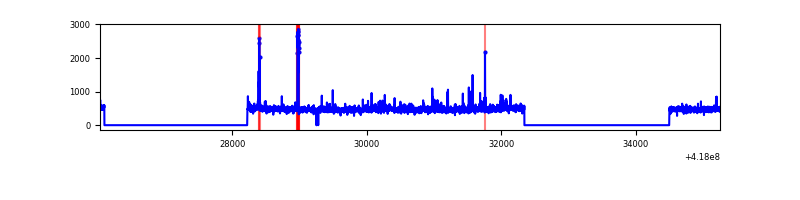 |
| C | 9213 | 4939 | 21 | 21 | 0.23% | 0.43% | 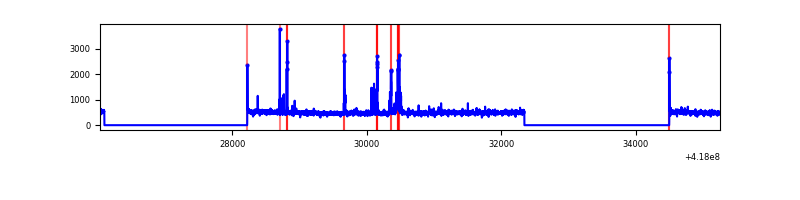 |
| D | 9212 | 4934 | 658 | 658 | 7.14% | 13.34% | 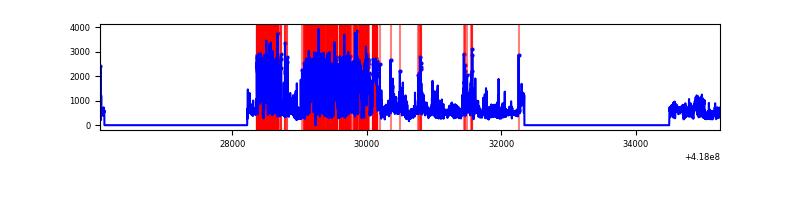 |
Top three noisy pixels from each quadrant. If the there are fewer than three noisy pixels in the level2.evt file, extra rows are filled as -1
| Pixel properties | Quadrant properties | ||||||
|---|---|---|---|---|---|---|---|
| Quadrant | DetID | PixID | Counts | Sigma | Mean | Median | Sigma |
| A | 10 | 83 | 470884 | 4066.61 | 568 | 559 | 115.7 |
| A | 2 | 79 | 44773 | 382.29 | 568 | 559 | 115.7 |
| A | 3 | 1 | 30337 | 257.47 | 568 | 559 | 115.7 |
| B | 0 | 190 | 113734 | 1067.27 | 559 | 545 | 106.1 |
| B | 3 | 112 | 60860 | 568.71 | 559 | 545 | 106.1 |
| B | 5 | 255 | 31926 | 295.89 | 559 | 545 | 106.1 |
| C | 15 | 214 | 233476 | 1830.53 | 545 | 549 | 127.2 |
| C | 14 | 254 | 158498 | 1241.29 | 545 | 549 | 127.2 |
| C | 0 | 10 | 15104 | 114.39 | 545 | 549 | 127.2 |
| D | 12 | 227 | 2439252 | 23308.9 | 423 | 410 | 104.6 |
| D | 12 | 191 | 278737 | 2660.07 | 423 | 410 | 104.6 |
| D | 2 | 249 | 66915 | 635.61 | 423 | 410 | 104.6 |
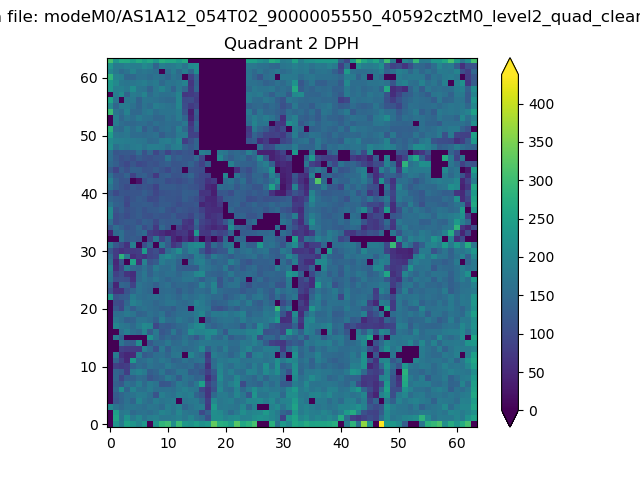
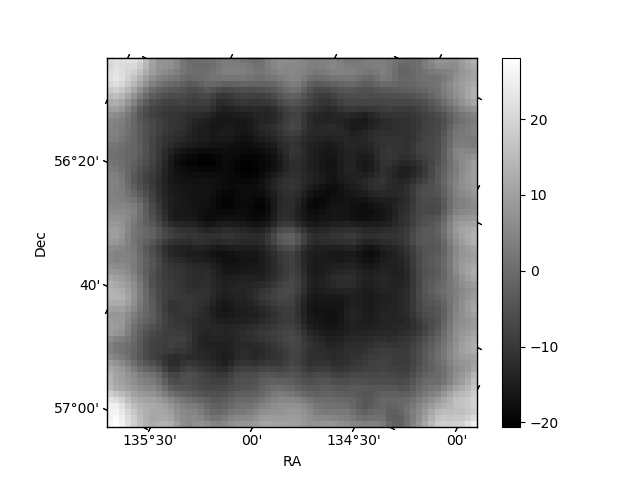
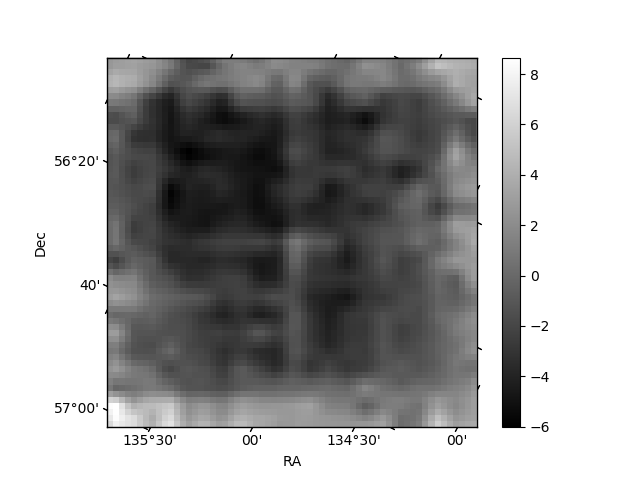
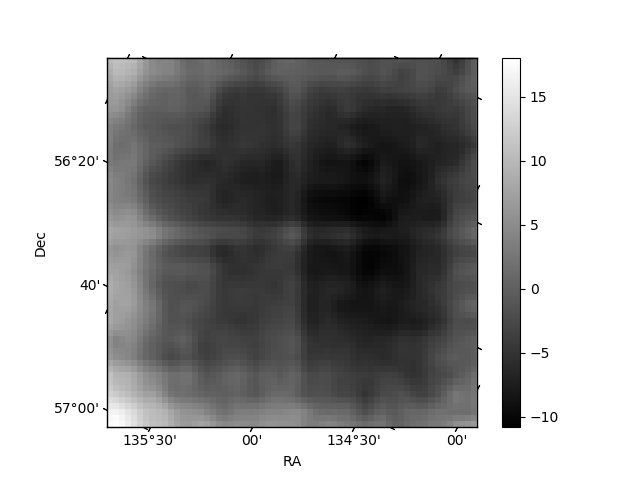
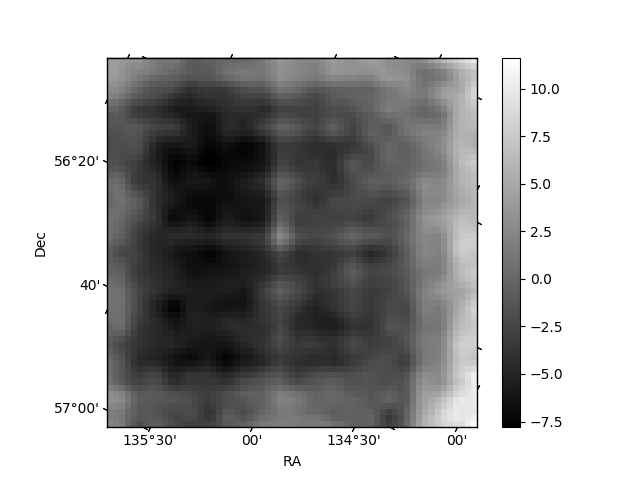
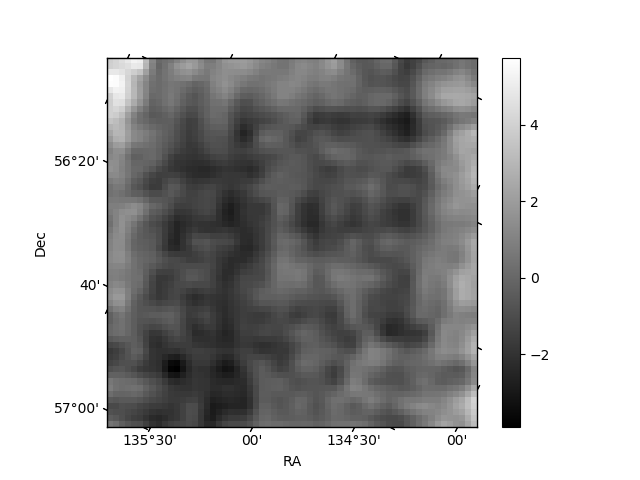
Histogram calculated using DETX and DETY for each event in the final _common_clean file
| Quadrant A | 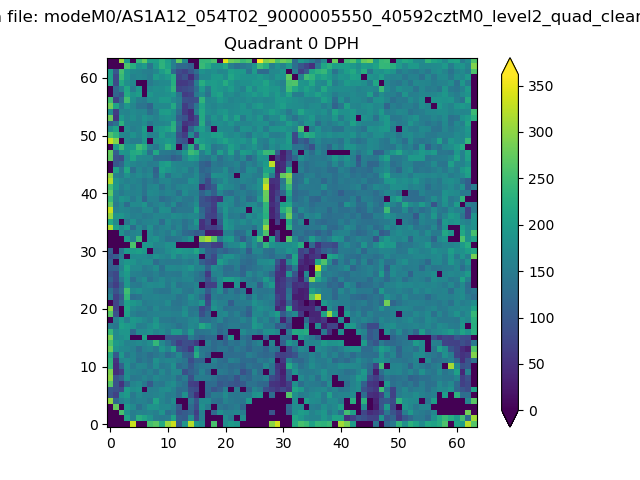 |
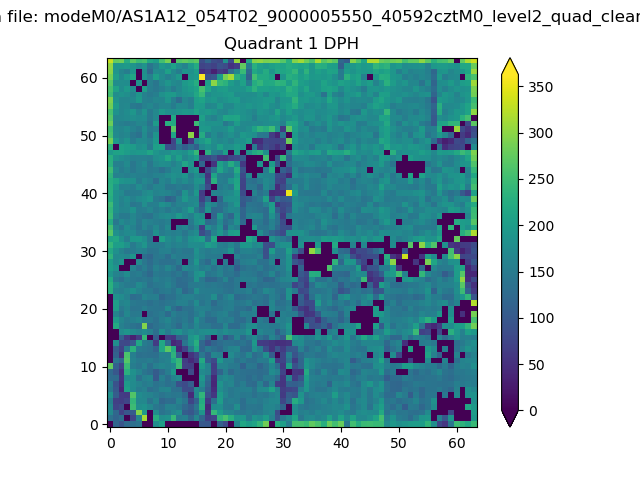 |
Quadrant B |
|---|---|---|---|
| Quadrant D | 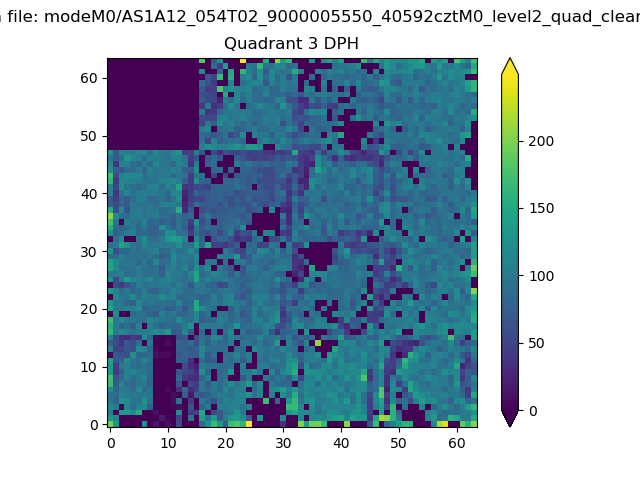 |
 |
Quadrant C |
| Plot type | Count rate plots | Images |
|---|---|---|
| Comparison with Poisson distribution Blue bars denote a histogram of data divided into 1 sec bins. Red curve is a Poisson curve with rate = median count rate of data. |
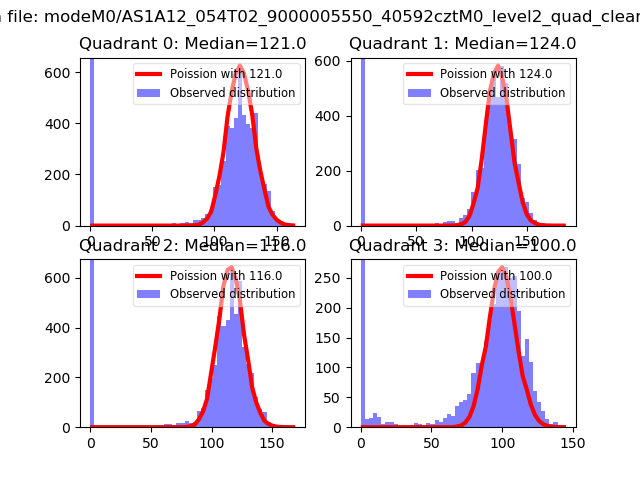 |
 |
| Quadrant-wise count rates Data is divided into 100 sec bins |
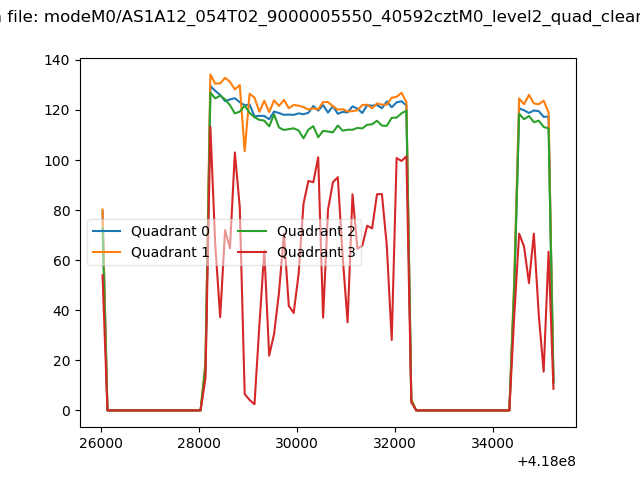 |
|
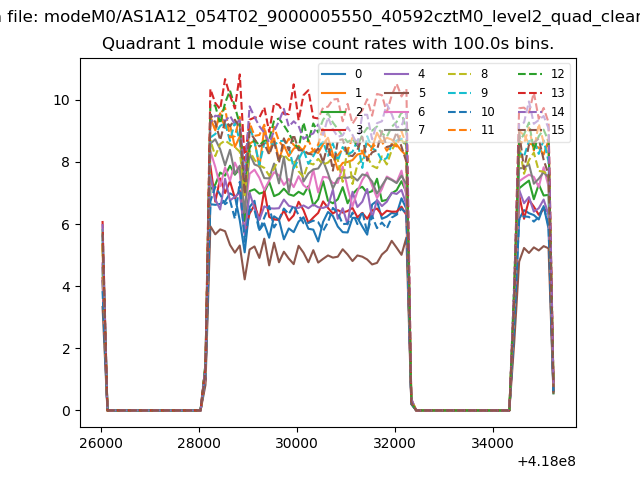
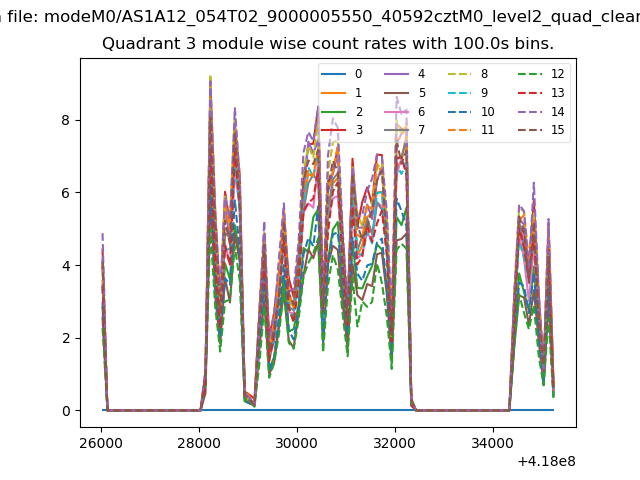
| Module-wise count rates for Quadrant A Data is divided into 100 sec bins |
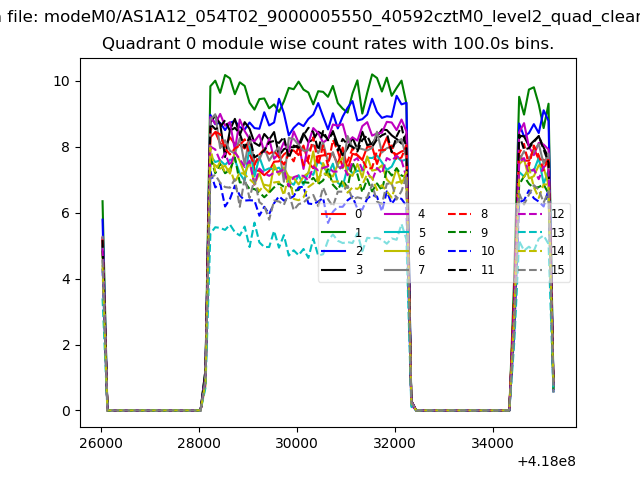 |
 |
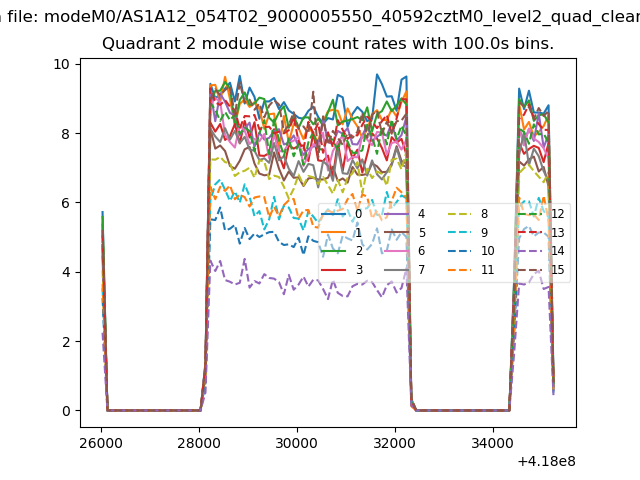
| Module-wise count rates for Quadrant B Data is divided into 100 sec bins |
 |
 |
| Module-wise count rates for Quadrant C Data is divided into 100 sec bins |
 |
 |
| Module-wise count rates for Quadrant D Data is divided into 100 sec bins |
 |
 |
| Parameter | Plot |
|---|---|
| CZT HV Monitor | 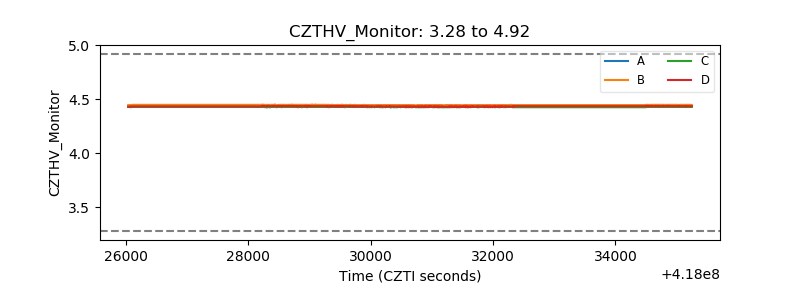 |
| D_VDD | 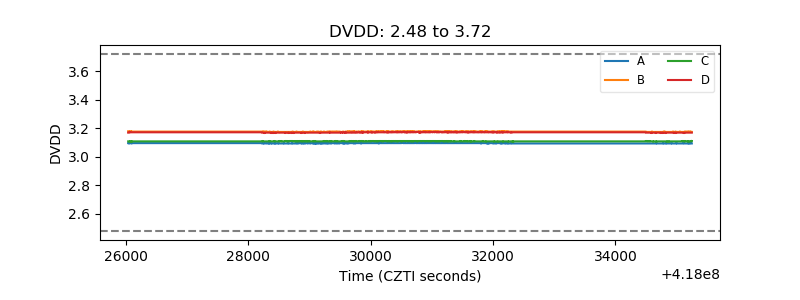 |
| Temperature 1 | 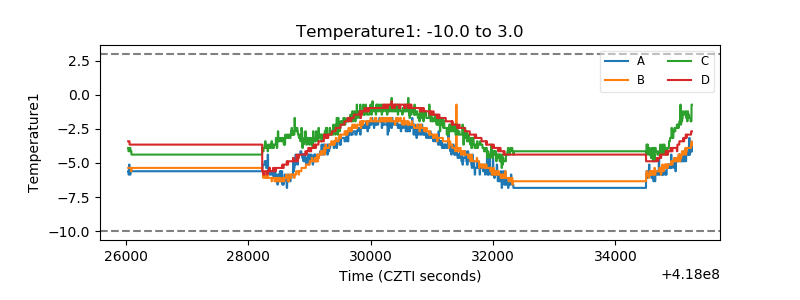 |
| Veto HV Monitor | 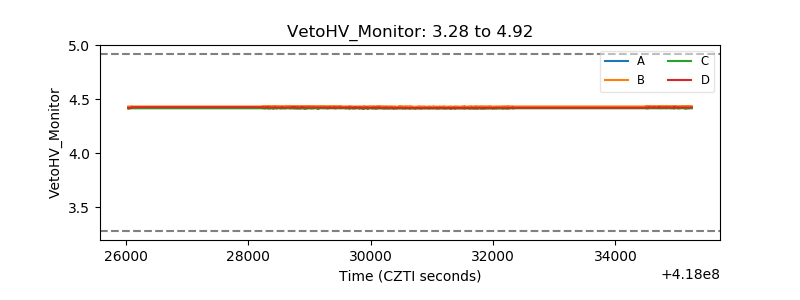 |
| Veto LLD | 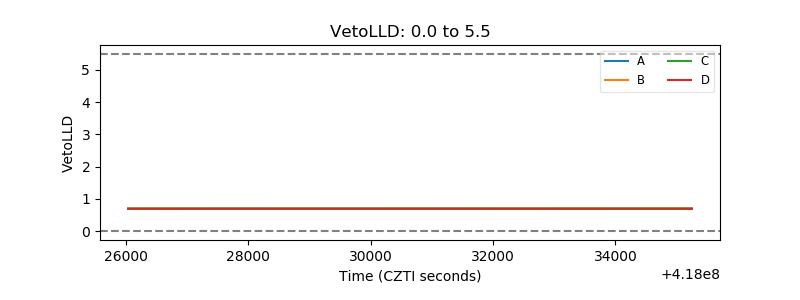 |
| Alpha Counter | 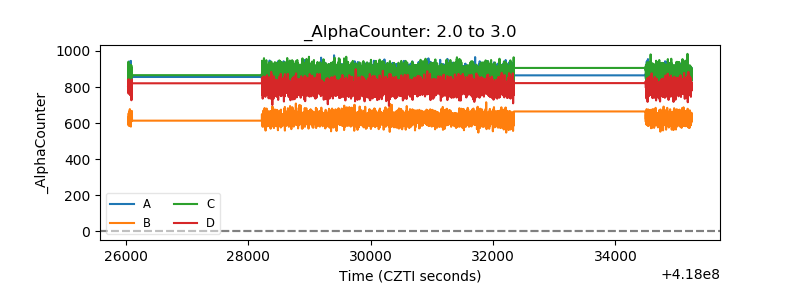 |
| _CPM_Rate | 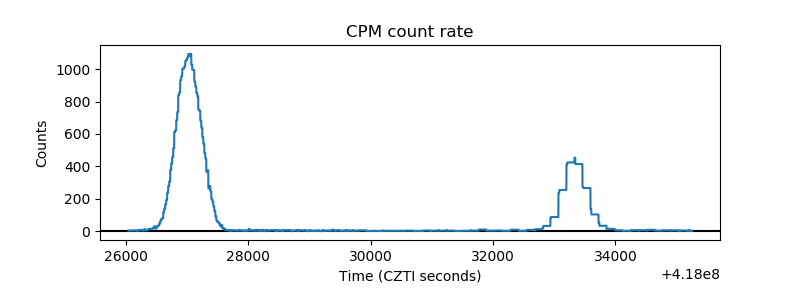 |
| CZT Counter | 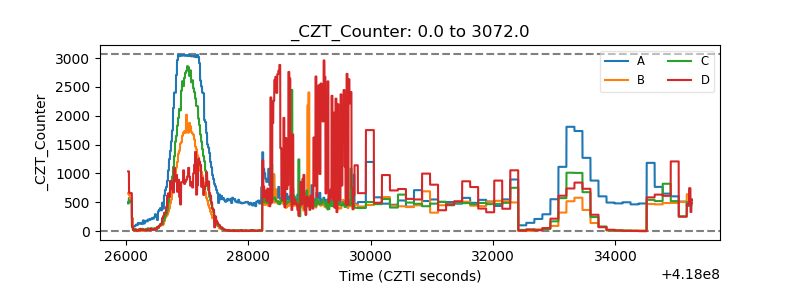 |
| +2.5 Volts monitor | 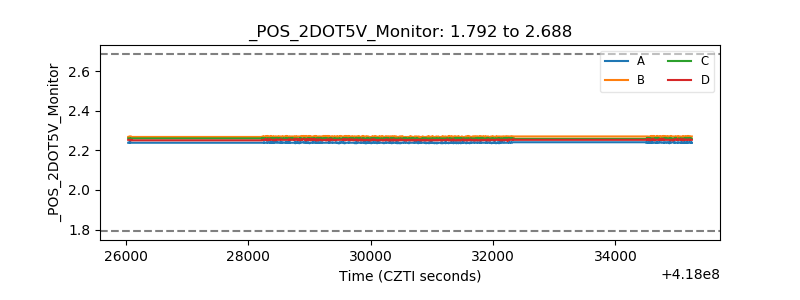 |
| +5 Volts monitor | 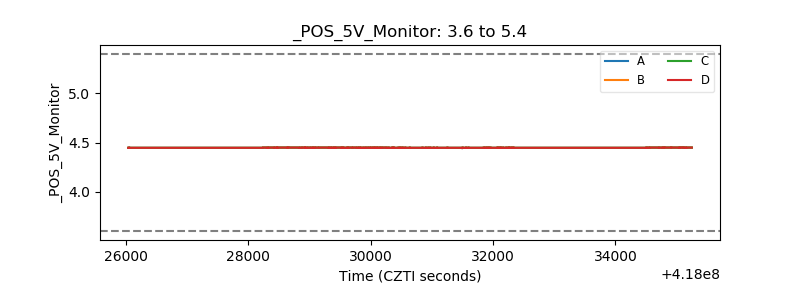 |
| _ROLL_ROT | 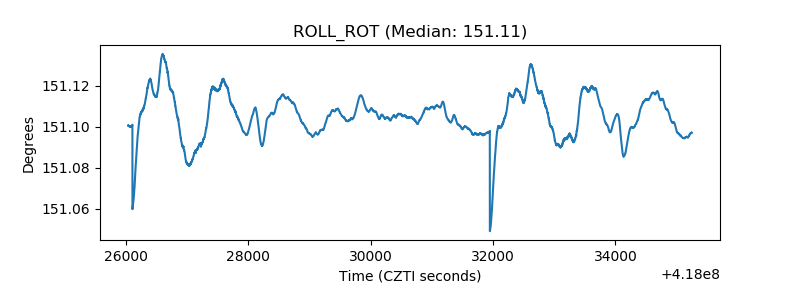 |
| _Roll_DEC | 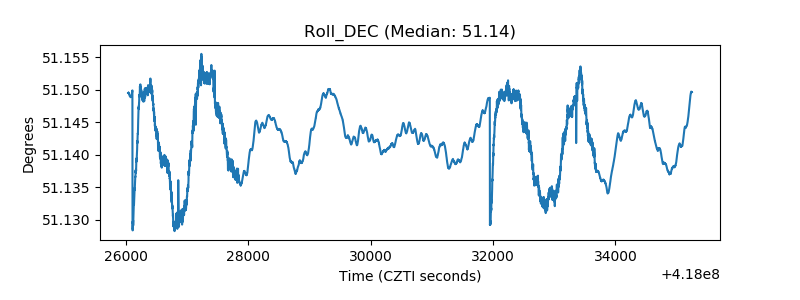 |
| _Roll_RA | 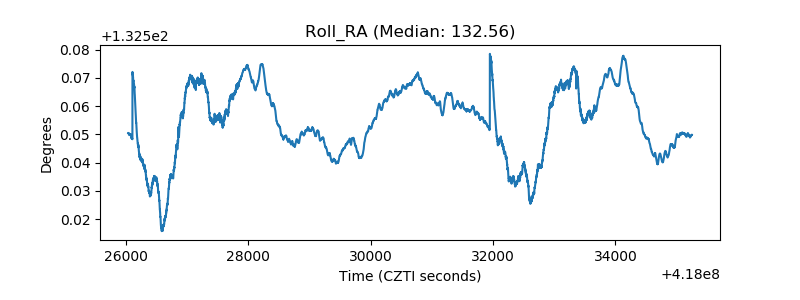 |
| Veto Counter | 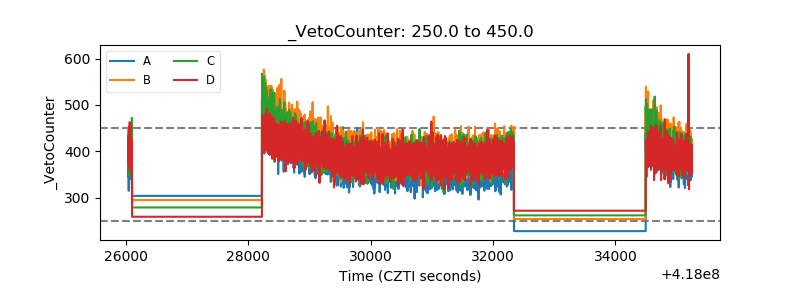 |