| Param | Original file | Final file |
|---|---|---|
| Filename | modeM0/AS1A12_054T02_9000005550_40593cztM0_level2.fits | modeM0/AS1A12_054T02_9000005550_40593cztM0_level2_quad_clean.evt |
| Size (bytes) | 323,758,080 | 79,211,520 |
| Size | 308.8 MB | 75.5 MB |
| Events in quadrant A | 2,695,202 | 578,672 |
| Events in quadrant B | 2,493,681 | 588,840 |
| Events in quadrant C | 2,899,150 | 537,637 |
| Events in quadrant D | 3,505,295 | 342,875 |
| Mode SS | |||
|---|---|---|---|
| Quadrant | BADHDUFLAG | Total packets | Discarded packets |
| A | 0 | 102 | 0 |
| B | 0 | 102 | 0 |
| C | 0 | 102 | 0 |
| D | 0 | 102 | 0 |
| Mode M0 | |||
|---|---|---|---|
| Quadrant | BADHDUFLAG | Total packets | Discarded packets |
| A | 0 | 10920 | 3 |
| B | 0 | 10613 | 2 |
| C | 0 | 11710 | 2 |
| D | 0 | 13950 | 2 |
| Mode M9 | |||
|---|---|---|---|
| Quadrant | BADHDUFLAG | Total packets | Discarded packets |
| A | 0 | 28 | 0 |
| B | 0 | 28 | 0 |
| C | 0 | 28 | 0 |
| D | 0 | 29 | 0 |
| Quadrant | Total seconds | Saturated seconds | Saturation percentage |
|---|---|---|---|
| A | 4994 | 10 | 0.200240% |
| B | 4994 | 34 | 0.680817% |
| C | 4994 | 166 | 3.323989% |
| D | 4994 | 1830 | 36.643973% |
Noise dominated data is calculated using 1-second bins in cleaned event files. If a bin has >2000 counts, and if more than 50% of those come from <1% of pixels, then it is considered to be noise-dominated and hence unusable.
| Quadrant | # 1 sec bins | Bins with >0 counts | Bins with >2000 counts | High rate bins dominated by noise | Noise dominated (total time) | Noise dominated (detector-on time) | Marked lightcurve |
|---|---|---|---|---|---|---|---|
| A | 7057 | 4995 | 2 | 2 | 0.03% | 0.04% | 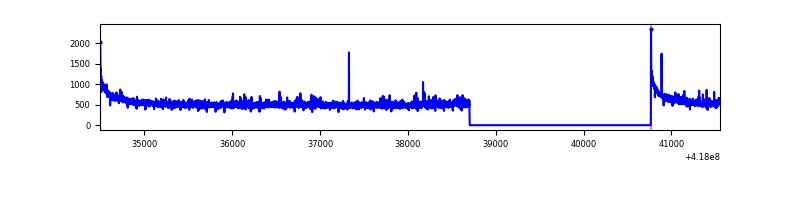 |
| B | 7057 | 4995 | 31 | 31 | 0.44% | 0.62% | 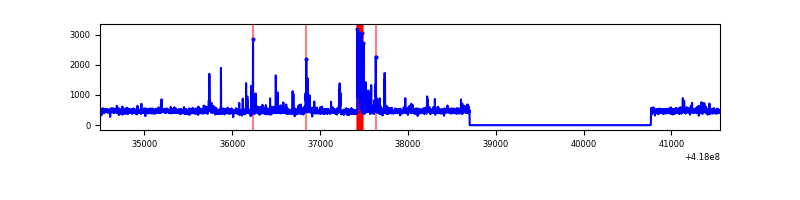 |
| C | 7057 | 4995 | 152 | 152 | 2.15% | 3.04% | 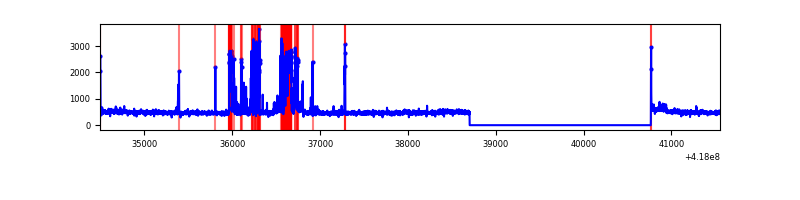 |
| D | 7057 | 4995 | 153 | 153 | 2.17% | 3.06% | 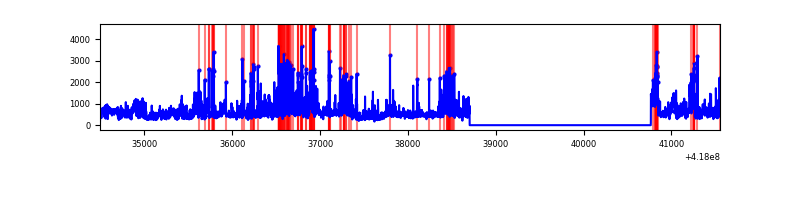 |
Top three noisy pixels from each quadrant. If the there are fewer than three noisy pixels in the level2.evt file, extra rows are filled as -1
| Pixel properties | Quadrant properties | ||||||
|---|---|---|---|---|---|---|---|
| Quadrant | DetID | PixID | Counts | Sigma | Mean | Median | Sigma |
| A | 10 | 83 | 474743 | 4140.98 | 555 | 544 | 114.5 |
| A | 3 | 1 | 35370 | 304.12 | 555 | 544 | 114.5 |
| A | 2 | 79 | 33940 | 291.63 | 555 | 544 | 114.5 |
| B | 5 | 255 | 122231 | 1159.71 | 549 | 536 | 104.9 |
| B | 3 | 112 | 72377 | 684.62 | 549 | 536 | 104.9 |
| B | 0 | 190 | 63462 | 599.66 | 549 | 536 | 104.9 |
| C | 14 | 254 | 582626 | 4752.67 | 525 | 527 | 122.5 |
| C | 15 | 214 | 231515 | 1885.95 | 525 | 527 | 122.5 |
| C | 0 | 10 | 17826 | 141.24 | 525 | 527 | 122.5 |
| D | 12 | 227 | 961074 | 8966.06 | 435 | 423 | 107.1 |
| D | 12 | 191 | 310072 | 2890.05 | 435 | 423 | 107.1 |
| D | 13 | 249 | 132885 | 1236.31 | 435 | 423 | 107.1 |
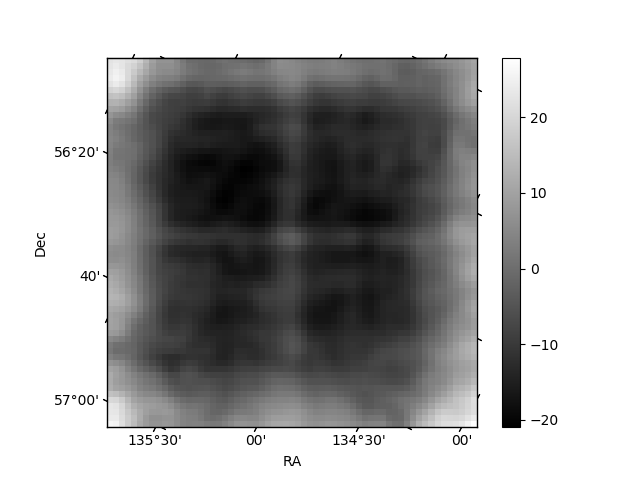
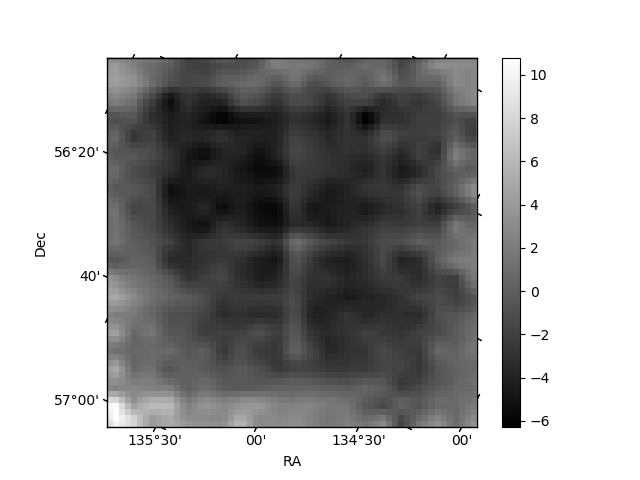
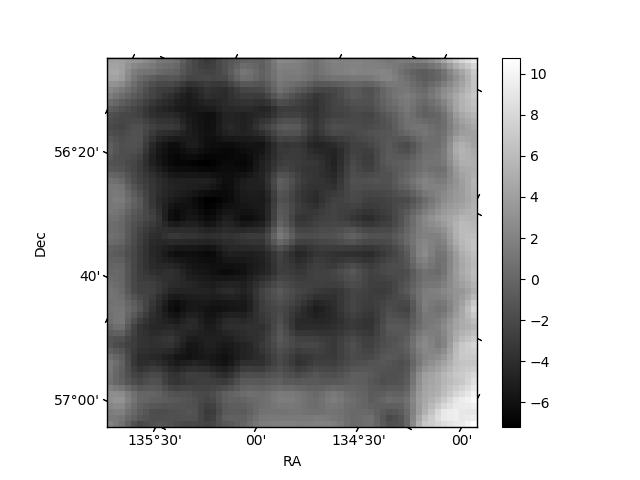
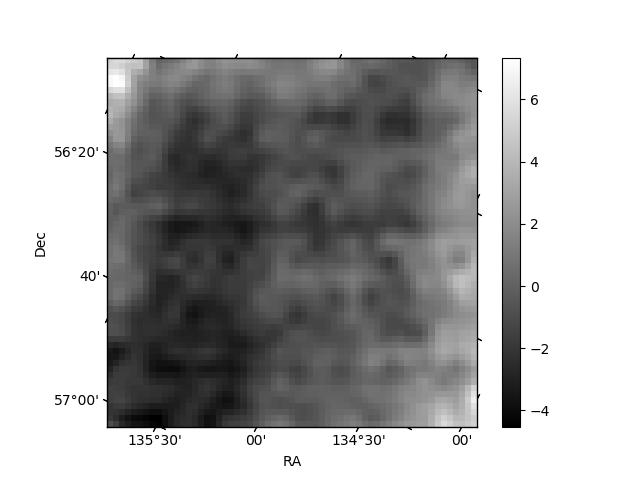
Histogram calculated using DETX and DETY for each event in the final _common_clean file
| Quadrant A | 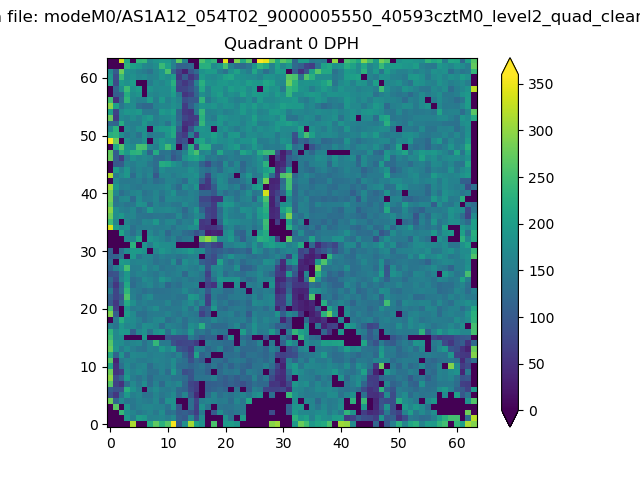 |
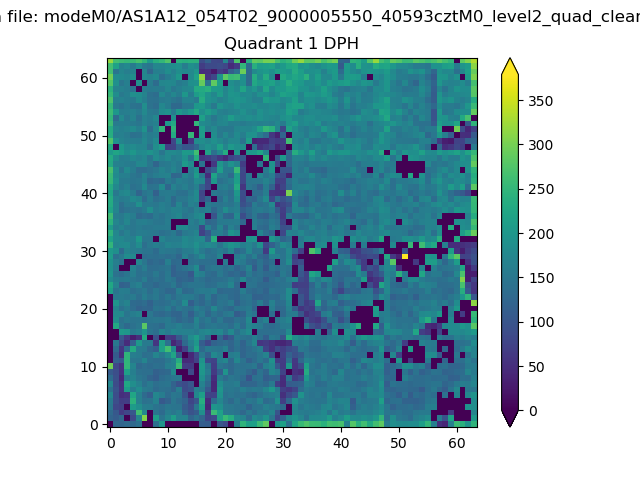 |
Quadrant B |
|---|---|---|---|
| Quadrant D | 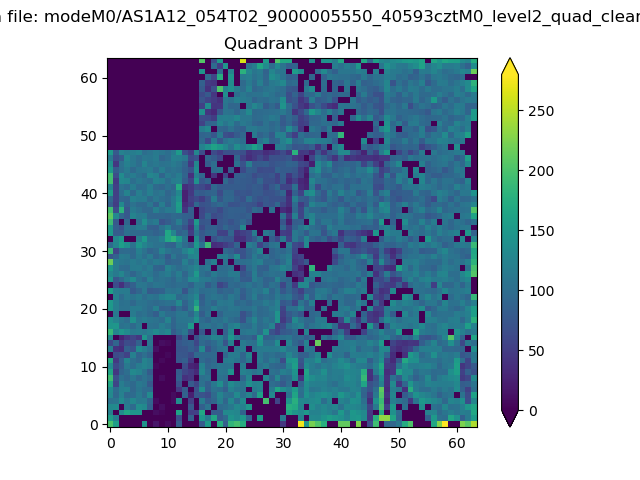 |
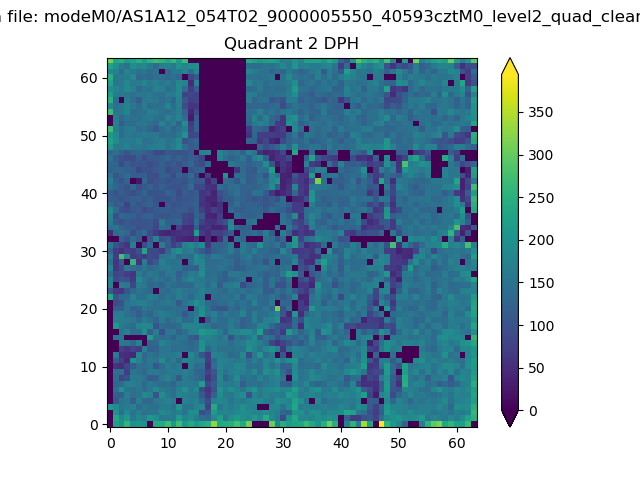 |
Quadrant C |
| Plot type | Count rate plots | Images |
|---|---|---|
| Comparison with Poisson distribution Blue bars denote a histogram of data divided into 1 sec bins. Red curve is a Poisson curve with rate = median count rate of data. |
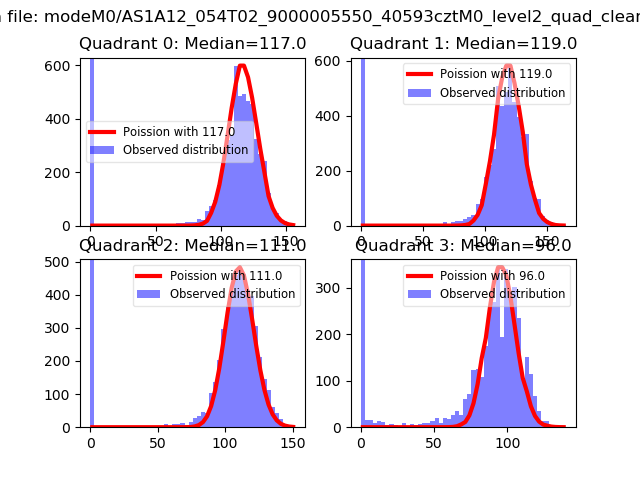 |
 |
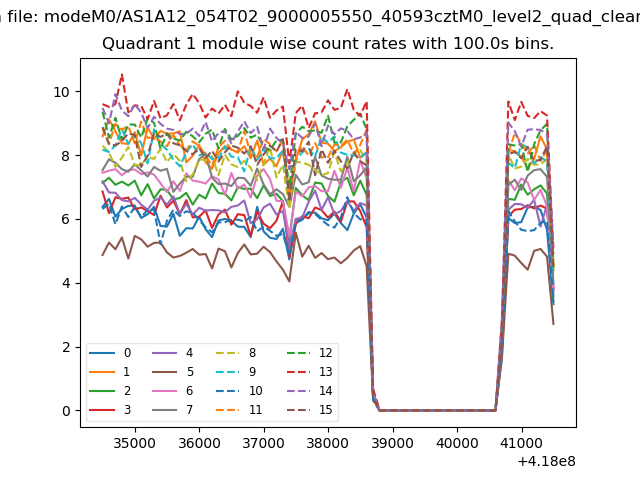
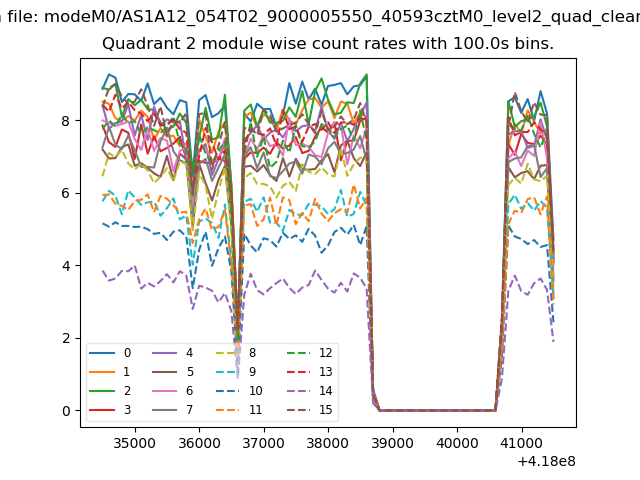
| Quadrant-wise count rates Data is divided into 100 sec bins |
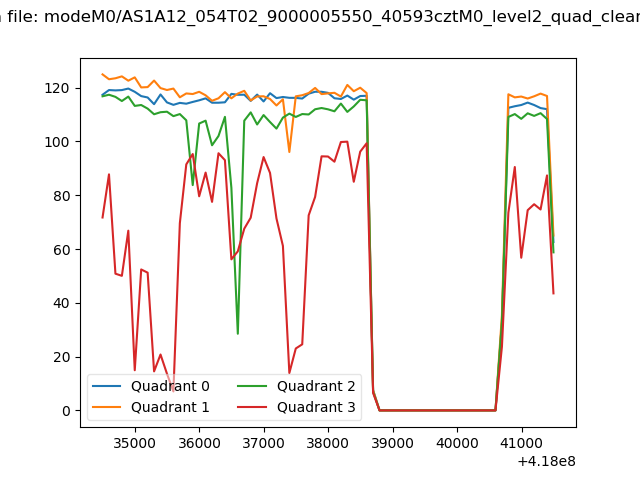 |
|
| Module-wise count rates for Quadrant A Data is divided into 100 sec bins |
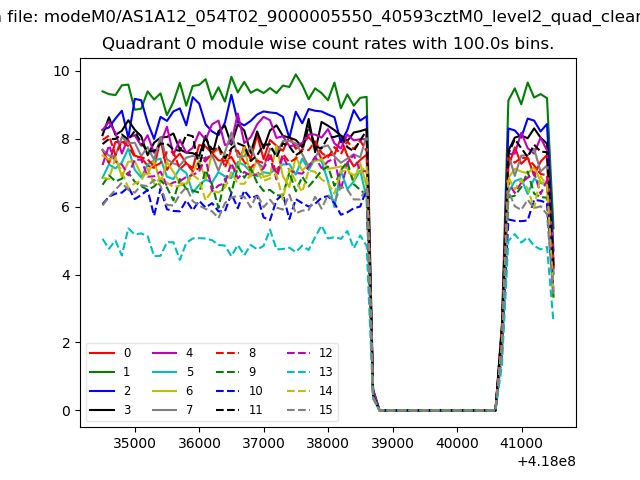 |
 |
| Module-wise count rates for Quadrant B Data is divided into 100 sec bins |
 |
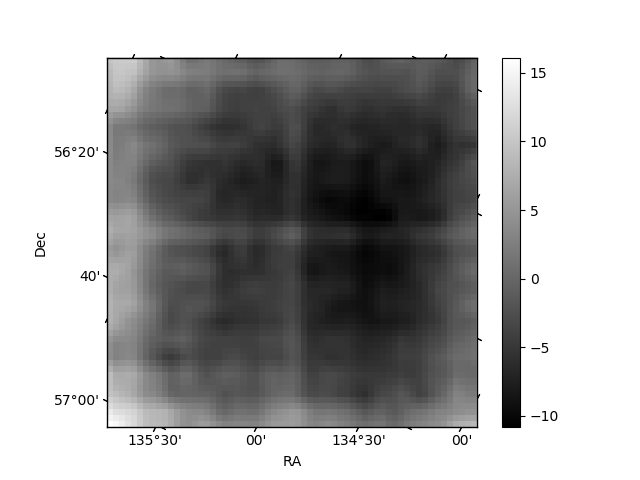 |
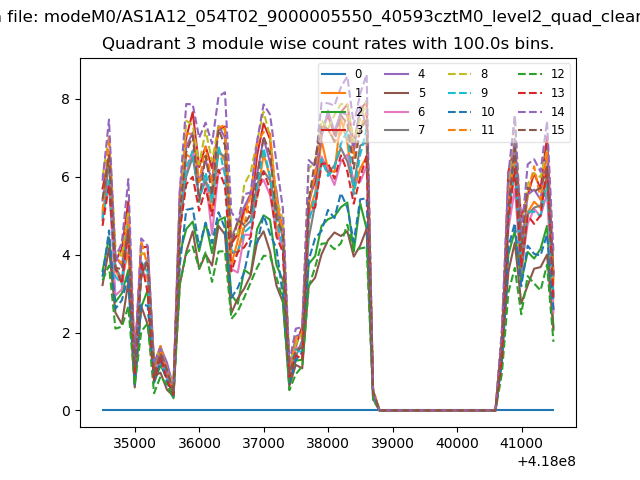
| Module-wise count rates for Quadrant C Data is divided into 100 sec bins |
 |
 |
| Module-wise count rates for Quadrant D Data is divided into 100 sec bins |
 |
 |
| Parameter | Plot |
|---|---|
| CZT HV Monitor | 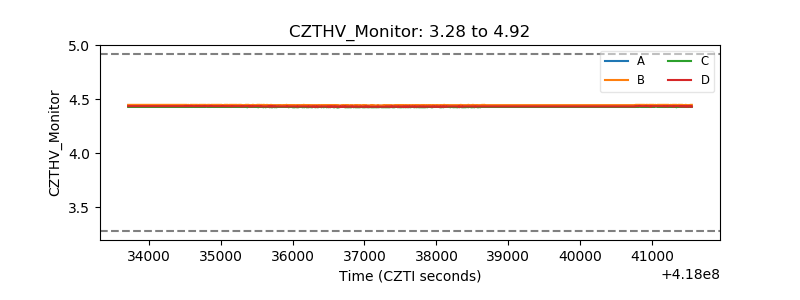 |
| D_VDD | 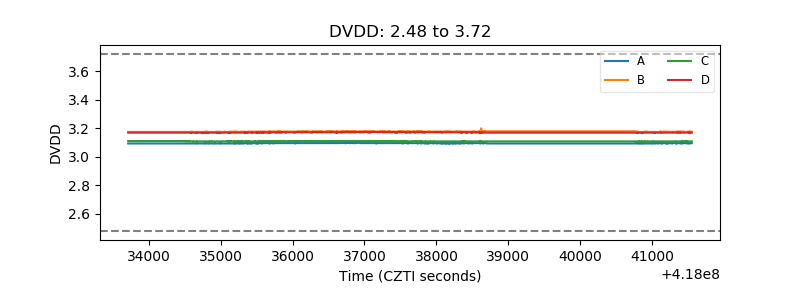 |
| Temperature 1 | 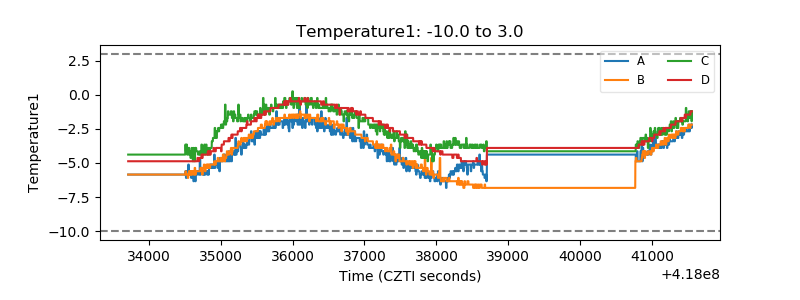 |
| Veto HV Monitor | 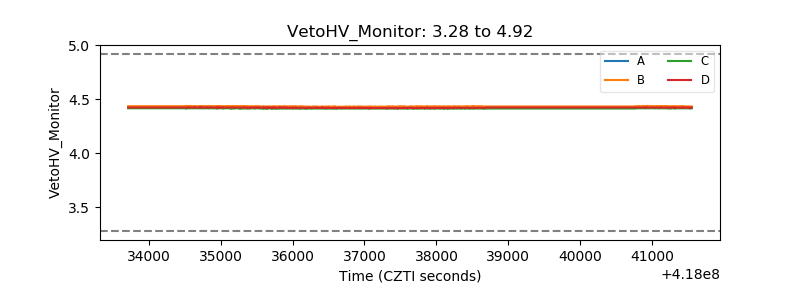 |
| Veto LLD | 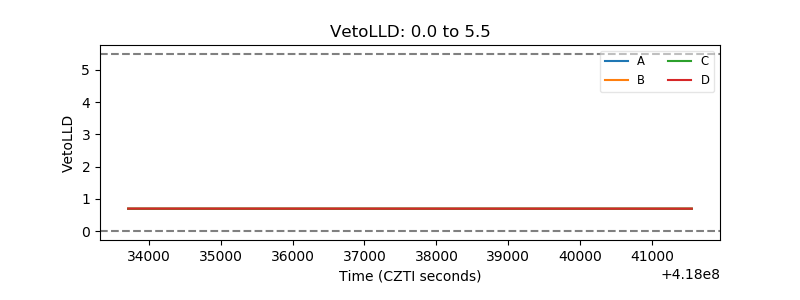 |
| Alpha Counter | 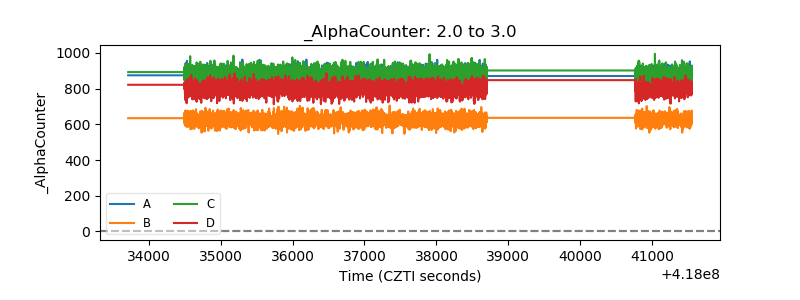 |
| _CPM_Rate | 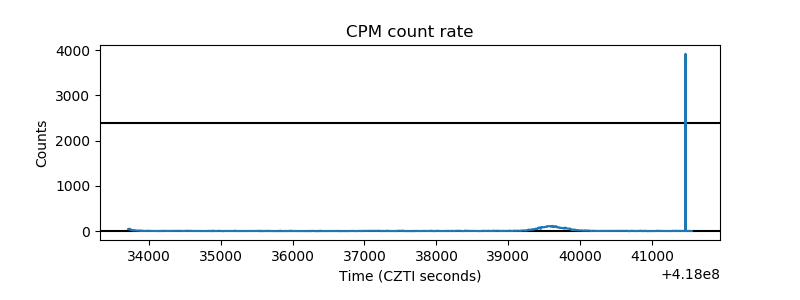 |
| CZT Counter | 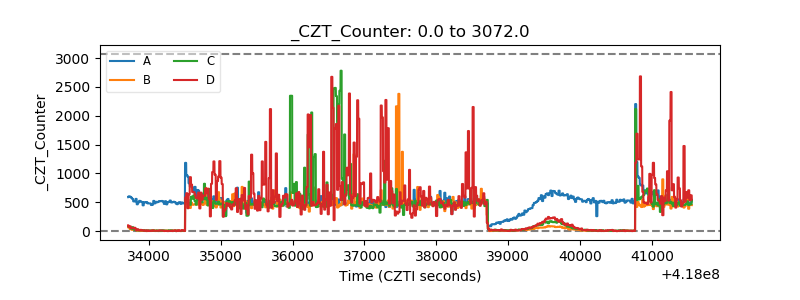 |
| +2.5 Volts monitor |  |
| +5 Volts monitor | 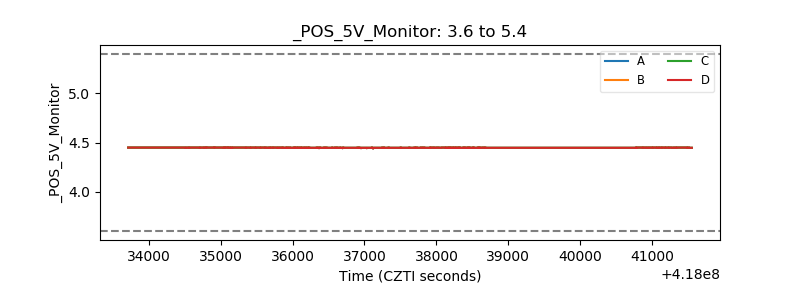 |
| _ROLL_ROT | 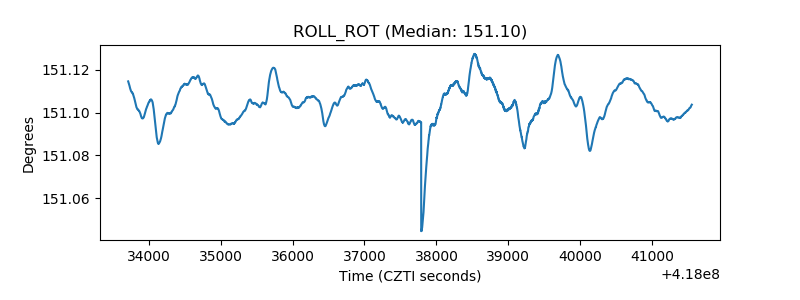 |
| _Roll_DEC | 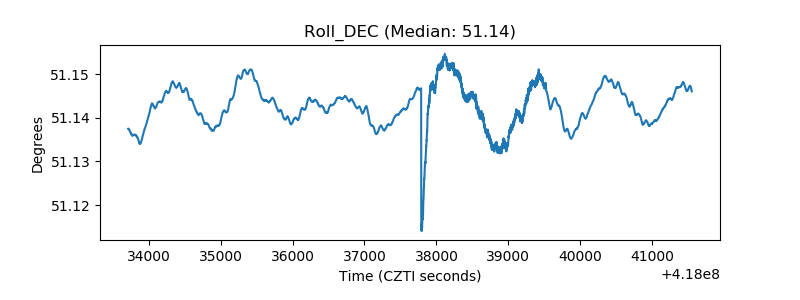 |
| _Roll_RA | 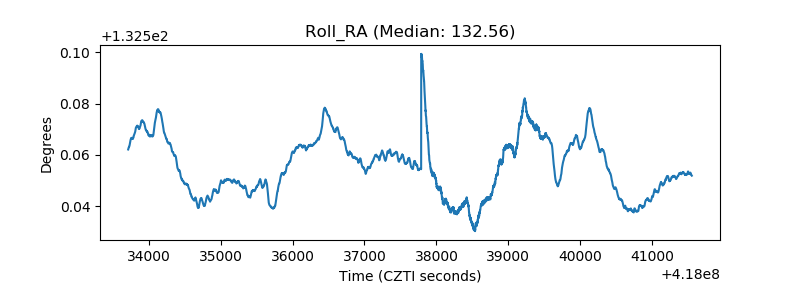 |
| Veto Counter | 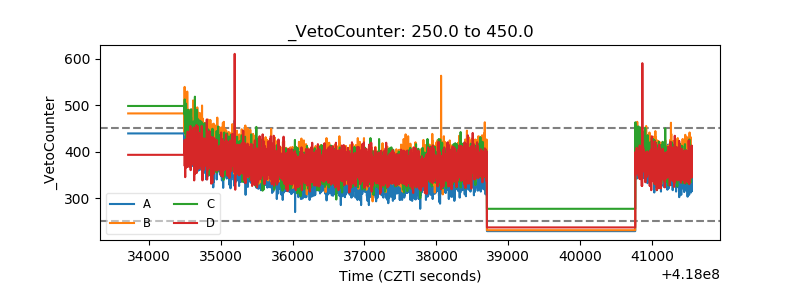 |