| Param | Original file | Final file |
|---|---|---|
| Filename | modeM0/AS1A12_054T02_9000005550_40594cztM0_level2.fits | modeM0/AS1A12_054T02_9000005550_40594cztM0_level2_quad_clean.evt |
| Size (bytes) | 384,413,760 | 86,103,360 |
| Size | 366.6 MB | 82.1 MB |
| Events in quadrant A | 3,101,226 | 616,038 |
| Events in quadrant B | 4,048,647 | 578,760 |
| Events in quadrant C | 2,738,914 | 593,780 |
| Events in quadrant D | 3,907,489 | 429,625 |
| Mode SS | |||
|---|---|---|---|
| Quadrant | BADHDUFLAG | Total packets | Discarded packets |
| A | 0 | 112 | 0 |
| B | 0 | 112 | 0 |
| C | 0 | 112 | 0 |
| D | 0 | 112 | 0 |
| Mode M0 | |||
|---|---|---|---|
| Quadrant | BADHDUFLAG | Total packets | Discarded packets |
| A | 0 | 12542 | 3 |
| B | 0 | 15707 | 2 |
| C | 0 | 11593 | 2 |
| D | 0 | 15371 | 2 |
| Mode M9 | |||
|---|---|---|---|
| Quadrant | BADHDUFLAG | Total packets | Discarded packets |
| A | 0 | 17 | 0 |
| B | 0 | 17 | 0 |
| C | 0 | 17 | 0 |
| D | 0 | 18 | 0 |
| Quadrant | Total seconds | Saturated seconds | Saturation percentage |
|---|---|---|---|
| A | 5551 | 58 | 1.044857% |
| B | 5551 | 545 | 9.818051% |
| C | 5551 | 9 | 0.162133% |
| D | 5551 | 1498 | 26.986129% |
Noise dominated data is calculated using 1-second bins in cleaned event files. If a bin has >2000 counts, and if more than 50% of those come from <1% of pixels, then it is considered to be noise-dominated and hence unusable.
| Quadrant | # 1 sec bins | Bins with >0 counts | Bins with >2000 counts | High rate bins dominated by noise | Noise dominated (total time) | Noise dominated (detector-on time) | Marked lightcurve |
|---|---|---|---|---|---|---|---|
| A | 7344 | 5551 | 45 | 45 | 0.61% | 0.81% | 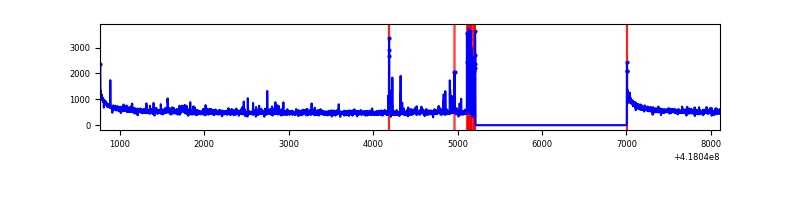 |
| B | 7344 | 5552 | 483 | 483 | 6.58% | 8.70% | 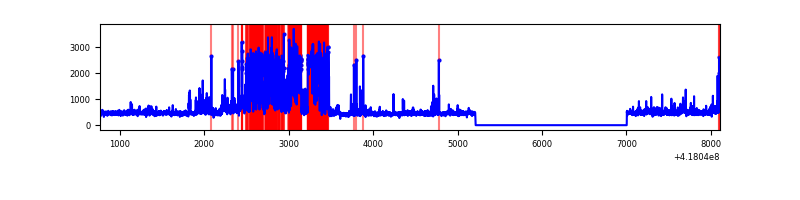 |
| C | 7344 | 5552 | 6 | 6 | 0.08% | 0.11% | 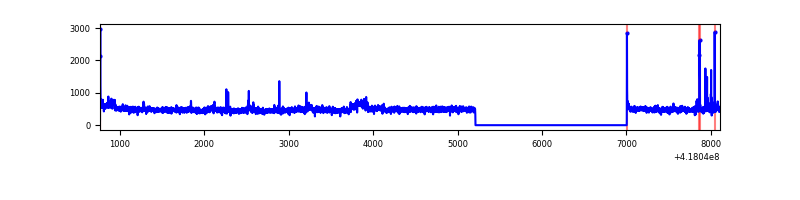 |
| D | 7344 | 5552 | 157 | 157 | 2.14% | 2.83% | 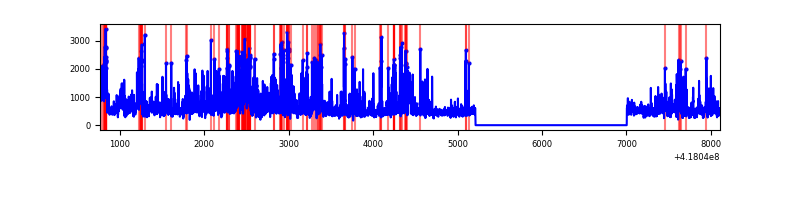 |
Top three noisy pixels from each quadrant. If the there are fewer than three noisy pixels in the level2.evt file, extra rows are filled as -1
| Pixel properties | Quadrant properties | ||||||
|---|---|---|---|---|---|---|---|
| Quadrant | DetID | PixID | Counts | Sigma | Mean | Median | Sigma |
| A | 10 | 83 | 528404 | 4264.2 | 601 | 589 | 123.8 |
| A | 2 | 79 | 194219 | 1564.33 | 601 | 589 | 123.8 |
| A | 3 | 1 | 36537 | 290.42 | 601 | 589 | 123.8 |
| B | 5 | 255 | 1431825 | 13000.33 | 574 | 560 | 110.1 |
| B | 0 | 190 | 177236 | 1604.77 | 574 | 560 | 110.1 |
| B | 3 | 112 | 67458 | 607.64 | 574 | 560 | 110.1 |
| C | 15 | 214 | 246956 | 1809.98 | 585 | 587 | 136.1 |
| C | 14 | 254 | 169758 | 1242.83 | 585 | 587 | 136.1 |
| C | 0 | 10 | 19351 | 137.85 | 585 | 587 | 136.1 |
| D | 12 | 227 | 515497 | 4015.38 | 514 | 499 | 128.3 |
| D | 2 | 249 | 396092 | 3084.4 | 514 | 499 | 128.3 |
| D | 2 | 250 | 297030 | 2312.02 | 514 | 499 | 128.3 |
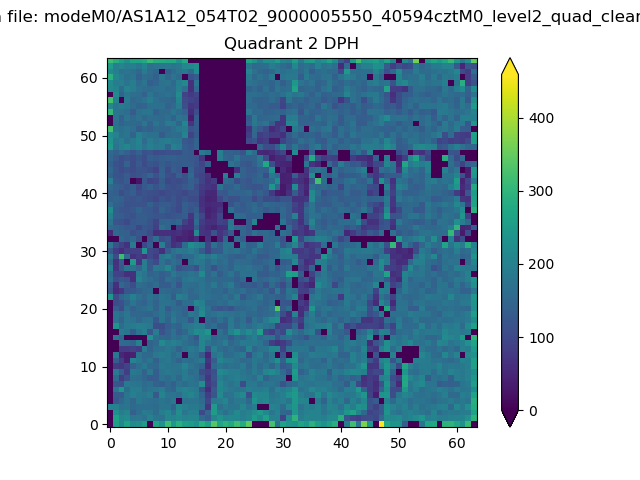
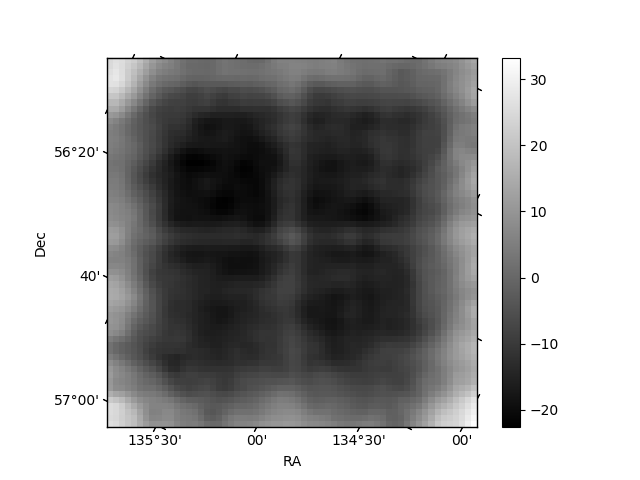
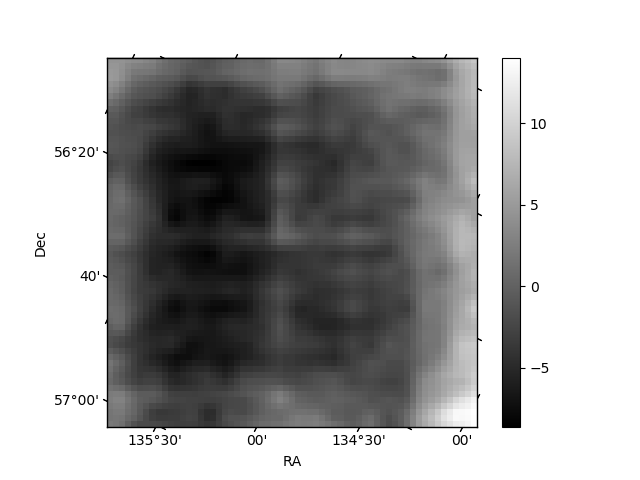
Histogram calculated using DETX and DETY for each event in the final _common_clean file
| Quadrant A | 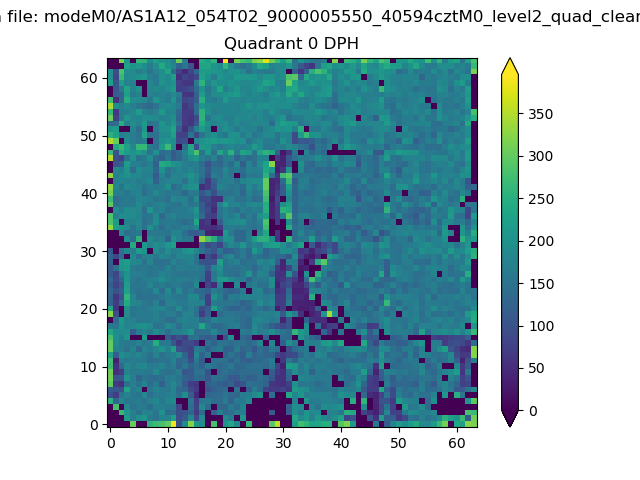 |
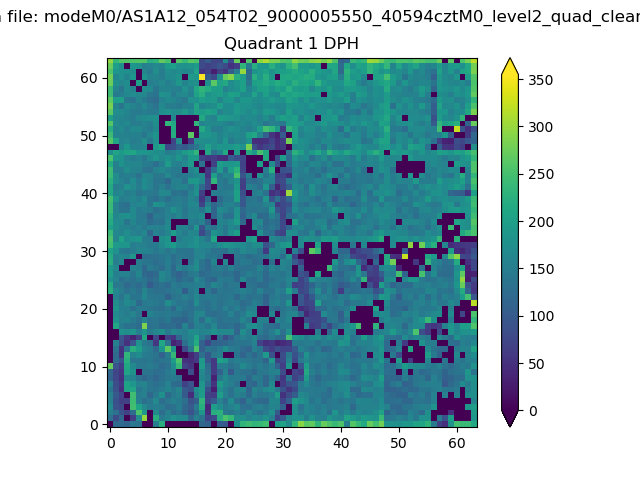 |
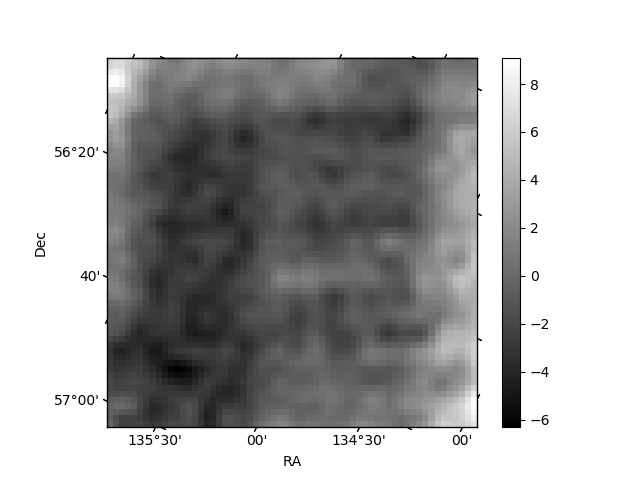
Quadrant B |
|---|---|---|---|
| Quadrant D | 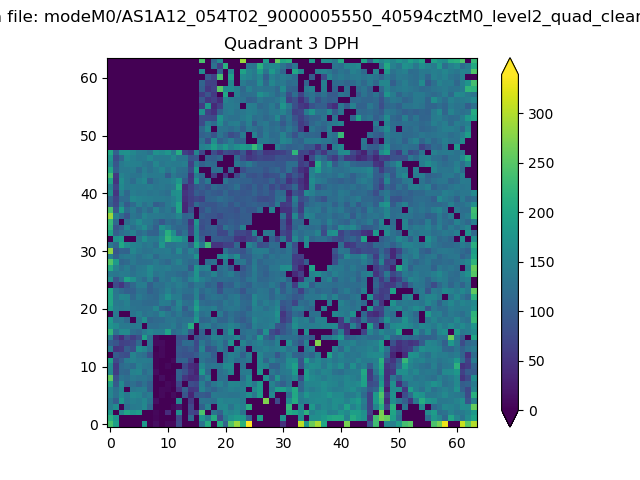 |
 |
Quadrant C |
| Plot type | Count rate plots | Images |
|---|---|---|
| Comparison with Poisson distribution Blue bars denote a histogram of data divided into 1 sec bins. Red curve is a Poisson curve with rate = median count rate of data. |
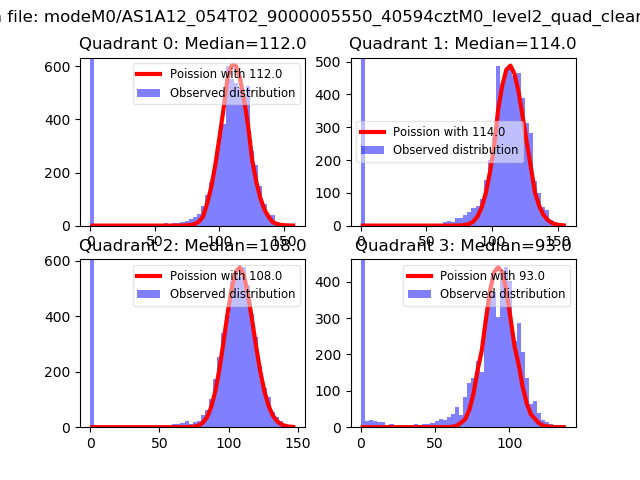 |
 |
| Quadrant-wise count rates Data is divided into 100 sec bins |
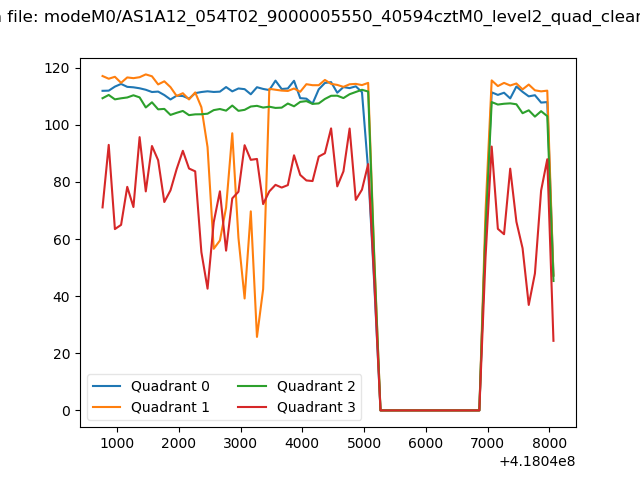 |
|
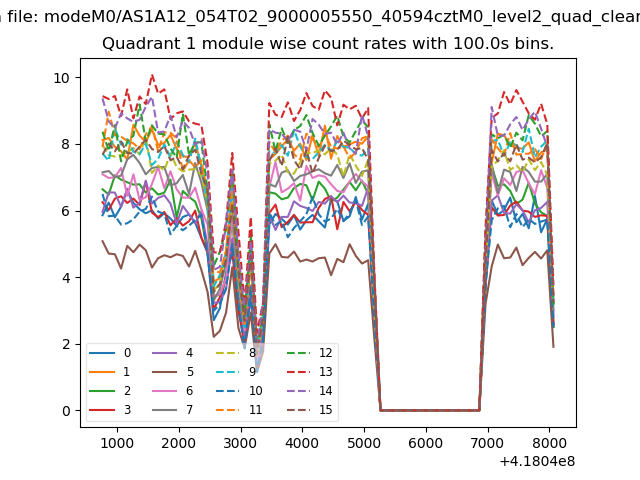
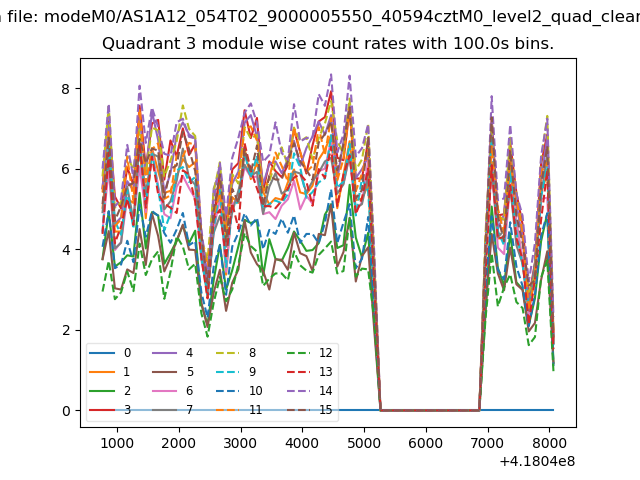
| Module-wise count rates for Quadrant A Data is divided into 100 sec bins |
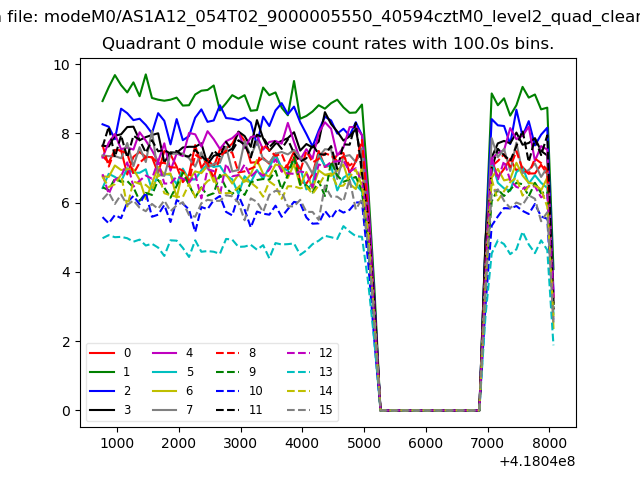 |
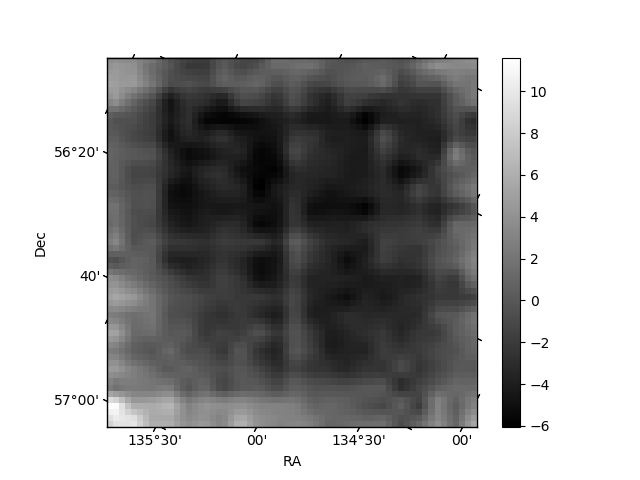 |
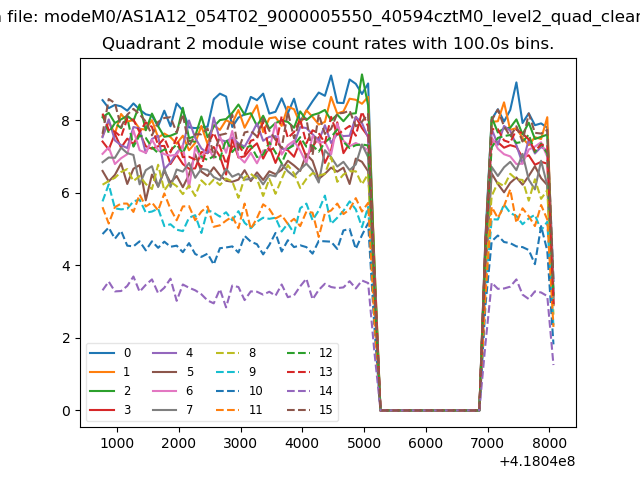
| Module-wise count rates for Quadrant B Data is divided into 100 sec bins |
 |
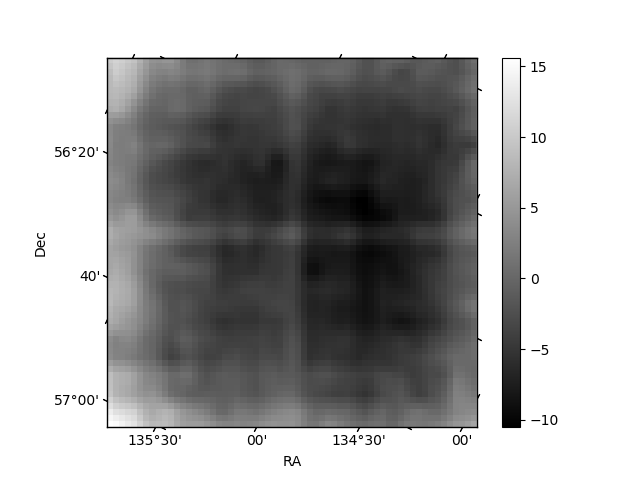 |
| Module-wise count rates for Quadrant C Data is divided into 100 sec bins |
 |
 |
| Module-wise count rates for Quadrant D Data is divided into 100 sec bins |
 |
 |
| Parameter | Plot |
|---|---|
| CZT HV Monitor | 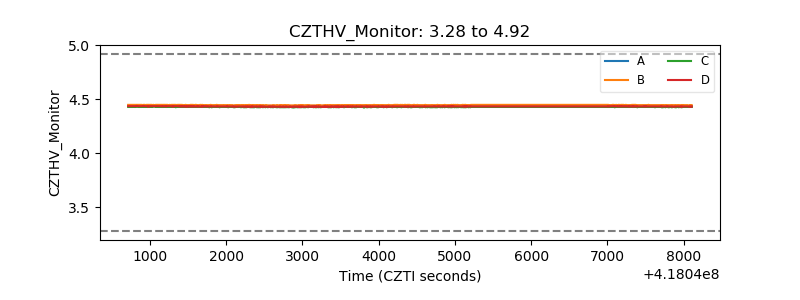 |
| D_VDD | 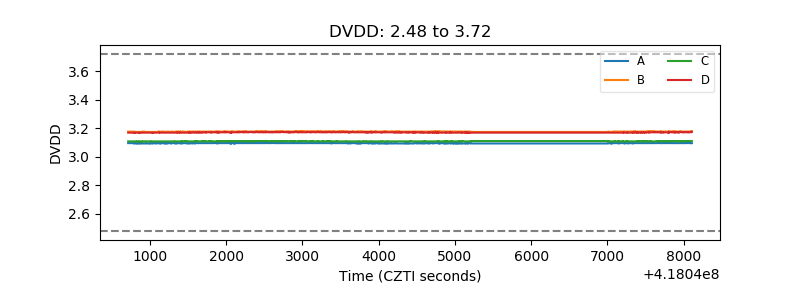 |
| Temperature 1 | 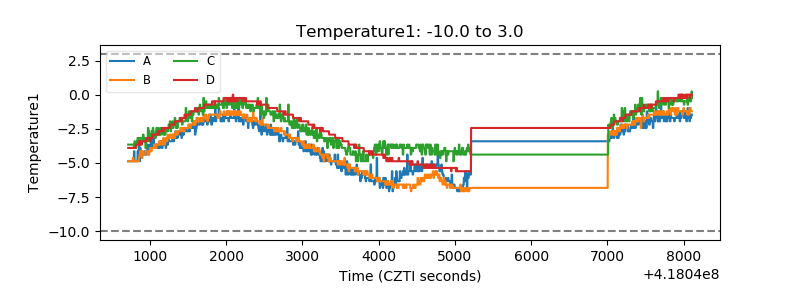 |
| Veto HV Monitor | 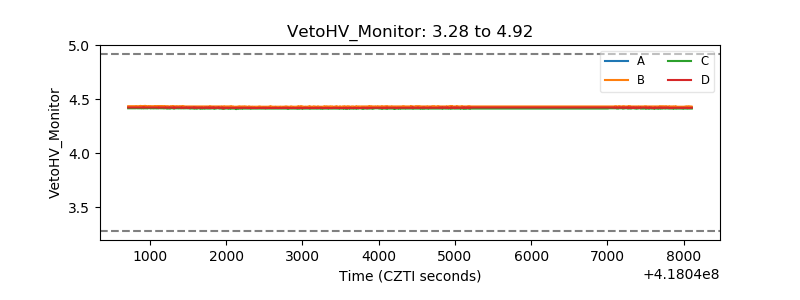 |
| Veto LLD | 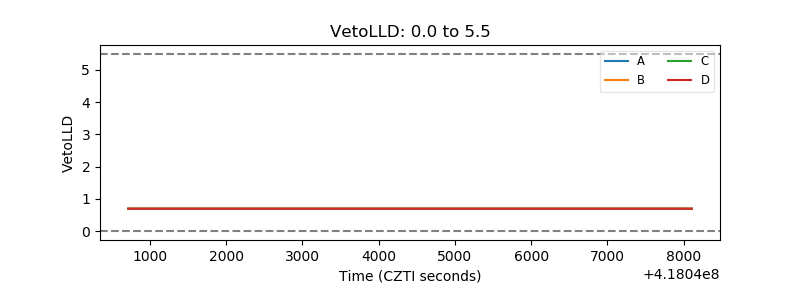 |
| Alpha Counter | 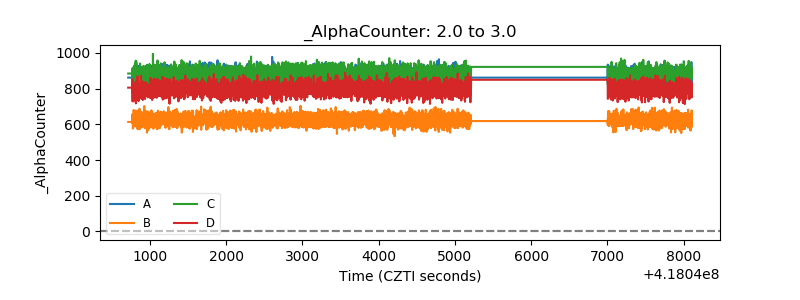 |
| _CPM_Rate | 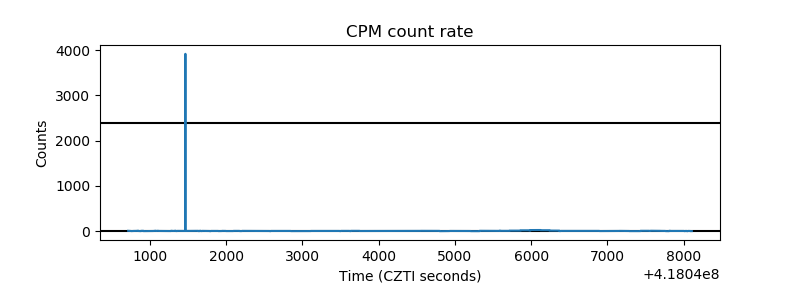 |
| CZT Counter | 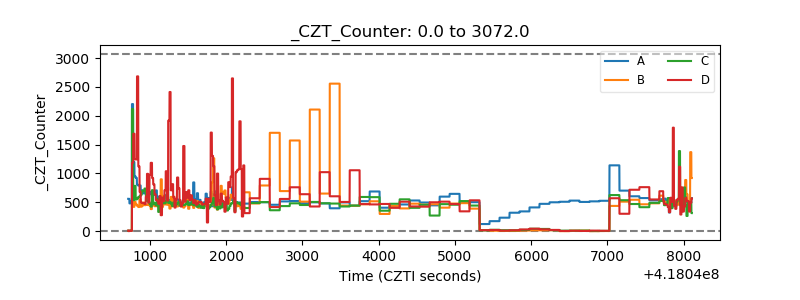 |
| +2.5 Volts monitor | 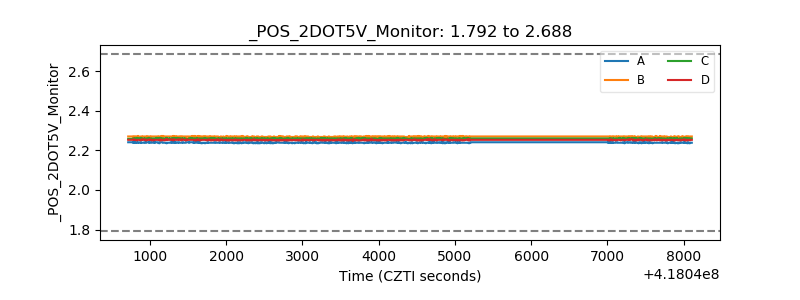 |
| +5 Volts monitor | 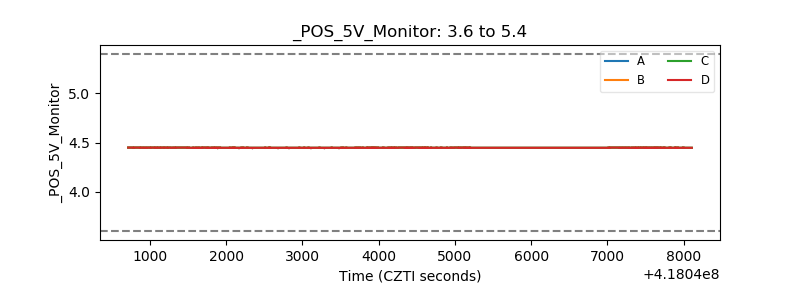 |
| _ROLL_ROT | 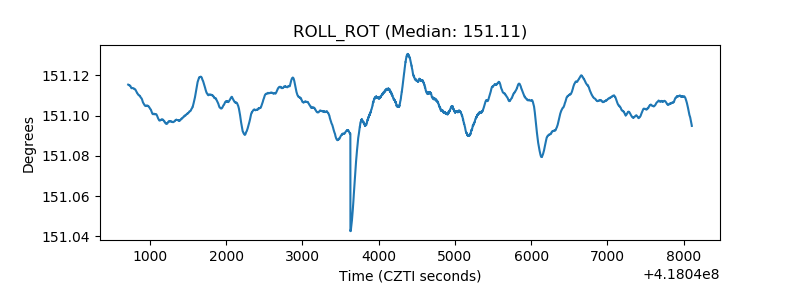 |
| _Roll_DEC | 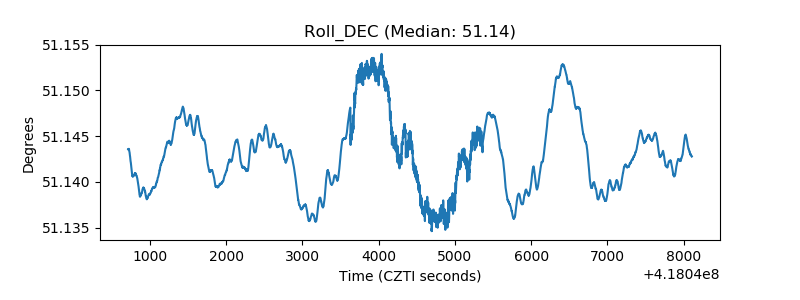 |
| _Roll_RA | 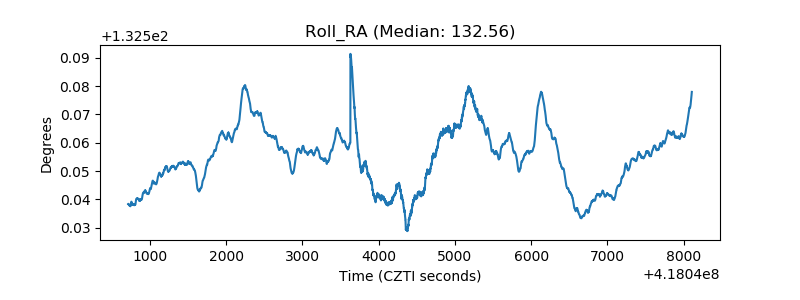 |
| Veto Counter | 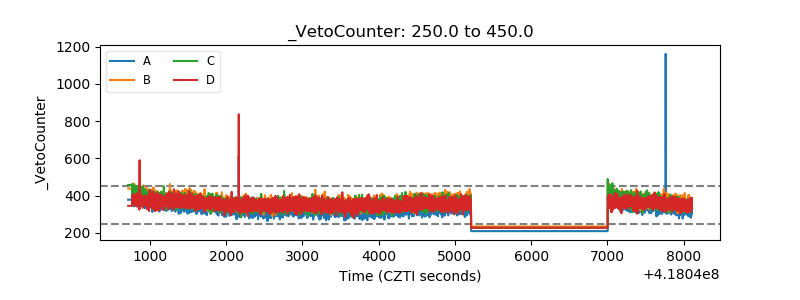 |