| Param | Original file | Final file |
|---|---|---|
| Filename | modeM0/AS1A12_054T02_9000005550_40595cztM0_level2.fits | modeM0/AS1A12_054T02_9000005550_40595cztM0_level2_quad_clean.evt |
| Size (bytes) | 376,551,360 | 88,577,280 |
| Size | 359.1 MB | 84.5 MB |
| Events in quadrant A | 3,080,066 | 636,692 |
| Events in quadrant B | 3,058,256 | 645,768 |
| Events in quadrant C | 3,816,317 | 581,453 |
| Events in quadrant D | 3,529,647 | 411,091 |
| Mode SS | |||
|---|---|---|---|
| Quadrant | BADHDUFLAG | Total packets | Discarded packets |
| A | 0 | 118 | 0 |
| B | 0 | 118 | 0 |
| C | 0 | 118 | 0 |
| D | 0 | 118 | 0 |
| Mode M0 | |||
|---|---|---|---|
| Quadrant | BADHDUFLAG | Total packets | Discarded packets |
| A | 0 | 12663 | 3 |
| B | 0 | 12935 | 2 |
| C | 0 | 15103 | 2 |
| D | 0 | 14452 | 2 |
| Mode M9 | |||
|---|---|---|---|
| Quadrant | BADHDUFLAG | Total packets | Discarded packets |
| A | 0 | 16 | 0 |
| B | 0 | 16 | 0 |
| C | 0 | 16 | 0 |
| D | 0 | 17 | 0 |
| Quadrant | Total seconds | Saturated seconds | Saturation percentage |
|---|---|---|---|
| A | 5812 | 18 | 0.309704% |
| B | 5812 | 38 | 0.653820% |
| C | 5812 | 345 | 5.935994% |
| D | 5812 | 1848 | 31.796284% |
Noise dominated data is calculated using 1-second bins in cleaned event files. If a bin has >2000 counts, and if more than 50% of those come from <1% of pixels, then it is considered to be noise-dominated and hence unusable.
| Quadrant | # 1 sec bins | Bins with >0 counts | Bins with >2000 counts | High rate bins dominated by noise | Noise dominated (total time) | Noise dominated (detector-on time) | Marked lightcurve |
|---|---|---|---|---|---|---|---|
| A | 7274 | 5813 | 7 | 7 | 0.10% | 0.12% | 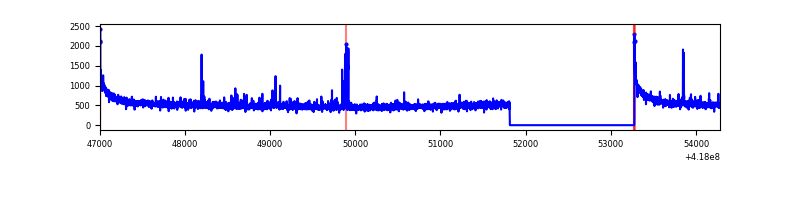 |
| B | 7274 | 5813 | 28 | 28 | 0.38% | 0.48% | 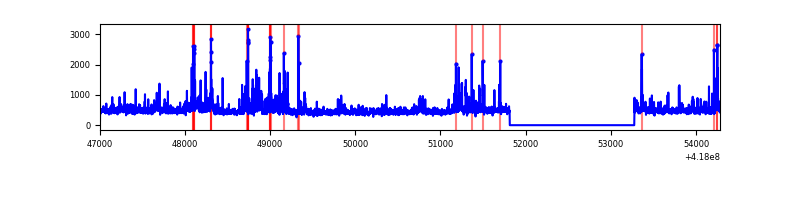 |
| C | 7274 | 5813 | 328 | 328 | 4.51% | 5.64% | 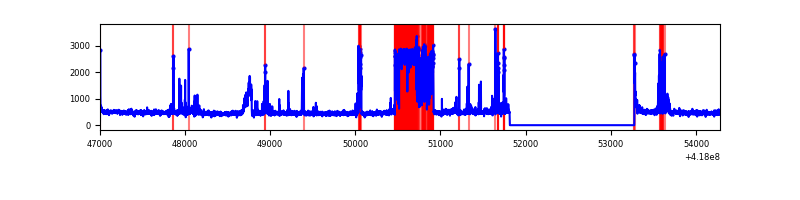 |
| D | 7273 | 5812 | 108 | 108 | 1.48% | 1.86% | 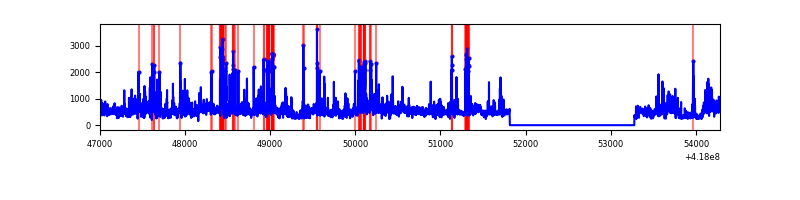 |
Top three noisy pixels from each quadrant. If the there are fewer than three noisy pixels in the level2.evt file, extra rows are filled as -1
| Pixel properties | Quadrant properties | ||||||
|---|---|---|---|---|---|---|---|
| Quadrant | DetID | PixID | Counts | Sigma | Mean | Median | Sigma |
| A | 10 | 83 | 553098 | 4284.58 | 627 | 613 | 128.9 |
| A | 2 | 79 | 51878 | 397.57 | 627 | 613 | 128.9 |
| A | 3 | 1 | 33454 | 254.69 | 627 | 613 | 128.9 |
| B | 0 | 190 | 368523 | 3077.41 | 622 | 606 | 119.6 |
| B | 5 | 255 | 70002 | 580.46 | 622 | 606 | 119.6 |
| B | 4 | 171 | 54728 | 452.7 | 622 | 606 | 119.6 |
| C | 14 | 254 | 1209502 | 8743.28 | 592 | 595 | 138.3 |
| C | 15 | 214 | 248928 | 1796.04 | 592 | 595 | 138.3 |
| C | 0 | 10 | 31483 | 223.39 | 592 | 595 | 138.3 |
| D | 12 | 227 | 395825 | 3154.73 | 502 | 487 | 125.3 |
| D | 12 | 191 | 384789 | 3066.67 | 502 | 487 | 125.3 |
| D | 13 | 249 | 230675 | 1836.86 | 502 | 487 | 125.3 |
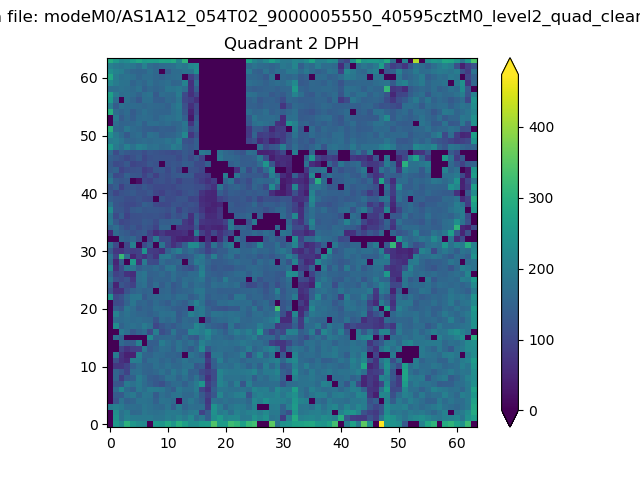
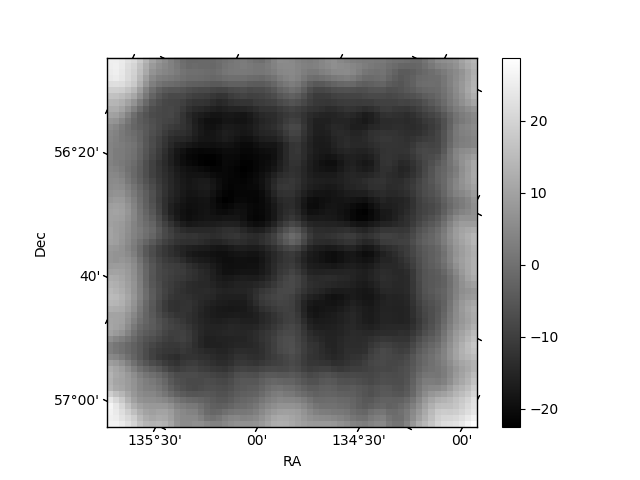
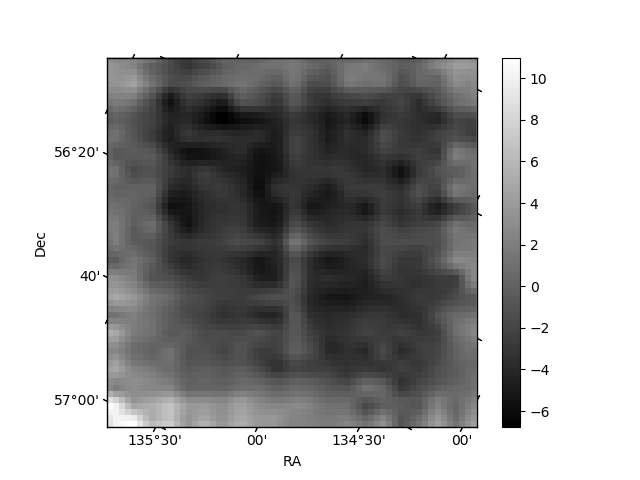
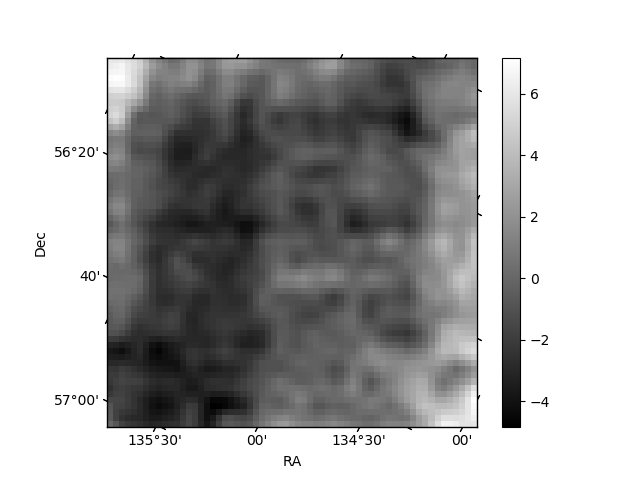
Histogram calculated using DETX and DETY for each event in the final _common_clean file
| Quadrant A | 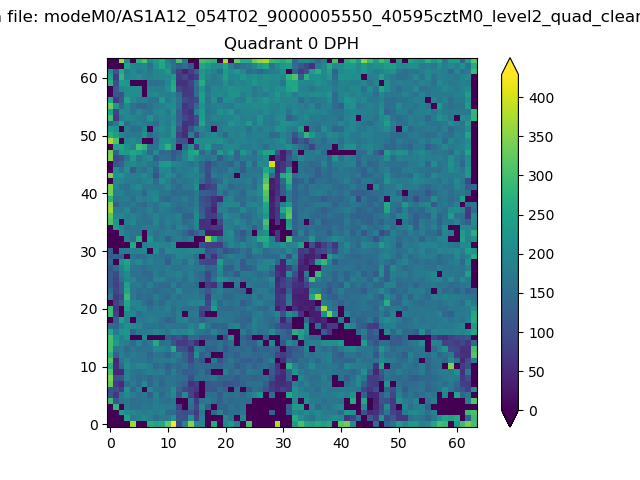 |
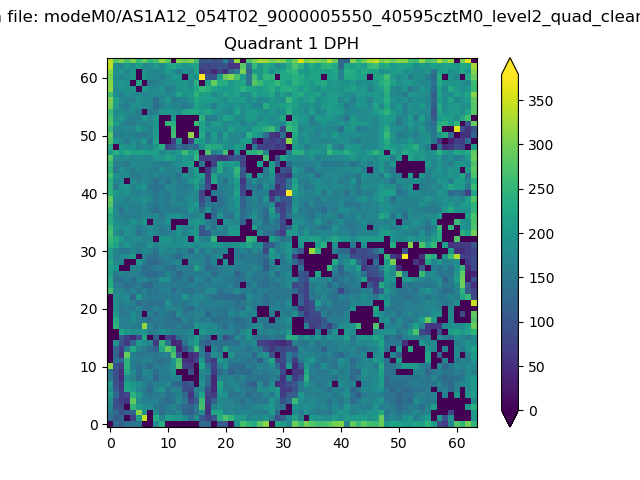 |
Quadrant B |
|---|---|---|---|
| Quadrant D | 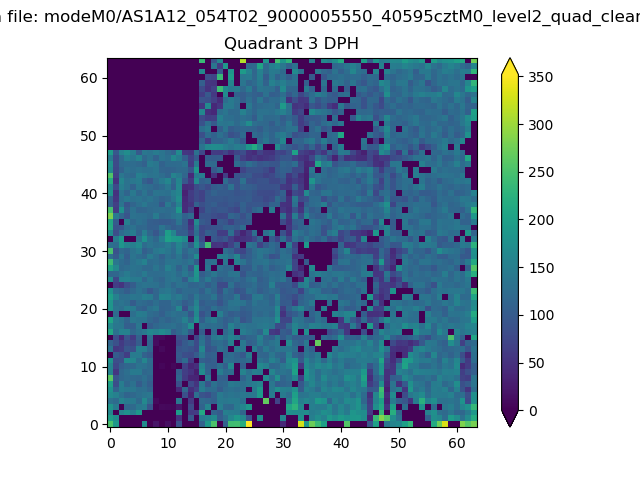 |
 |
Quadrant C |
| Plot type | Count rate plots | Images |
|---|---|---|
| Comparison with Poisson distribution Blue bars denote a histogram of data divided into 1 sec bins. Red curve is a Poisson curve with rate = median count rate of data. |
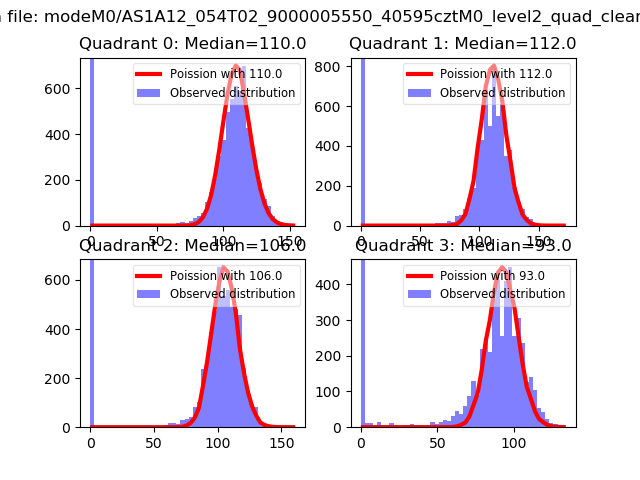 |
 |
| Quadrant-wise count rates Data is divided into 100 sec bins |
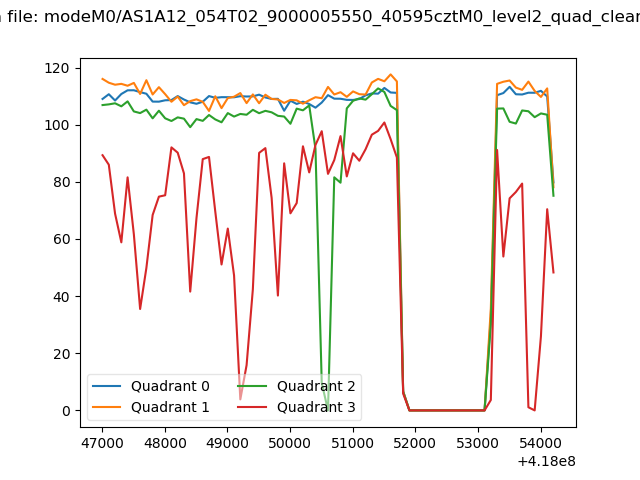 |
|
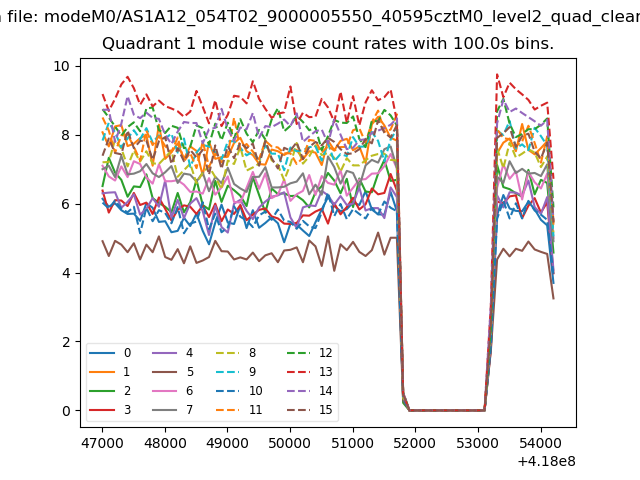
| Module-wise count rates for Quadrant A Data is divided into 100 sec bins |
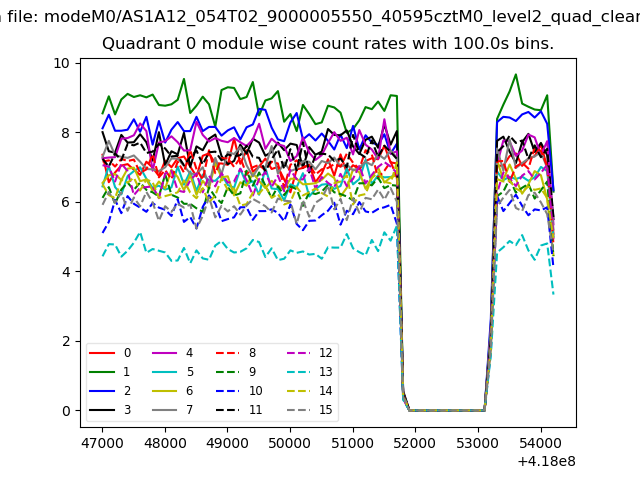 |
 |
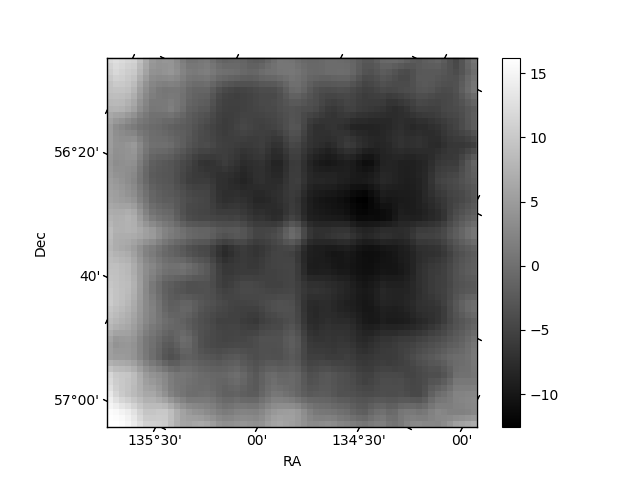
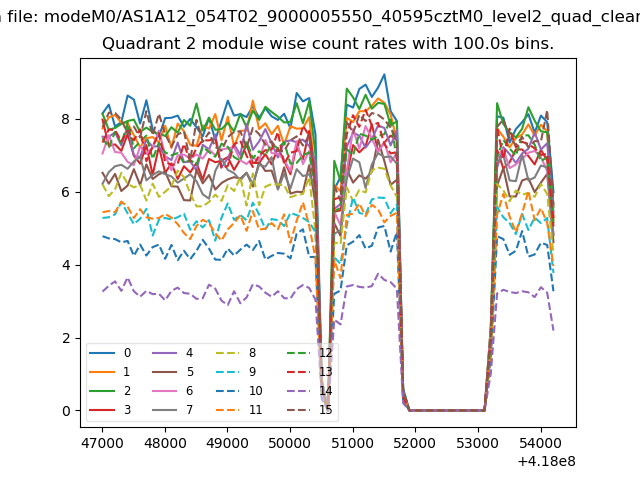
| Module-wise count rates for Quadrant B Data is divided into 100 sec bins |
 |
 |
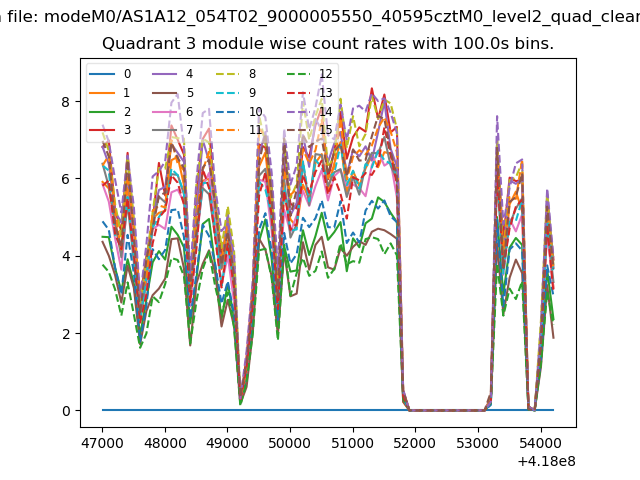
| Module-wise count rates for Quadrant C Data is divided into 100 sec bins |
 |
 |
| Module-wise count rates for Quadrant D Data is divided into 100 sec bins |
 |
 |
| Parameter | Plot |
|---|---|
| CZT HV Monitor | 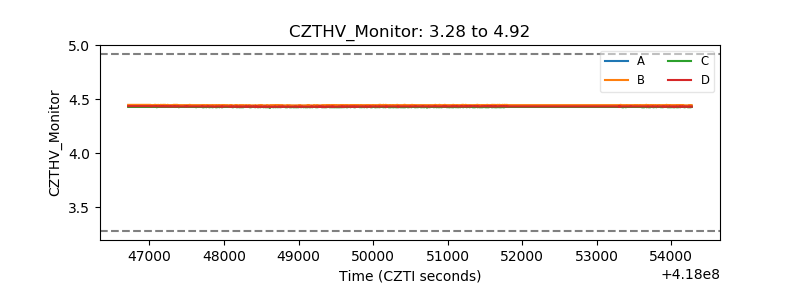 |
| D_VDD | 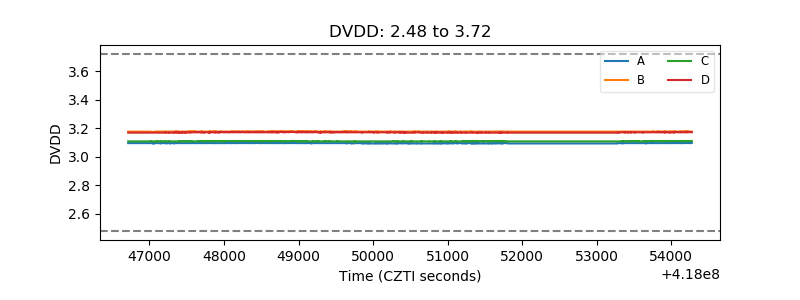 |
| Temperature 1 | 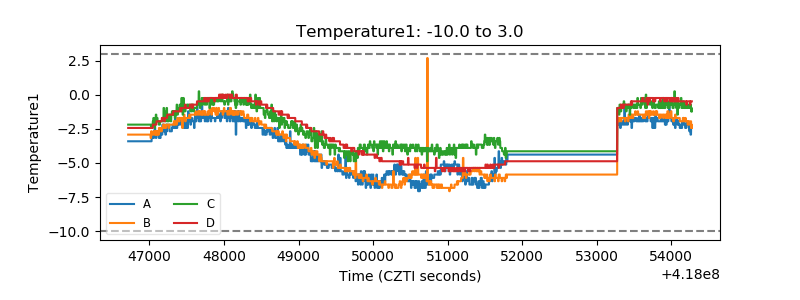 |
| Veto HV Monitor | 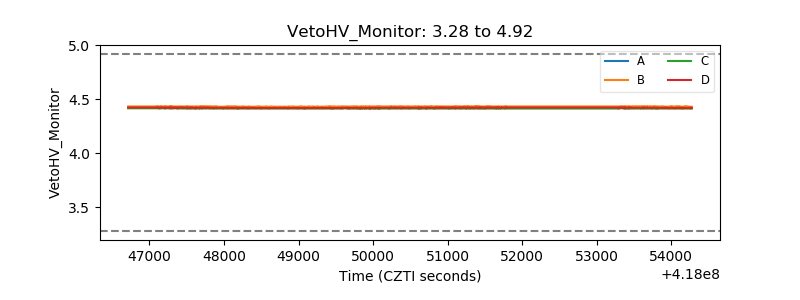 |
| Veto LLD | 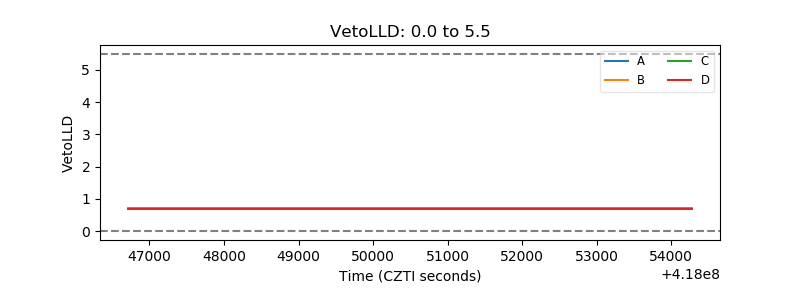 |
| Alpha Counter | 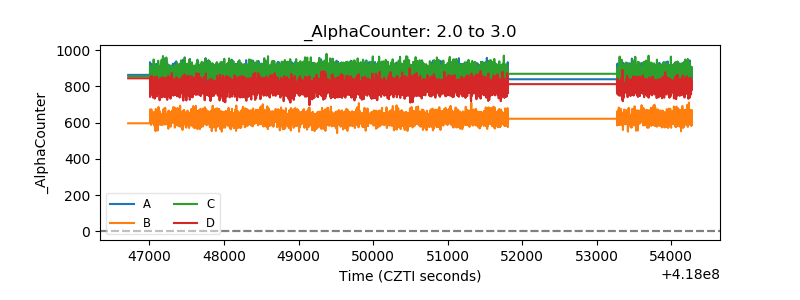 |
| _CPM_Rate | 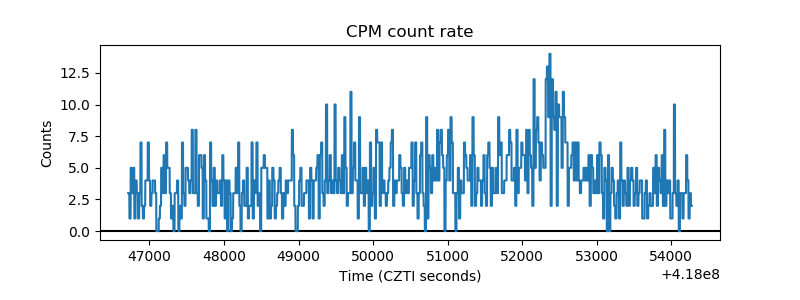 |
| CZT Counter | 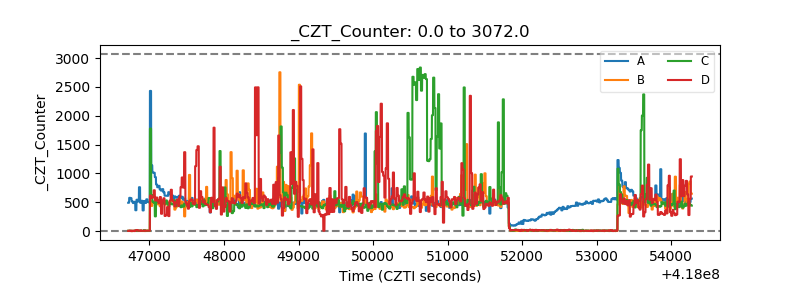 |
| +2.5 Volts monitor |  |
| +5 Volts monitor | 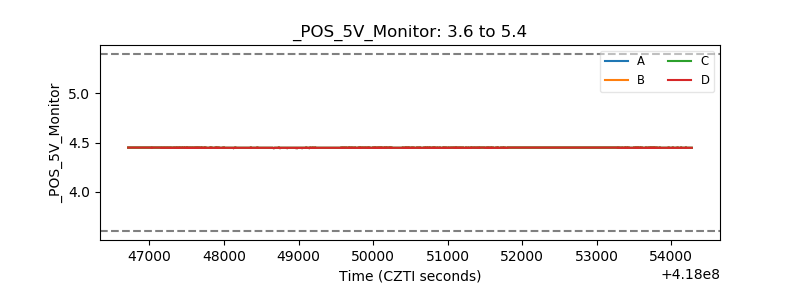 |
| _ROLL_ROT | 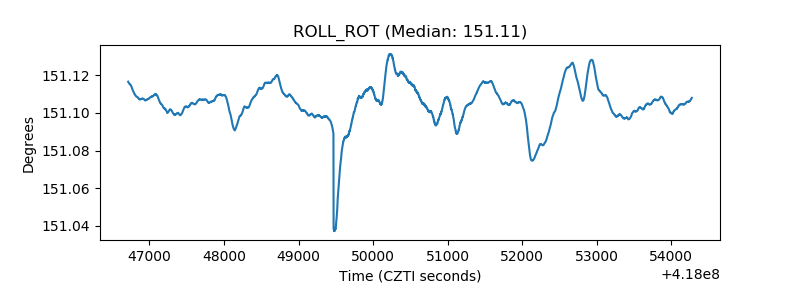 |
| _Roll_DEC | 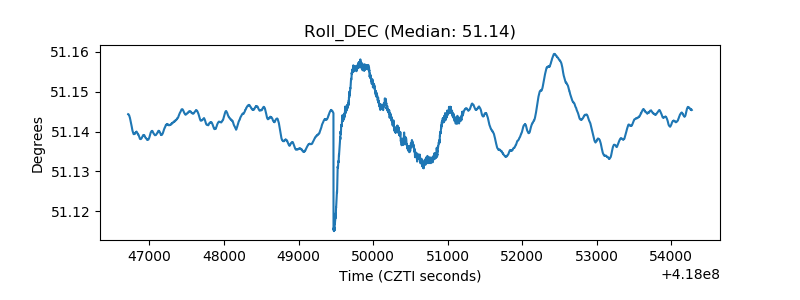 |
| _Roll_RA | 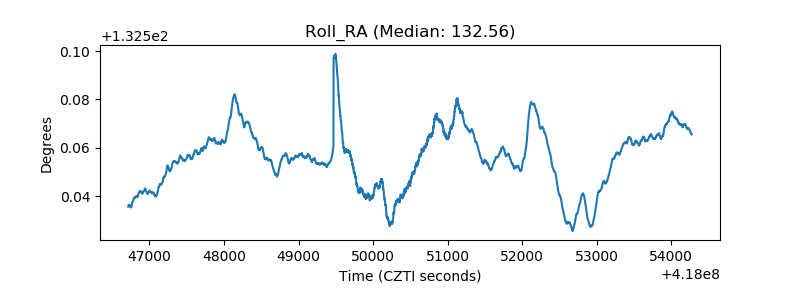 |
| Veto Counter | 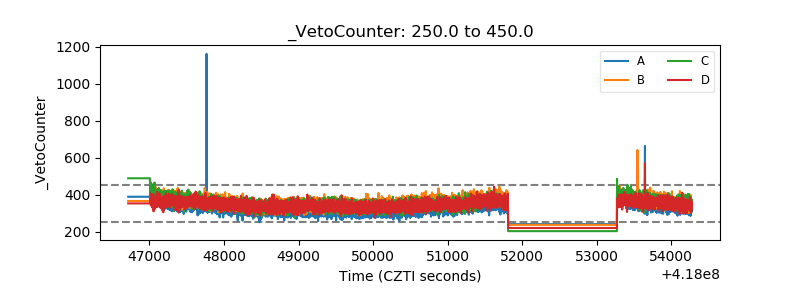 |