| Param | Original file | Final file |
|---|---|---|
| Filename | modeM0/AS1A12_054T02_9000005550_40596cztM0_level2.fits | modeM0/AS1A12_054T02_9000005550_40596cztM0_level2_quad_clean.evt |
| Size (bytes) | 429,580,800 | 85,734,720 |
| Size | 409.7 MB | 81.8 MB |
| Events in quadrant A | 3,117,359 | 646,054 |
| Events in quadrant B | 3,385,004 | 642,946 |
| Events in quadrant C | 3,661,000 | 592,153 |
| Events in quadrant D | 5,274,693 | 300,551 |
| Mode SS | |||
|---|---|---|---|
| Quadrant | BADHDUFLAG | Total packets | Discarded packets |
| A | 0 | 120 | 0 |
| B | 0 | 120 | 0 |
| C | 0 | 120 | 0 |
| D | 0 | 120 | 0 |
| Mode M0 | |||
|---|---|---|---|
| Quadrant | BADHDUFLAG | Total packets | Discarded packets |
| A | 0 | 12907 | 3 |
| B | 0 | 13880 | 2 |
| C | 0 | 14723 | 2 |
| D | 0 | 19918 | 2 |
| Mode M9 | |||
|---|---|---|---|
| Quadrant | BADHDUFLAG | Total packets | Discarded packets |
| A | 0 | 18 | 0 |
| B | 0 | 18 | 0 |
| C | 0 | 18 | 0 |
| D | 0 | 19 | 0 |
| Quadrant | Total seconds | Saturated seconds | Saturation percentage |
|---|---|---|---|
| A | 5922 | 16 | 0.270179% |
| B | 5922 | 161 | 2.718676% |
| C | 5922 | 320 | 5.403580% |
| D | 5922 | 3192 | 53.900709% |
Noise dominated data is calculated using 1-second bins in cleaned event files. If a bin has >2000 counts, and if more than 50% of those come from <1% of pixels, then it is considered to be noise-dominated and hence unusable.
| Quadrant | # 1 sec bins | Bins with >0 counts | Bins with >2000 counts | High rate bins dominated by noise | Noise dominated (total time) | Noise dominated (detector-on time) | Marked lightcurve |
|---|---|---|---|---|---|---|---|
| A | 7234 | 5923 | 6 | 6 | 0.08% | 0.10% | 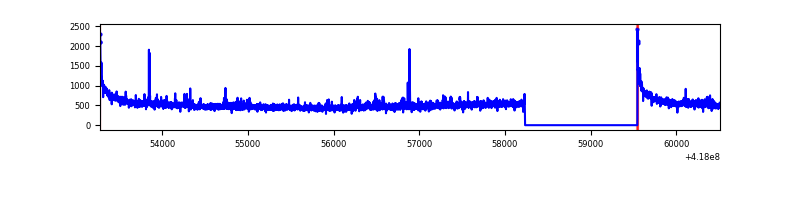 |
| B | 7234 | 5923 | 137 | 137 | 1.89% | 2.31% | 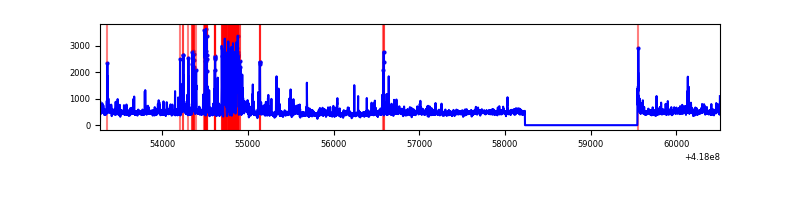 |
| C | 7234 | 5922 | 296 | 296 | 4.09% | 5.00% | 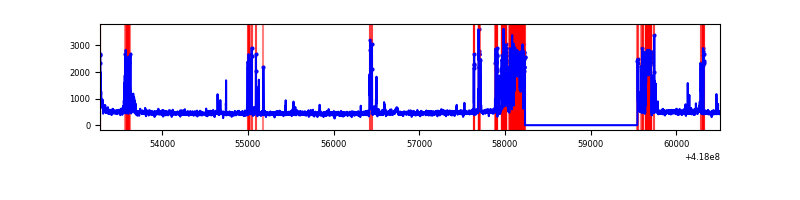 |
| D | 7233 | 5922 | 301 | 301 | 4.16% | 5.08% | 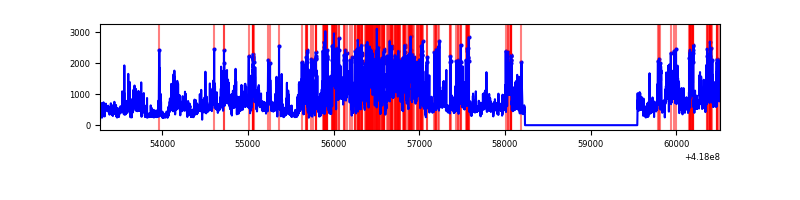 |
Top three noisy pixels from each quadrant. If the there are fewer than three noisy pixels in the level2.evt file, extra rows are filled as -1
| Pixel properties | Quadrant properties | ||||||
|---|---|---|---|---|---|---|---|
| Quadrant | DetID | PixID | Counts | Sigma | Mean | Median | Sigma |
| A | 10 | 83 | 561151 | 4247.66 | 637 | 625 | 132.0 |
| A | 12 | 189 | 56980 | 427.06 | 637 | 625 | 132.0 |
| A | 2 | 79 | 15371 | 111.75 | 637 | 625 | 132.0 |
| B | 0 | 190 | 625312 | 5182.54 | 626 | 608 | 120.5 |
| B | 5 | 255 | 82716 | 681.17 | 626 | 608 | 120.5 |
| B | 4 | 171 | 80757 | 664.92 | 626 | 608 | 120.5 |
| C | 14 | 254 | 960203 | 6715.87 | 608 | 611 | 142.9 |
| C | 15 | 214 | 252885 | 1765.58 | 608 | 611 | 142.9 |
| C | 0 | 10 | 32561 | 223.61 | 608 | 611 | 142.9 |
| D | 2 | 153 | 1931772 | 16833.44 | 464 | 451 | 114.7 |
| D | 12 | 227 | 520449 | 4532.31 | 464 | 451 | 114.7 |
| D | 12 | 191 | 413098 | 3596.64 | 464 | 451 | 114.7 |
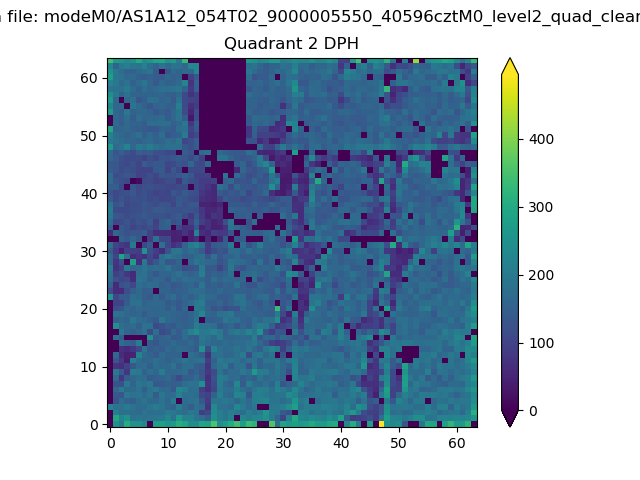
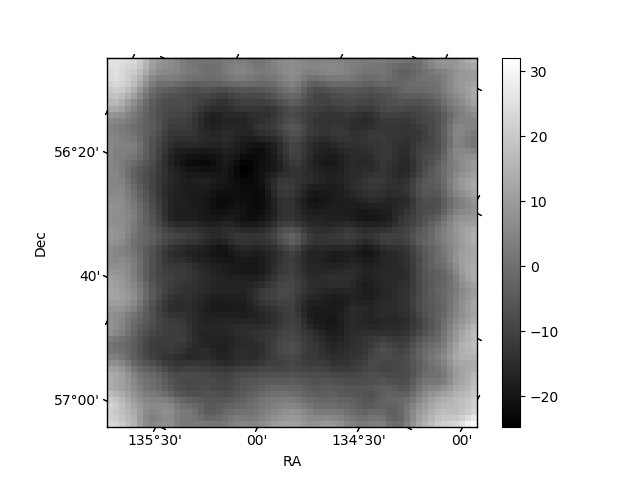
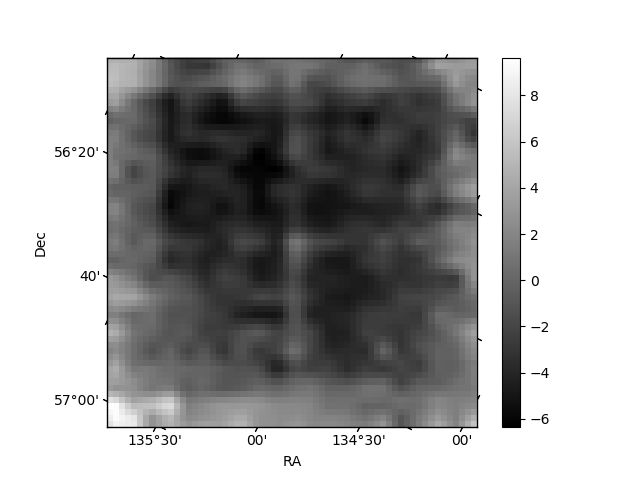
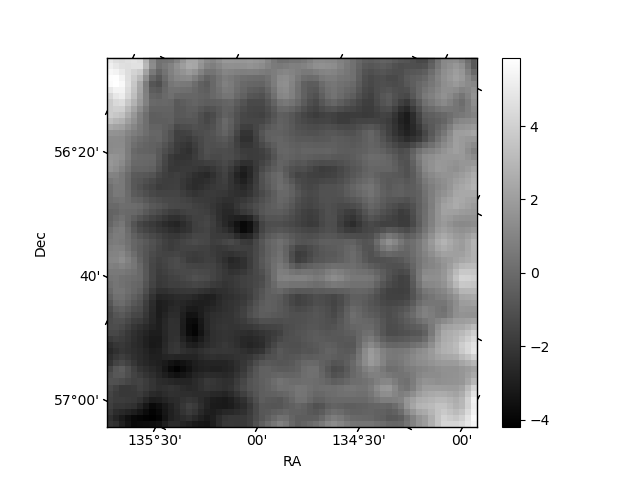
Histogram calculated using DETX and DETY for each event in the final _common_clean file
| Quadrant A | 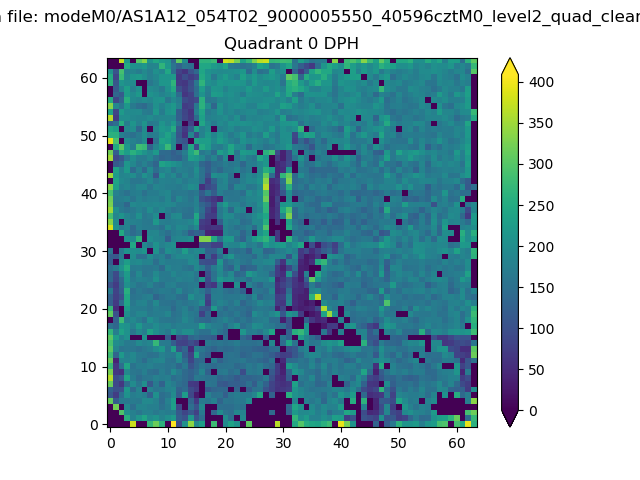 |
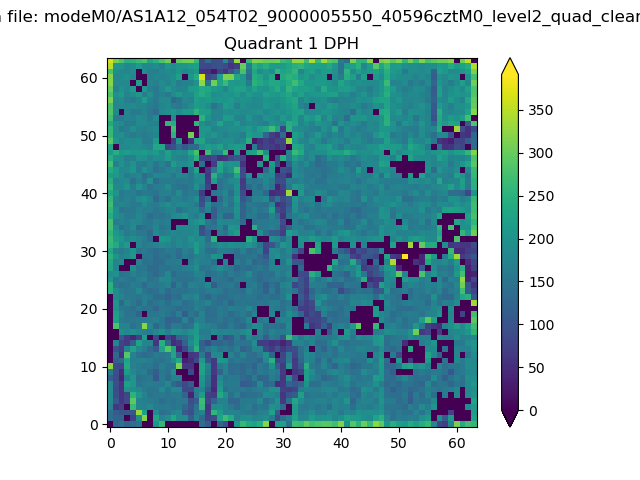 |
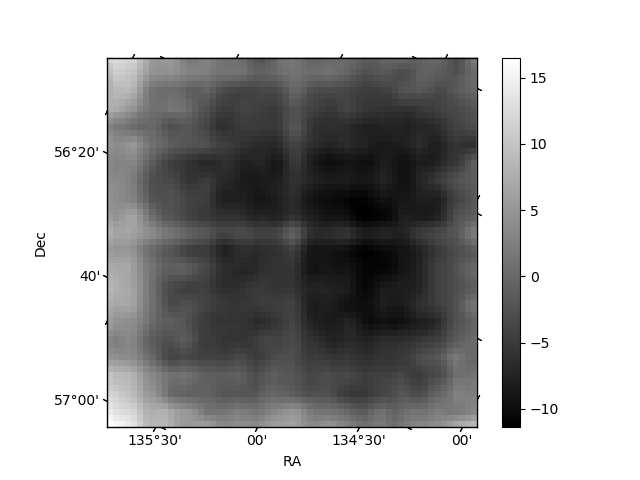
Quadrant B |
|---|---|---|---|
| Quadrant D | 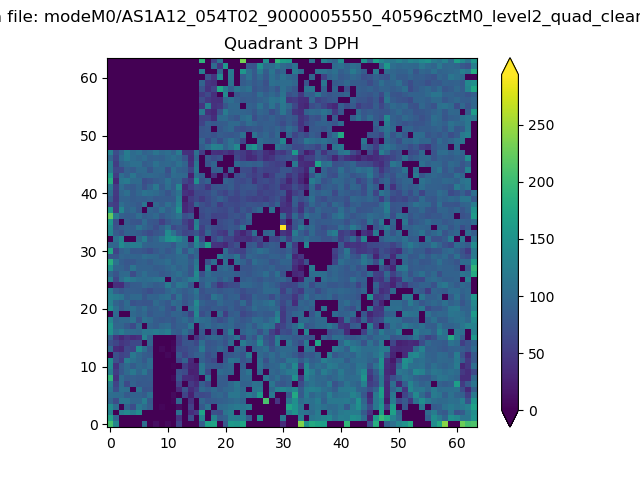 |
 |
Quadrant C |
| Plot type | Count rate plots | Images |
|---|---|---|
| Comparison with Poisson distribution Blue bars denote a histogram of data divided into 1 sec bins. Red curve is a Poisson curve with rate = median count rate of data. |
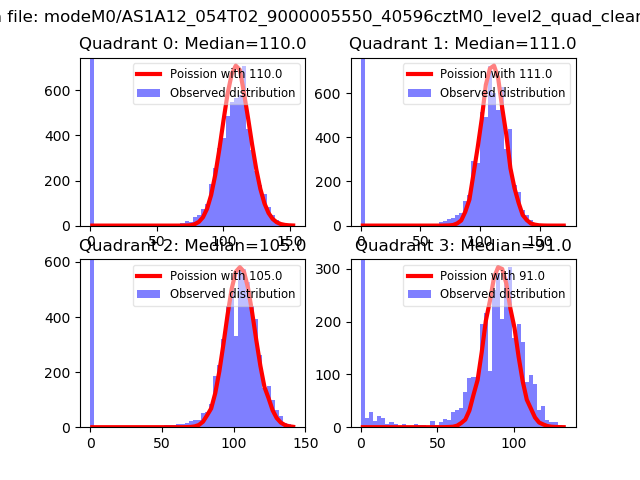 |
 |
| Quadrant-wise count rates Data is divided into 100 sec bins |
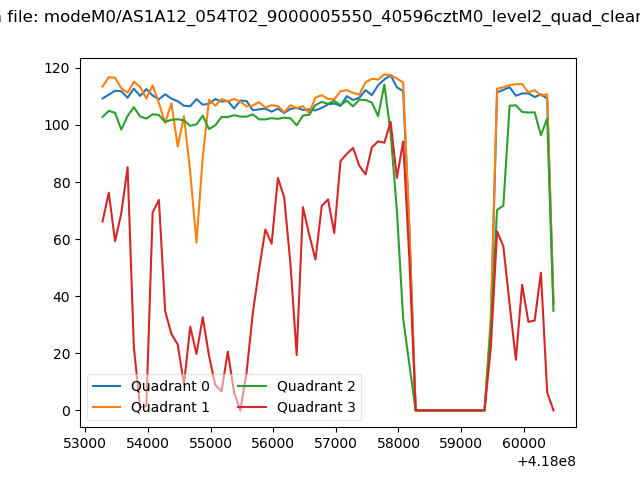 |
|
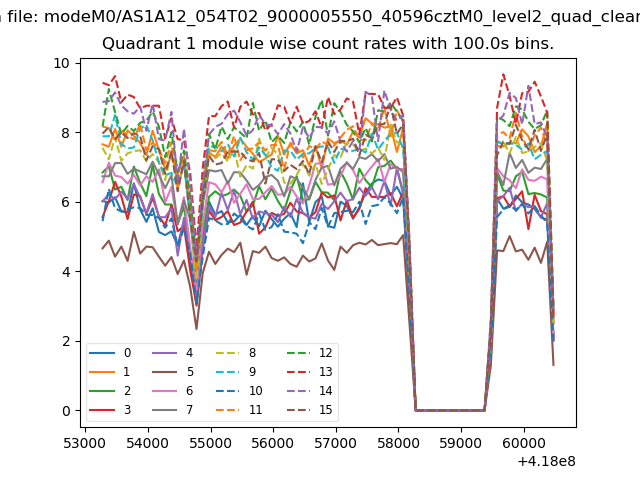
| Module-wise count rates for Quadrant A Data is divided into 100 sec bins |
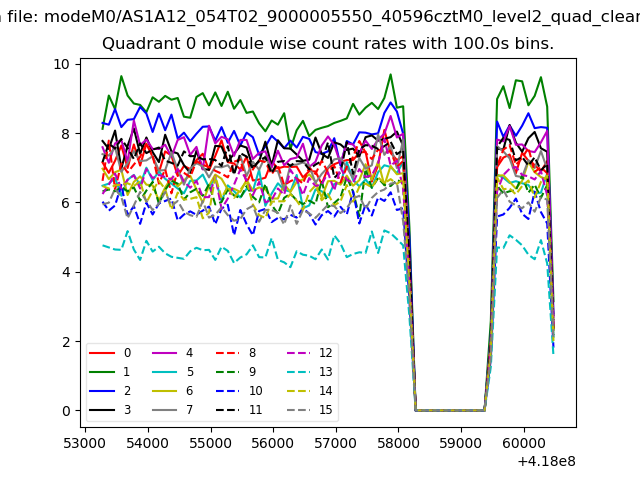 |
 |
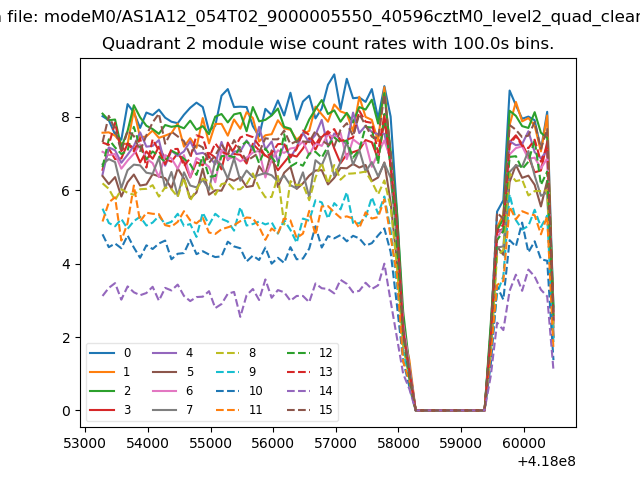
| Module-wise count rates for Quadrant B Data is divided into 100 sec bins |
 |
 |
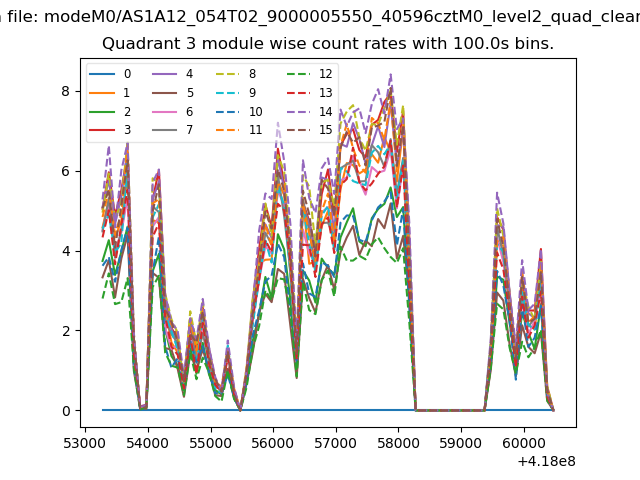
| Module-wise count rates for Quadrant C Data is divided into 100 sec bins |
 |
 |
| Module-wise count rates for Quadrant D Data is divided into 100 sec bins |
 |
 |
| Parameter | Plot |
|---|---|
| CZT HV Monitor | 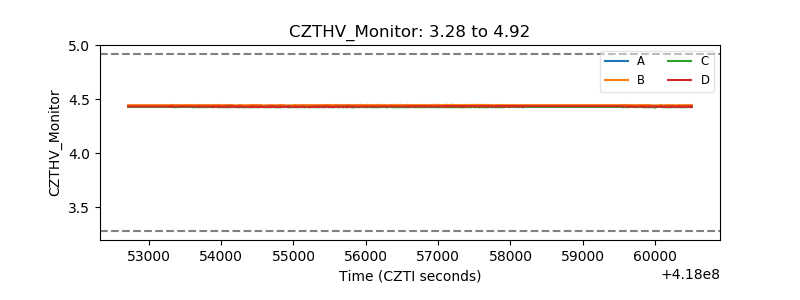 |
| D_VDD | 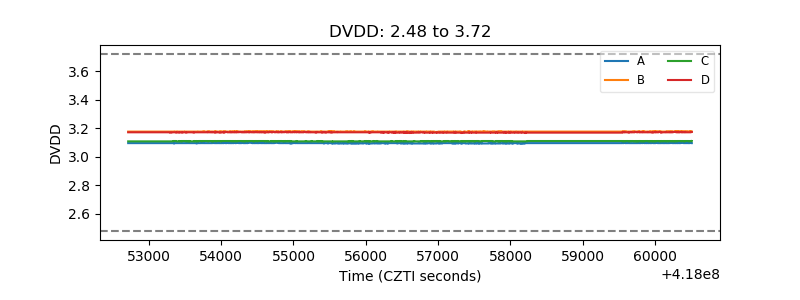 |
| Temperature 1 | 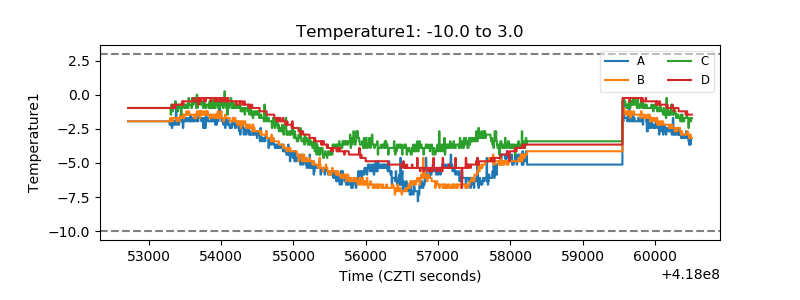 |
| Veto HV Monitor |  |
| Veto LLD | 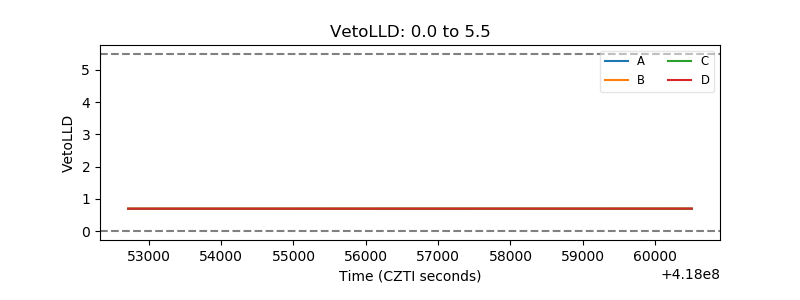 |
| Alpha Counter | 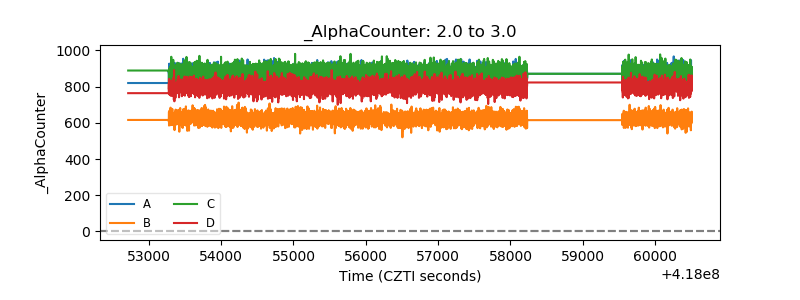 |
| _CPM_Rate | 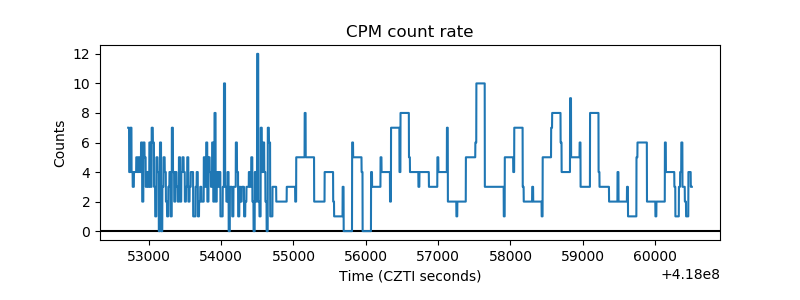 |
| CZT Counter | 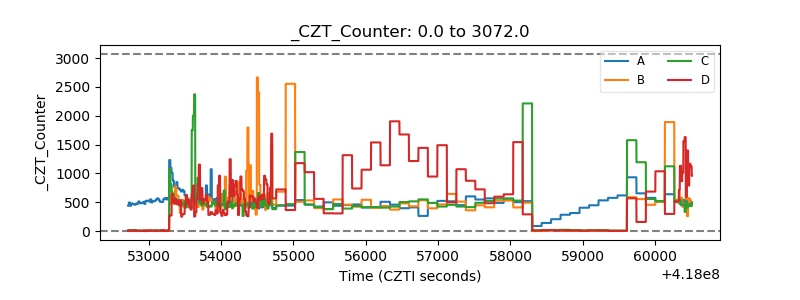 |
| +2.5 Volts monitor | 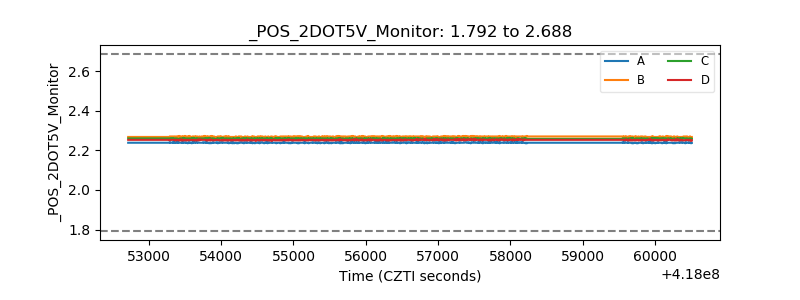 |
| +5 Volts monitor | 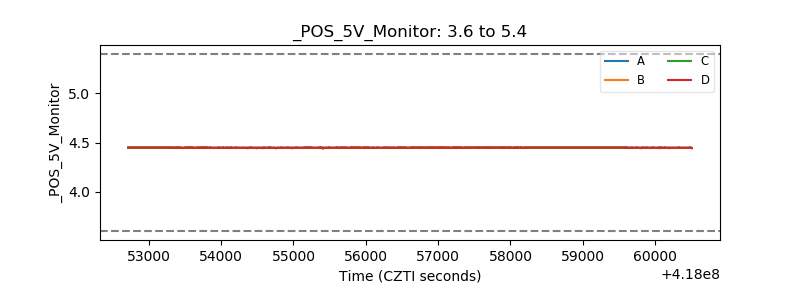 |
| _ROLL_ROT | 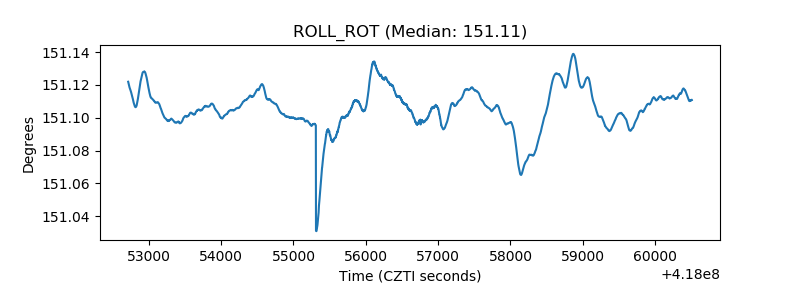 |
| _Roll_DEC | 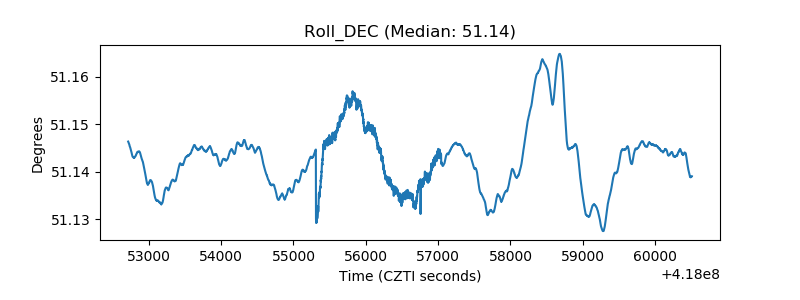 |
| _Roll_RA | 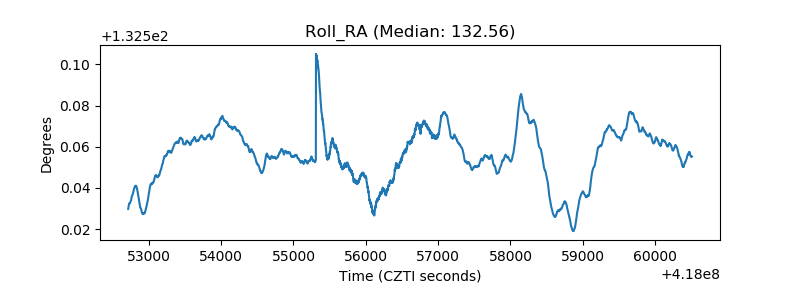 |
| Veto Counter | 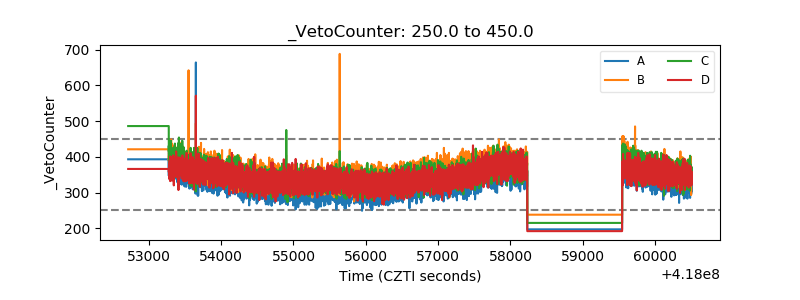 |