| Param | Original file | Final file |
|---|---|---|
| Filename | modeM0/AS1A12_054T02_9000005550_40599cztM0_level2.fits | modeM0/AS1A12_054T02_9000005550_40599cztM0_level2_quad_clean.evt |
| Size (bytes) | 1,028,148,480 | 226,618,560 |
| Size | 980.5 MB | 216.1 MB |
| Events in quadrant A | 8,074,413 | 1,667,710 |
| Events in quadrant B | 8,047,132 | 1,690,834 |
| Events in quadrant C | 8,158,074 | 1,604,442 |
| Events in quadrant D | 12,564,807 | 822,460 |
| Mode SS | |||
|---|---|---|---|
| Quadrant | BADHDUFLAG | Total packets | Discarded packets |
| A | 0 | 314 | 0 |
| B | 0 | 314 | 0 |
| C | 0 | 314 | 0 |
| D | 0 | 314 | 0 |
| Mode M0 | |||
|---|---|---|---|
| Quadrant | BADHDUFLAG | Total packets | Discarded packets |
| A | 0 | 33836 | 5 |
| B | 0 | 34141 | 4 |
| C | 0 | 34451 | 4 |
| D | 0 | 48425 | 4 |
| Mode M9 | |||
|---|---|---|---|
| Quadrant | BADHDUFLAG | Total packets | Discarded packets |
| A | 0 | 42 | 0 |
| B | 0 | 42 | 0 |
| C | 0 | 42 | 0 |
| D | 0 | 43 | 0 |
| Quadrant | Total seconds | Saturated seconds | Saturation percentage |
|---|---|---|---|
| A | 15586 | 43 | 0.275889% |
| B | 15586 | 107 | 0.686514% |
| C | 15586 | 310 | 1.988964% |
| D | 15586 | 7772 | 49.865264% |
Noise dominated data is calculated using 1-second bins in cleaned event files. If a bin has >2000 counts, and if more than 50% of those come from <1% of pixels, then it is considered to be noise-dominated and hence unusable.
| Quadrant | # 1 sec bins | Bins with >0 counts | Bins with >2000 counts | High rate bins dominated by noise | Noise dominated (total time) | Noise dominated (detector-on time) | Marked lightcurve |
|---|---|---|---|---|---|---|---|
| A | 19765 | 15589 | 15 | 15 | 0.08% | 0.10% | 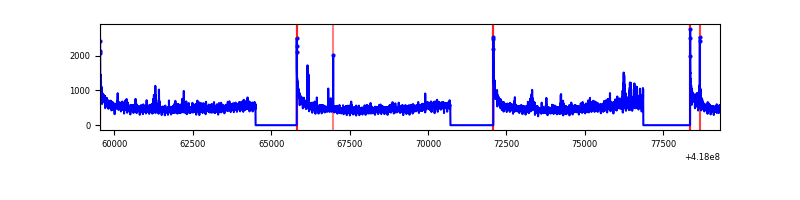 |
| B | 19765 | 15589 | 66 | 66 | 0.33% | 0.42% | 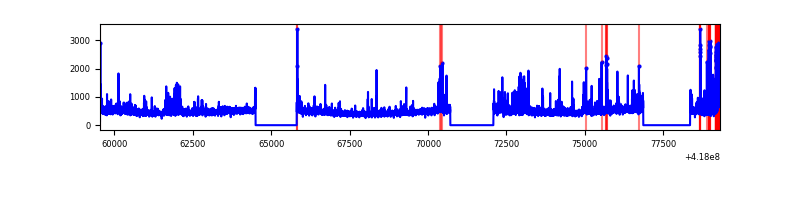 |
| C | 19765 | 15589 | 300 | 300 | 1.52% | 1.92% | 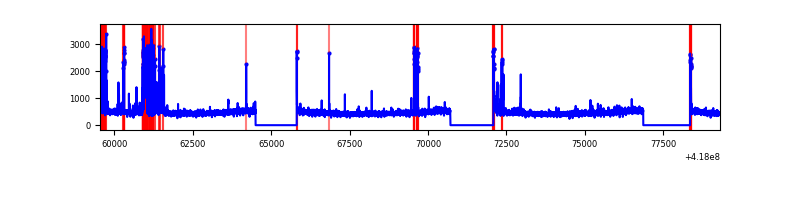 |
| D | 19765 | 15588 | 550 | 550 | 2.78% | 3.53% | 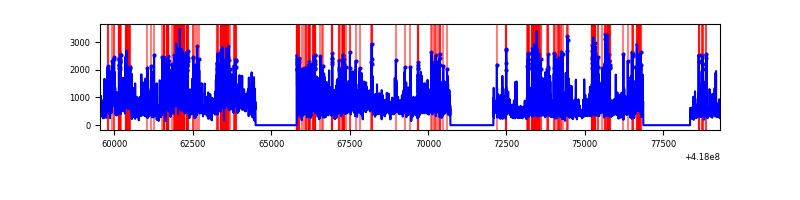 |
Top three noisy pixels from each quadrant. If the there are fewer than three noisy pixels in the level2.evt file, extra rows are filled as -1
| Pixel properties | Quadrant properties | ||||||
|---|---|---|---|---|---|---|---|
| Quadrant | DetID | PixID | Counts | Sigma | Mean | Median | Sigma |
| A | 10 | 83 | 1296144 | 3805.31 | 1670 | 1638 | 340.2 |
| A | 12 | 189 | 143913 | 418.23 | 1670 | 1638 | 340.2 |
| A | 2 | 79 | 69739 | 200.19 | 1670 | 1638 | 340.2 |
| B | 0 | 190 | 649183 | 2035.0 | 1660 | 1615 | 318.2 |
| B | 3 | 112 | 381057 | 1192.41 | 1660 | 1615 | 318.2 |
| B | 5 | 255 | 309658 | 968.03 | 1660 | 1615 | 318.2 |
| C | 14 | 254 | 991220 | 2630.77 | 1622 | 1630 | 376.2 |
| C | 15 | 214 | 662620 | 1757.21 | 1622 | 1630 | 376.2 |
| C | 0 | 10 | 109068 | 285.62 | 1622 | 1630 | 376.2 |
| D | 2 | 153 | 3235829 | 10389.4 | 1251 | 1217 | 311.3 |
| D | 12 | 227 | 1283327 | 4118.07 | 1251 | 1217 | 311.3 |
| D | 12 | 191 | 1050031 | 3368.73 | 1251 | 1217 | 311.3 |
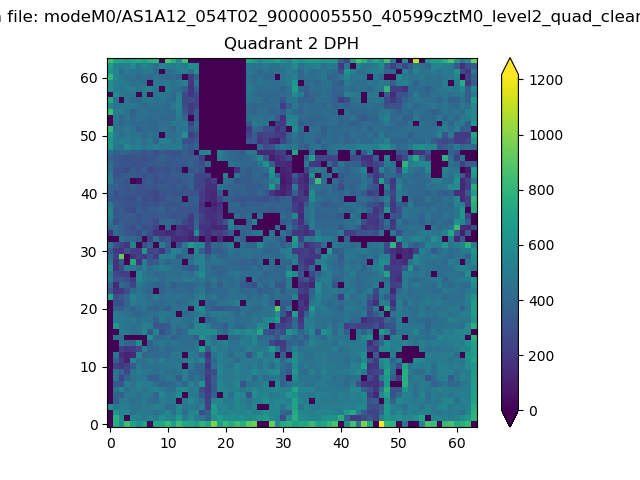
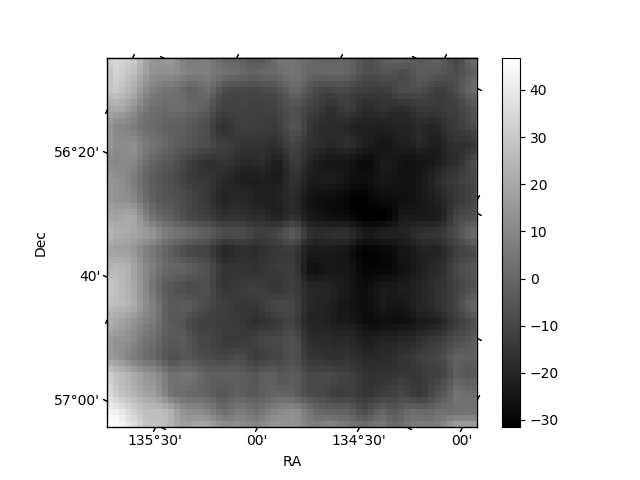
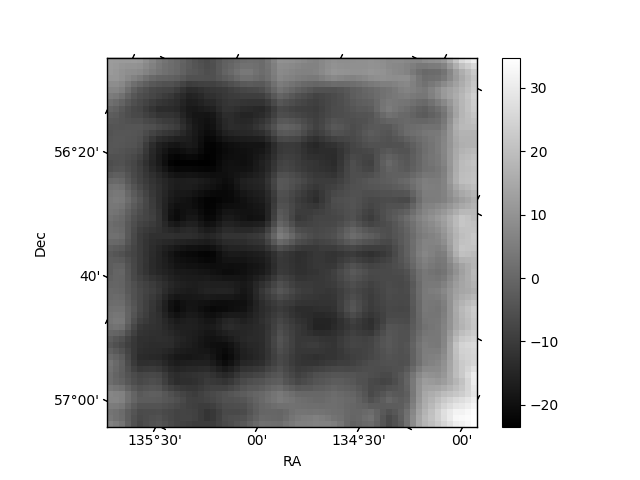
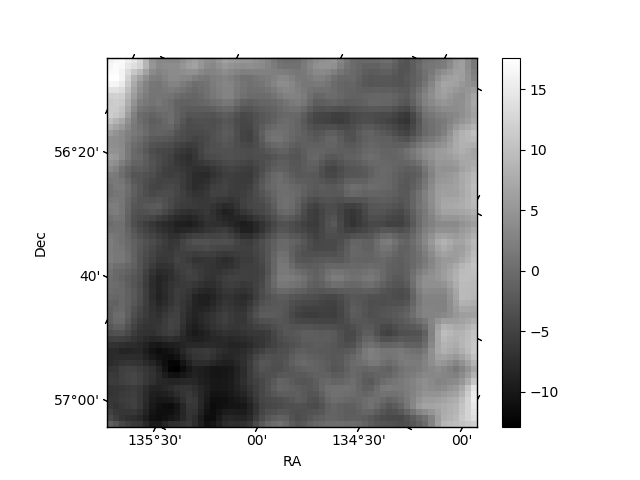
Histogram calculated using DETX and DETY for each event in the final _common_clean file
| Quadrant A | 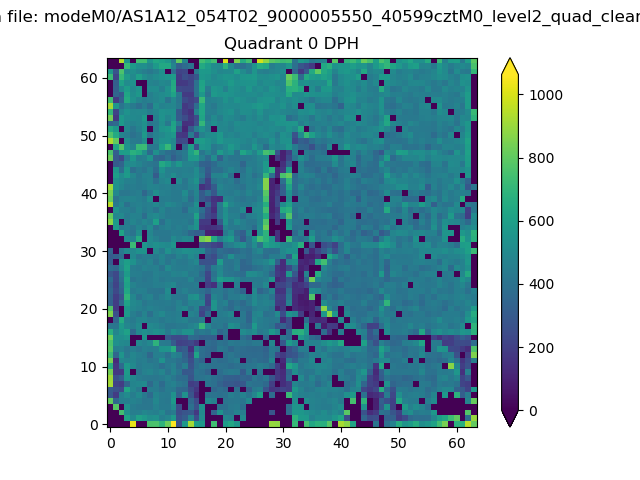 |
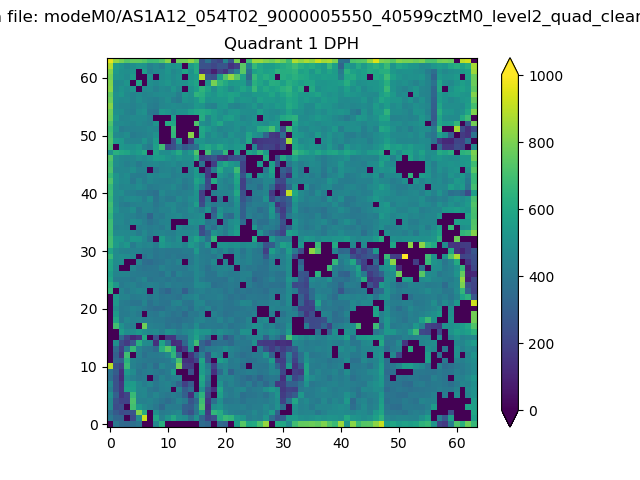 |
Quadrant B |
|---|---|---|---|
| Quadrant D | 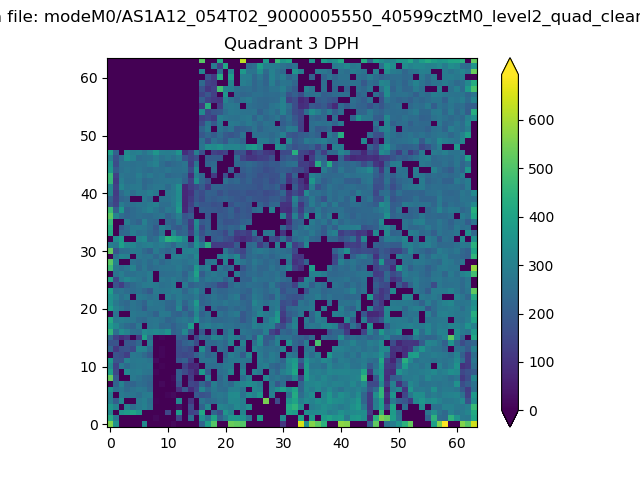 |
 |
Quadrant C |
| Plot type | Count rate plots | Images |
|---|---|---|
| Comparison with Poisson distribution Blue bars denote a histogram of data divided into 1 sec bins. Red curve is a Poisson curve with rate = median count rate of data. |
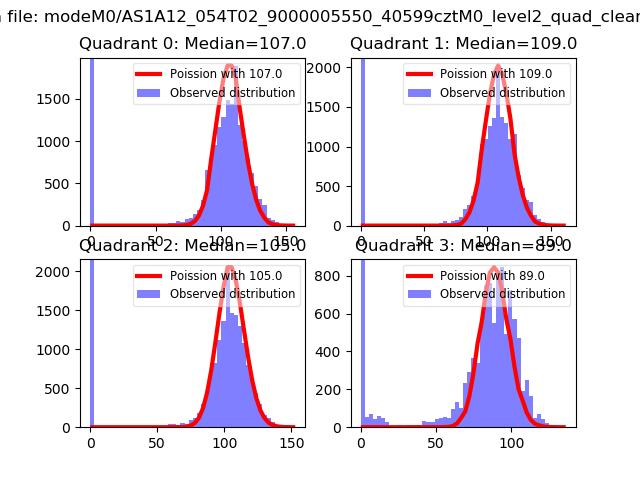 |
 |
| Quadrant-wise count rates Data is divided into 100 sec bins |
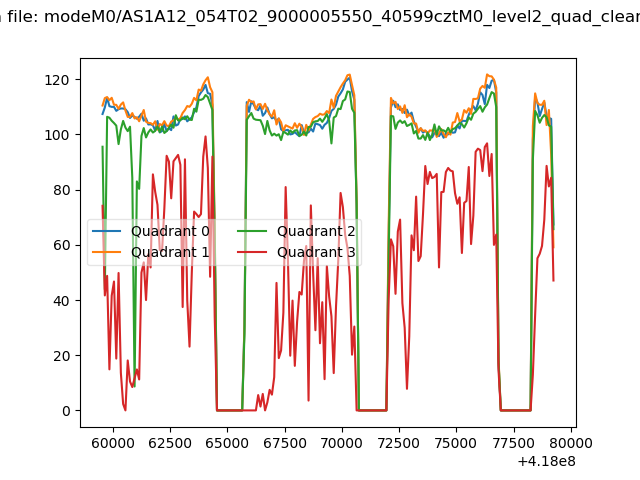 |
|
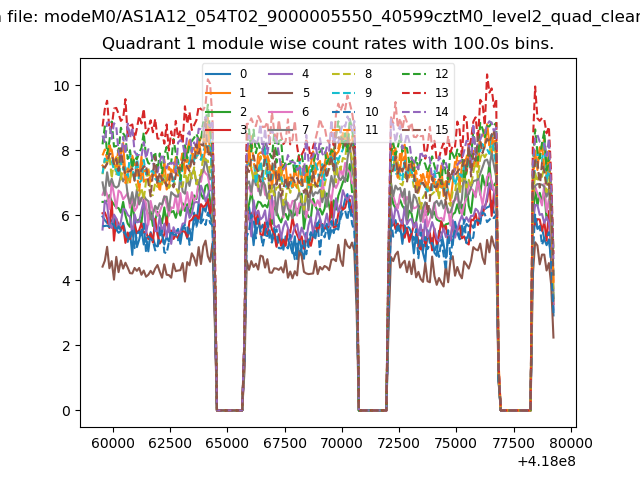
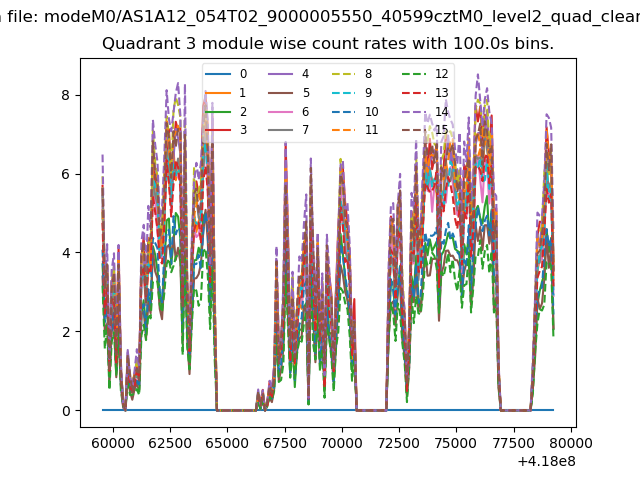
| Module-wise count rates for Quadrant A Data is divided into 100 sec bins |
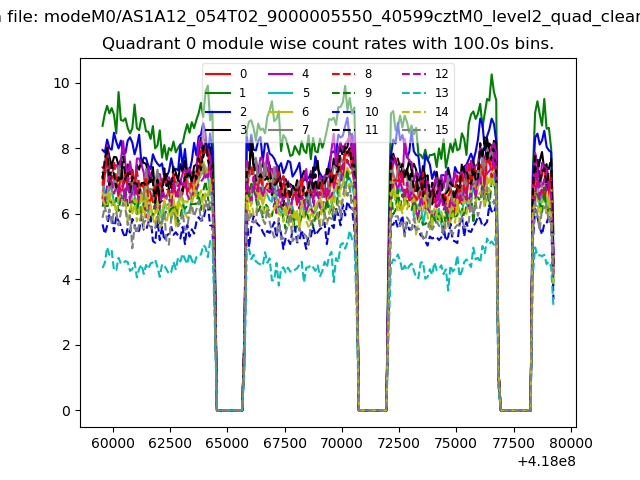 |
 |
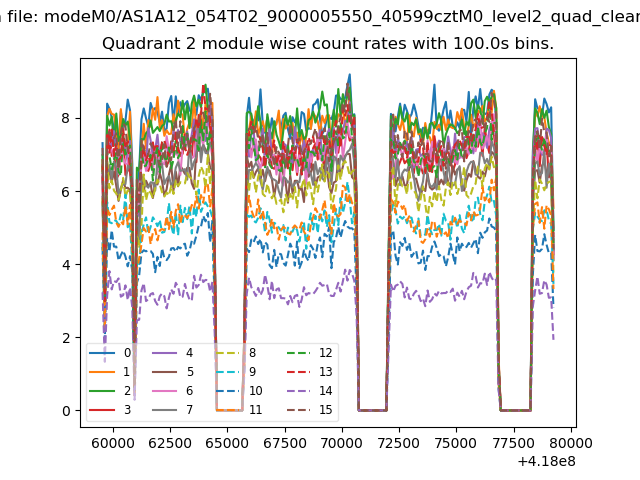
| Module-wise count rates for Quadrant B Data is divided into 100 sec bins |
 |
 |
| Module-wise count rates for Quadrant C Data is divided into 100 sec bins |
 |
 |
| Module-wise count rates for Quadrant D Data is divided into 100 sec bins |
 |
 |
| Parameter | Plot |
|---|---|
| CZT HV Monitor | 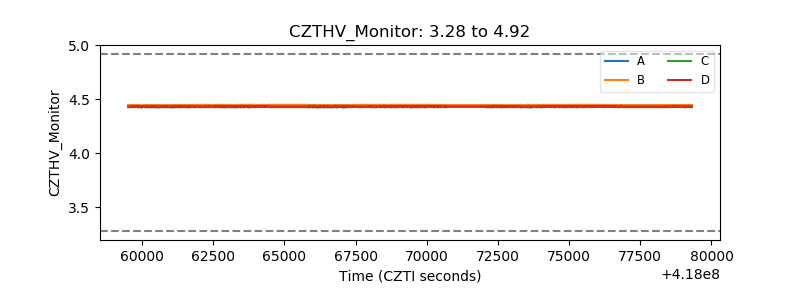 |
| D_VDD | 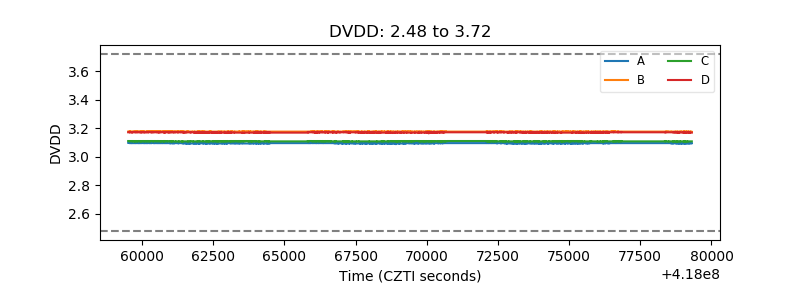 |
| Temperature 1 | 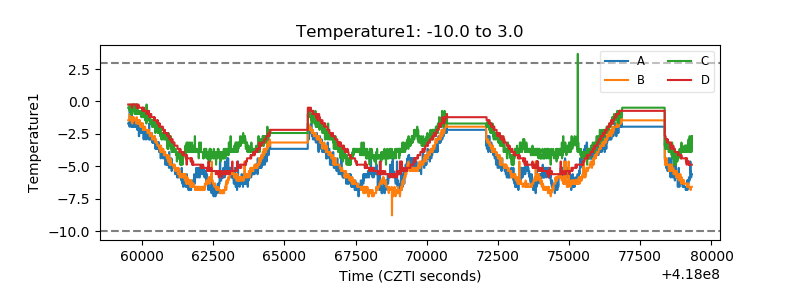 |
| Veto HV Monitor | 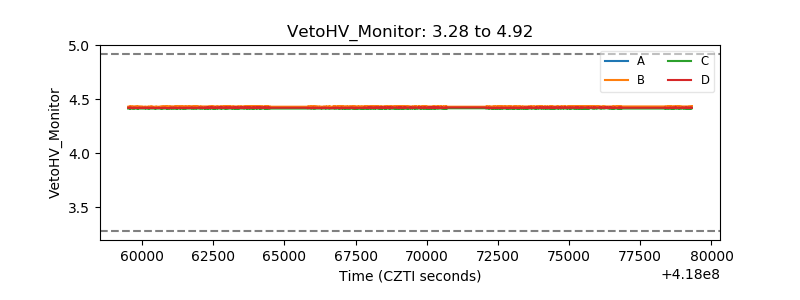 |
| Veto LLD | 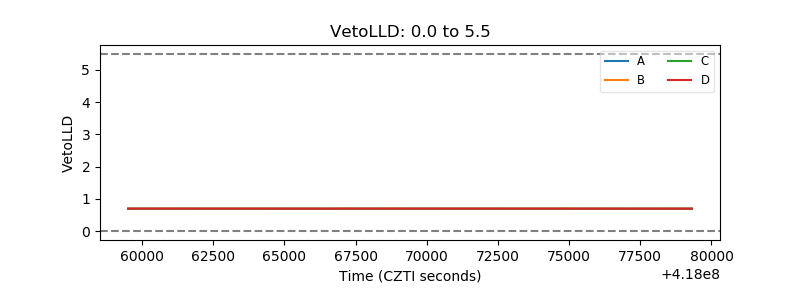 |
| Alpha Counter | 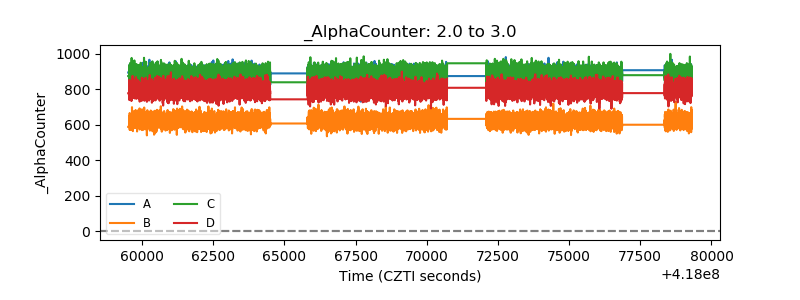 |
| _CPM_Rate | 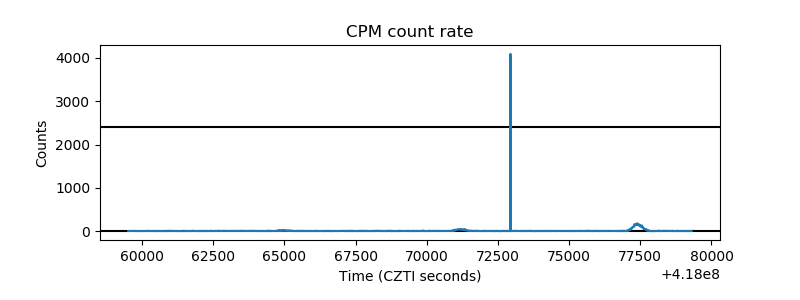 |
| CZT Counter | 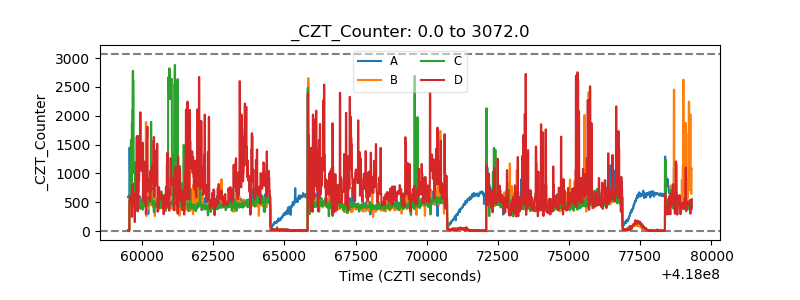 |
| +2.5 Volts monitor | 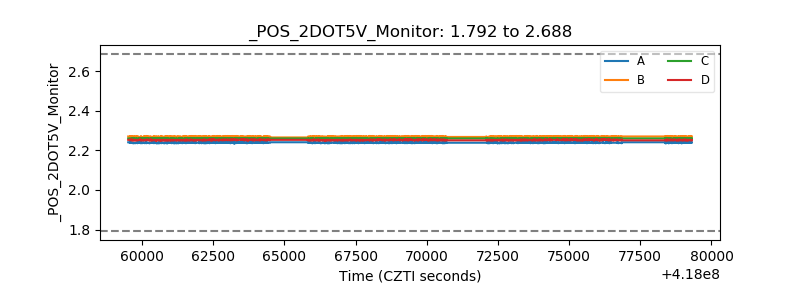 |
| +5 Volts monitor | 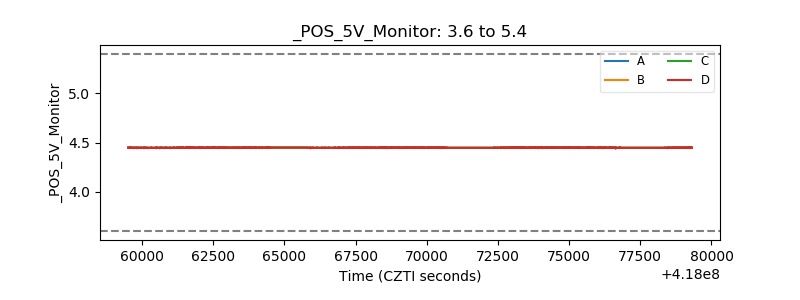 |
| _ROLL_ROT | 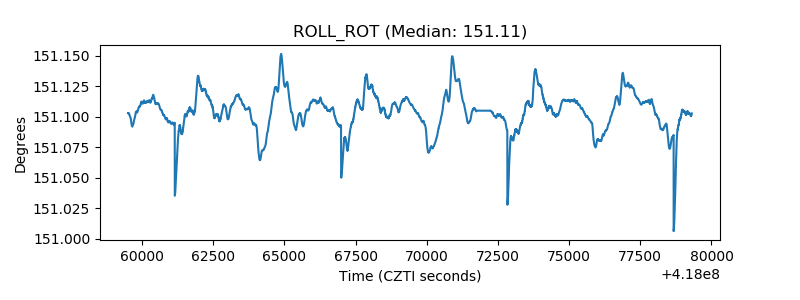 |
| _Roll_DEC | 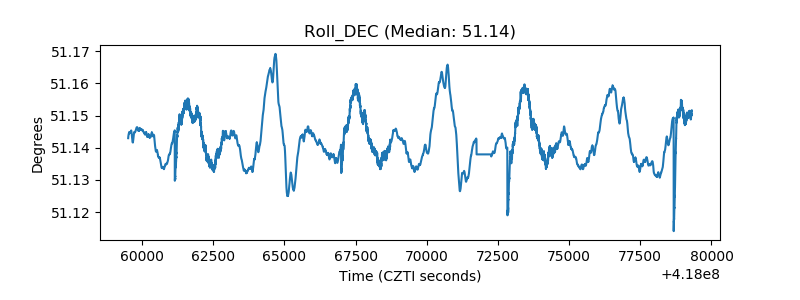 |
| _Roll_RA |  |
| Veto Counter | 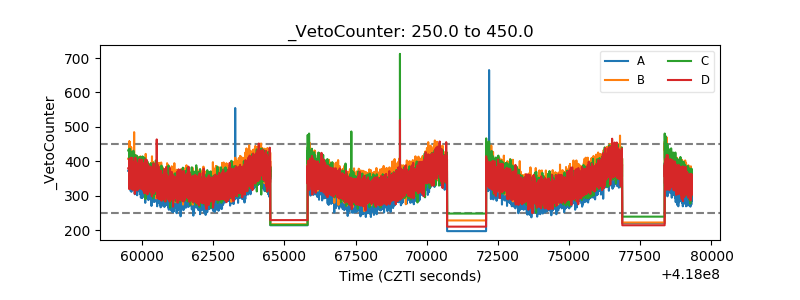 |