| Param | Original file | Final file |
|---|---|---|
| Filename | modeM0/AS1A12_054T02_9000005550_40601cztM0_level2.fits | modeM0/AS1A12_054T02_9000005550_40601cztM0_level2_quad_clean.evt |
| Size (bytes) | 323,133,120 | 87,013,440 |
| Size | 308.2 MB | 83.0 MB |
| Events in quadrant A | 2,819,558 | 590,278 |
| Events in quadrant B | 3,027,760 | 600,426 |
| Events in quadrant C | 2,590,356 | 580,202 |
| Events in quadrant D | 3,100,770 | 484,343 |
| Mode SS | |||
|---|---|---|---|
| Quadrant | BADHDUFLAG | Total packets | Discarded packets |
| A | 0 | 110 | 0 |
| B | 0 | 110 | 0 |
| C | 0 | 110 | 0 |
| D | 0 | 110 | 0 |
| Mode M0 | |||
|---|---|---|---|
| Quadrant | BADHDUFLAG | Total packets | Discarded packets |
| A | 0 | 11850 | 3 |
| B | 0 | 12578 | 2 |
| C | 0 | 11212 | 2 |
| D | 0 | 13084 | 2 |
| Mode M9 | |||
|---|---|---|---|
| Quadrant | BADHDUFLAG | Total packets | Discarded packets |
| A | 0 | 31 | 0 |
| B | 0 | 31 | 0 |
| C | 0 | 31 | 0 |
| D | 0 | 32 | 0 |
| Quadrant | Total seconds | Saturated seconds | Saturation percentage |
|---|---|---|---|
| A | 5421 | 15 | 0.276702% |
| B | 5421 | 71 | 1.309721% |
| C | 5421 | 26 | 0.479616% |
| D | 5421 | 512 | 9.444752% |
Noise dominated data is calculated using 1-second bins in cleaned event files. If a bin has >2000 counts, and if more than 50% of those come from <1% of pixels, then it is considered to be noise-dominated and hence unusable.
| Quadrant | # 1 sec bins | Bins with >0 counts | Bins with >2000 counts | High rate bins dominated by noise | Noise dominated (total time) | Noise dominated (detector-on time) | Marked lightcurve |
|---|---|---|---|---|---|---|---|
| A | 7123 | 5422 | 11 | 11 | 0.15% | 0.20% | 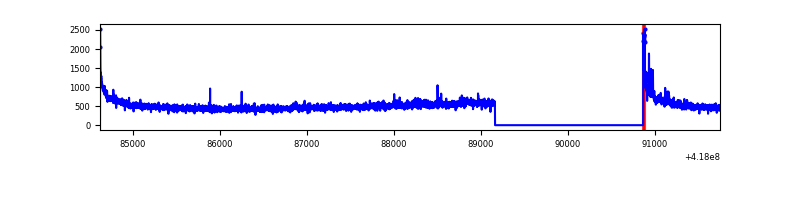 |
| B | 7123 | 5422 | 40 | 40 | 0.56% | 0.74% | 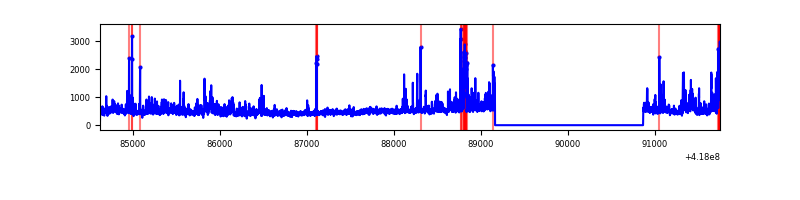 |
| C | 7123 | 5422 | 21 | 21 | 0.29% | 0.39% | 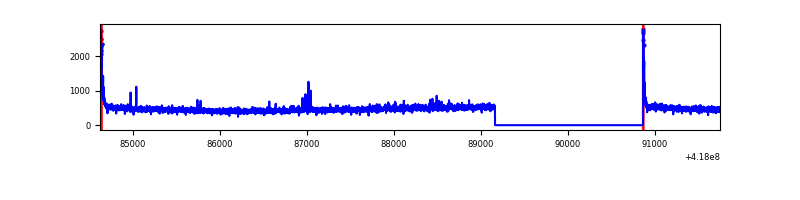 |
| D | 7123 | 5422 | 51 | 51 | 0.72% | 0.94% | 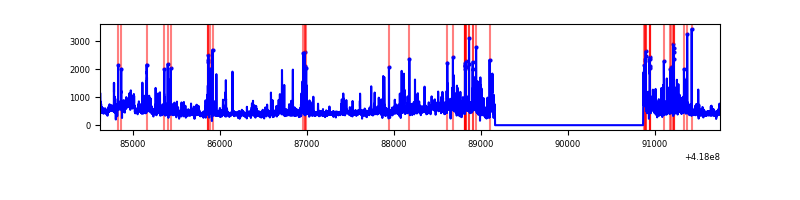 |
Top three noisy pixels from each quadrant. If the there are fewer than three noisy pixels in the level2.evt file, extra rows are filled as -1
| Pixel properties | Quadrant properties | ||||||
|---|---|---|---|---|---|---|---|
| Quadrant | DetID | PixID | Counts | Sigma | Mean | Median | Sigma |
| A | 10 | 83 | 484625 | 4022.16 | 583 | 571 | 120.3 |
| A | 3 | 1 | 51459 | 422.84 | 583 | 571 | 120.3 |
| A | 9 | 191 | 17277 | 138.82 | 583 | 571 | 120.3 |
| B | 0 | 190 | 450926 | 3996.31 | 581 | 564 | 112.7 |
| B | 5 | 255 | 152825 | 1351.1 | 581 | 564 | 112.7 |
| B | 3 | 112 | 99918 | 881.62 | 581 | 564 | 112.7 |
| C | 15 | 214 | 237227 | 1752.6 | 573 | 576 | 135.0 |
| C | 0 | 10 | 85126 | 626.16 | 573 | 576 | 135.0 |
| C | 9 | 187 | 17182 | 122.98 | 573 | 576 | 135.0 |
| D | 12 | 227 | 303656 | 2257.92 | 537 | 521 | 134.3 |
| D | 12 | 191 | 178108 | 1322.77 | 537 | 521 | 134.3 |
| D | 2 | 153 | 116470 | 863.65 | 537 | 521 | 134.3 |
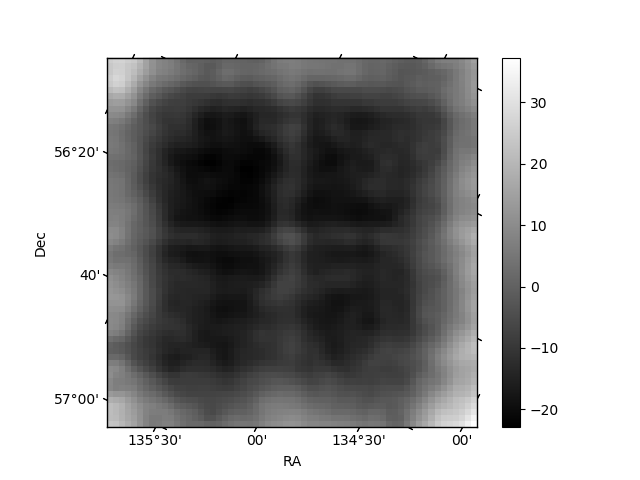
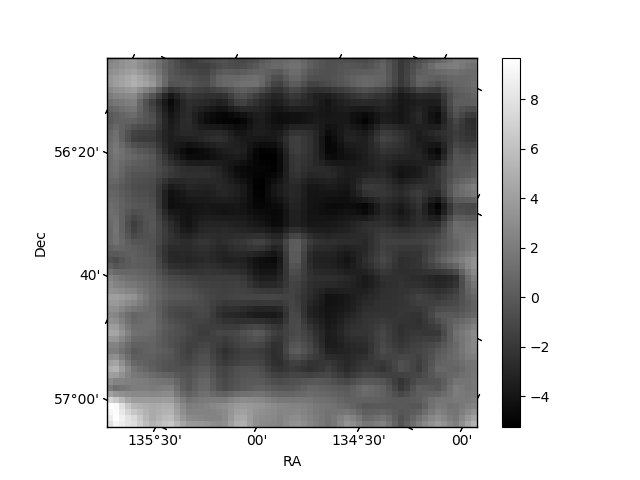
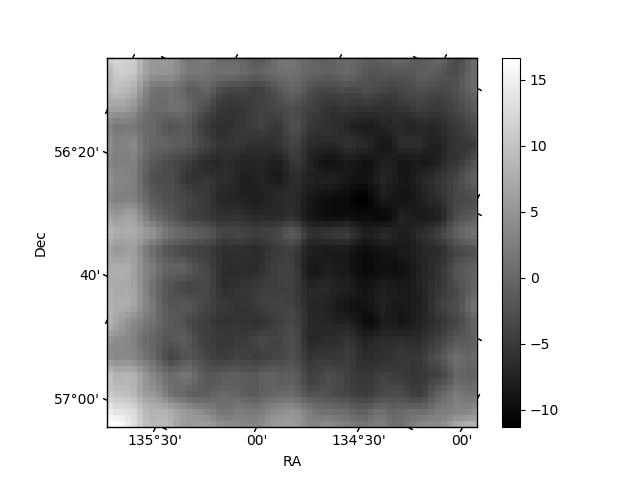
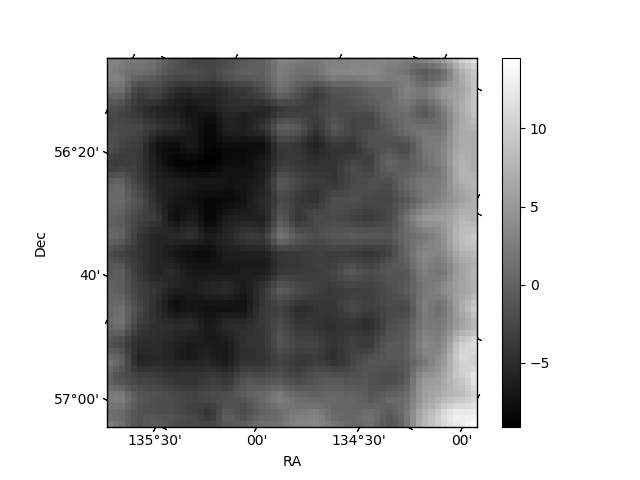
Histogram calculated using DETX and DETY for each event in the final _common_clean file
| Quadrant A | 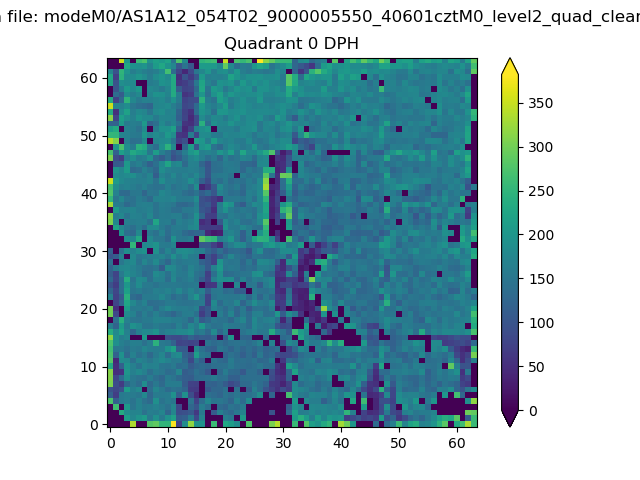 |
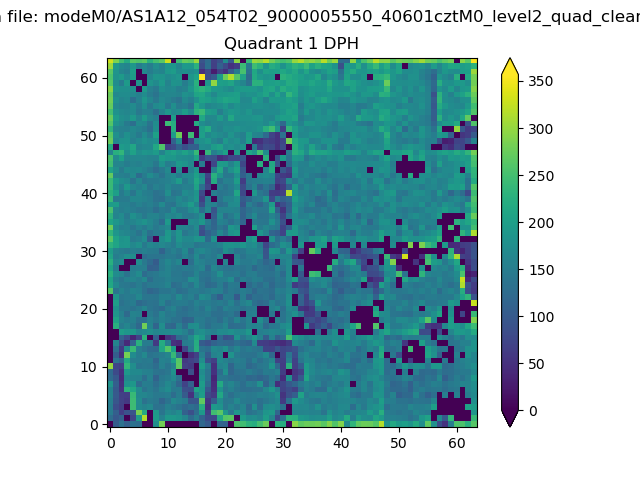 |
Quadrant B |
|---|---|---|---|
| Quadrant D | 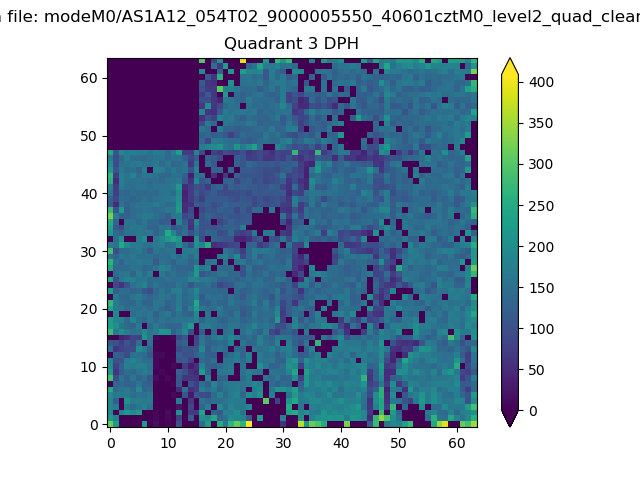 |
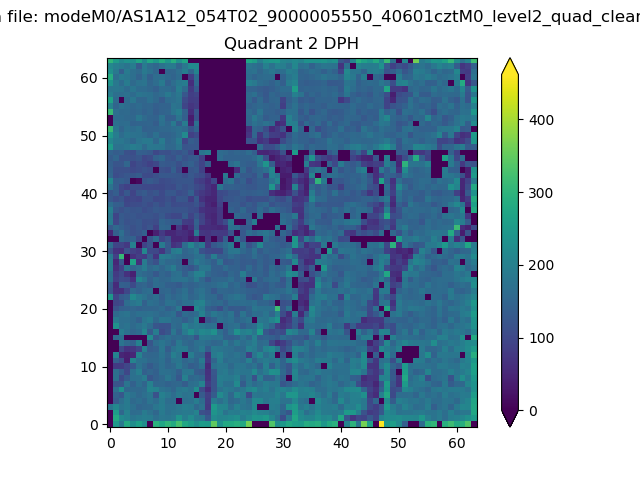 |
Quadrant C |
| Plot type | Count rate plots | Images |
|---|---|---|
| Comparison with Poisson distribution Blue bars denote a histogram of data divided into 1 sec bins. Red curve is a Poisson curve with rate = median count rate of data. |
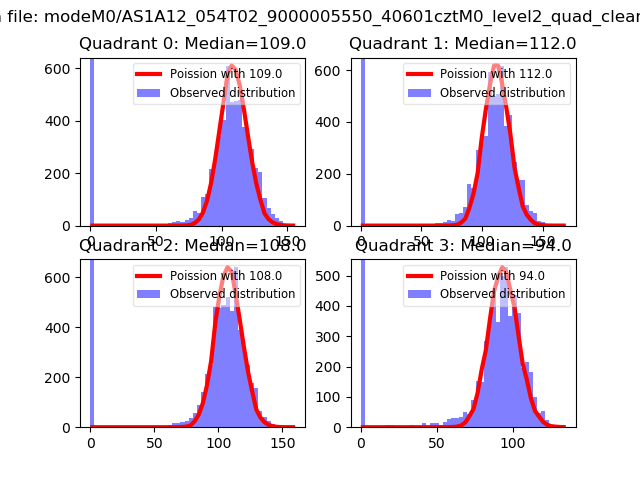 |
 |
| Quadrant-wise count rates Data is divided into 100 sec bins |
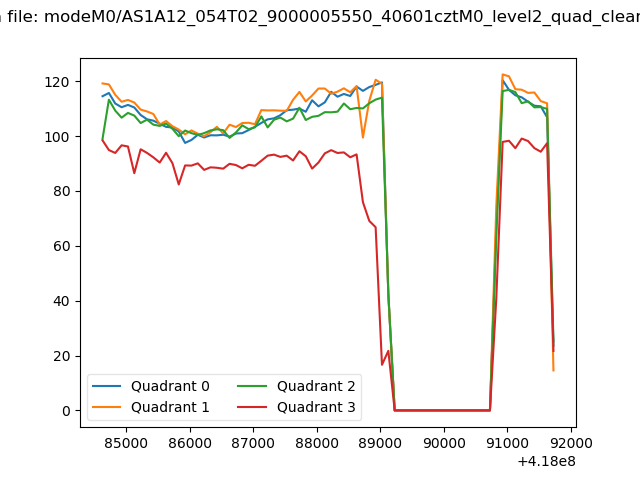 |
|
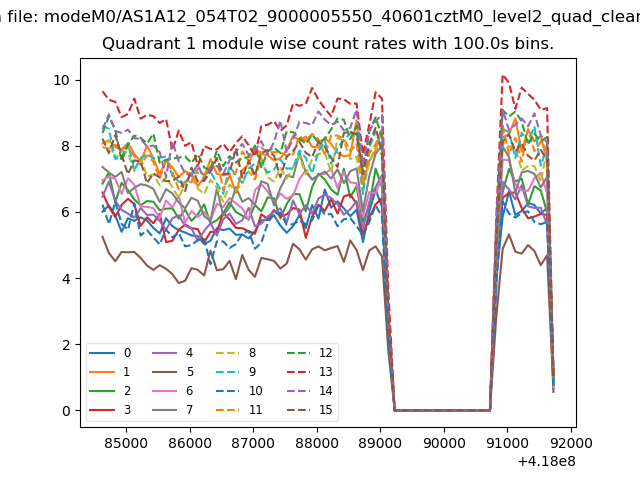
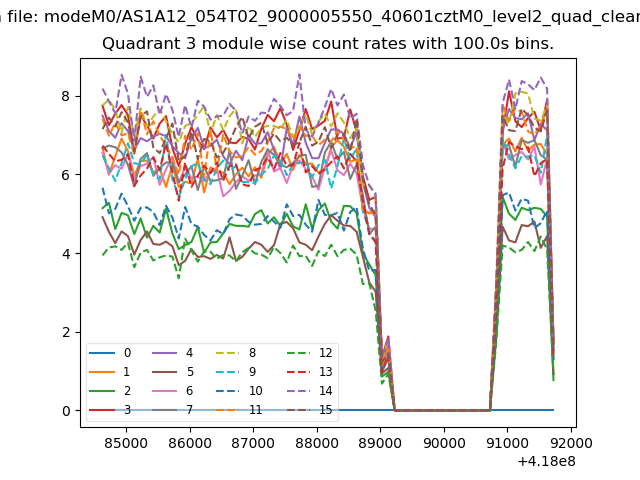
| Module-wise count rates for Quadrant A Data is divided into 100 sec bins |
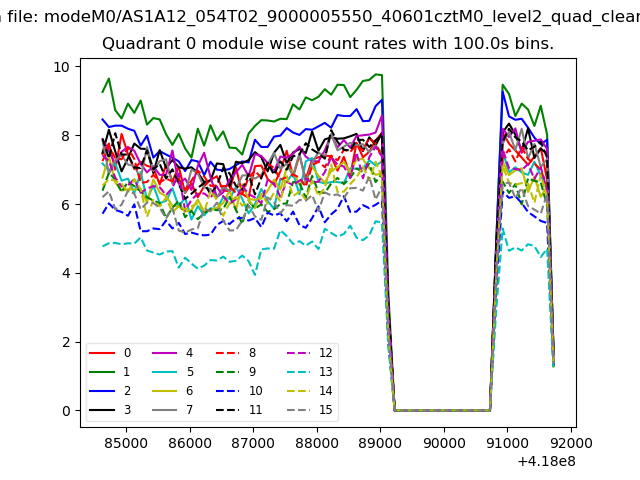 |
 |
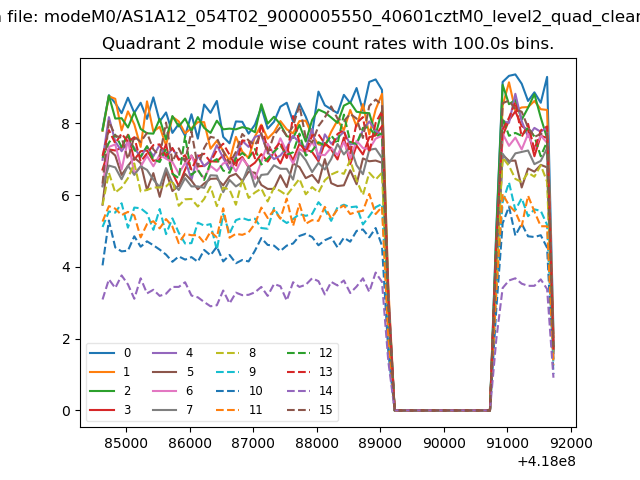
| Module-wise count rates for Quadrant B Data is divided into 100 sec bins |
 |
 |
| Module-wise count rates for Quadrant C Data is divided into 100 sec bins |
 |
 |
| Module-wise count rates for Quadrant D Data is divided into 100 sec bins |
 |
 |
| Parameter | Plot |
|---|---|
| CZT HV Monitor | 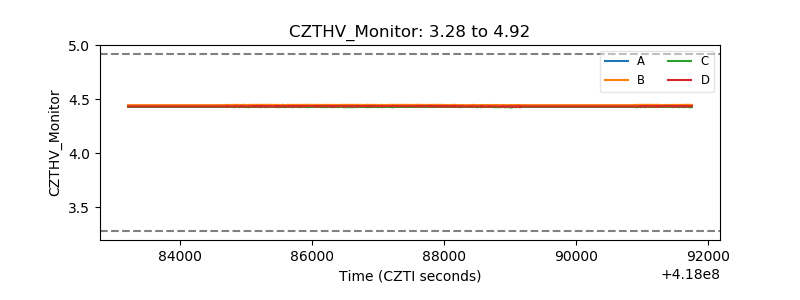 |
| D_VDD | 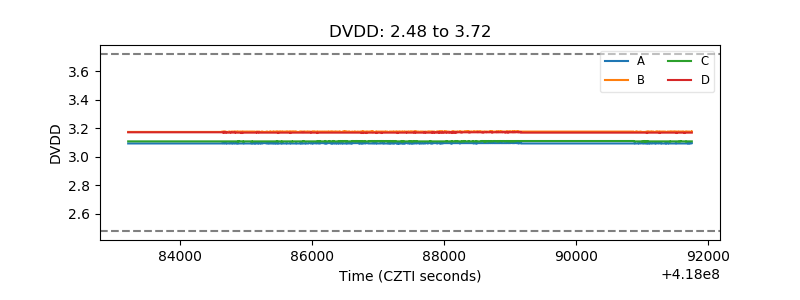 |
| Temperature 1 | 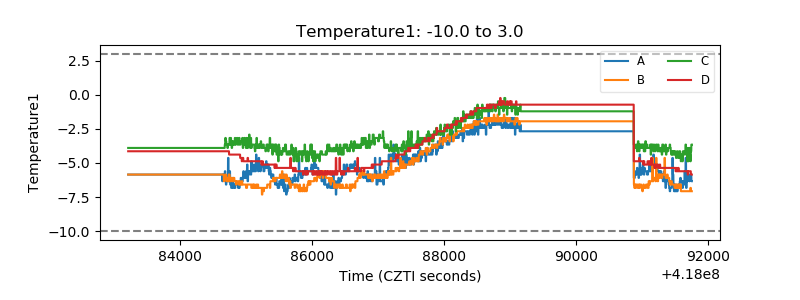 |
| Veto HV Monitor | 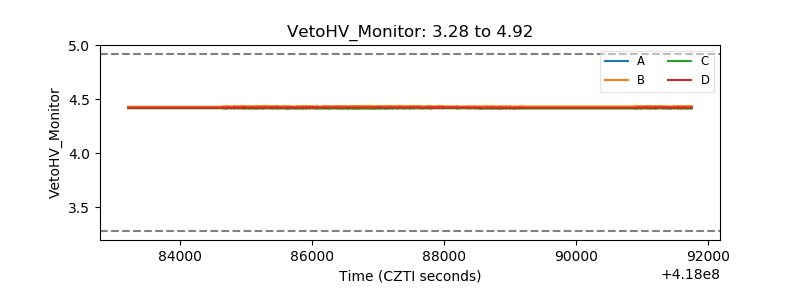 |
| Veto LLD | 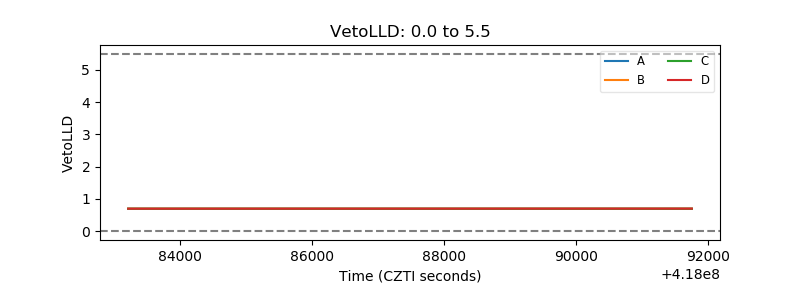 |
| Alpha Counter | 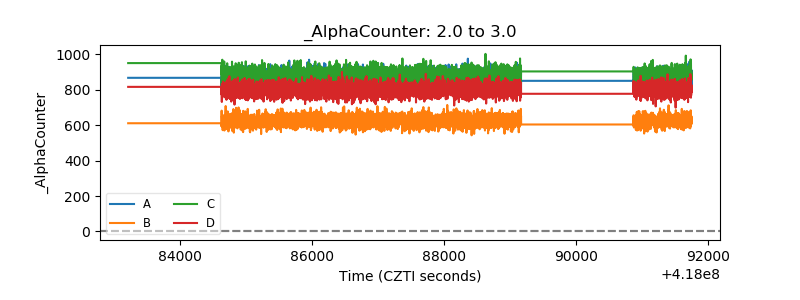 |
| _CPM_Rate | 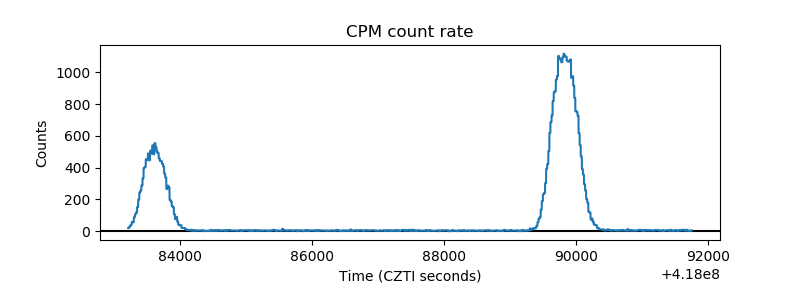 |
| CZT Counter | 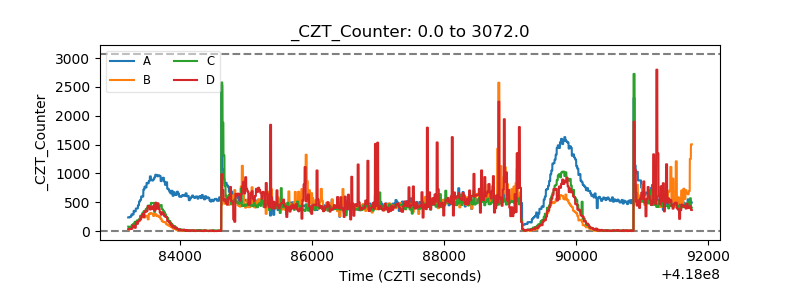 |
| +2.5 Volts monitor | 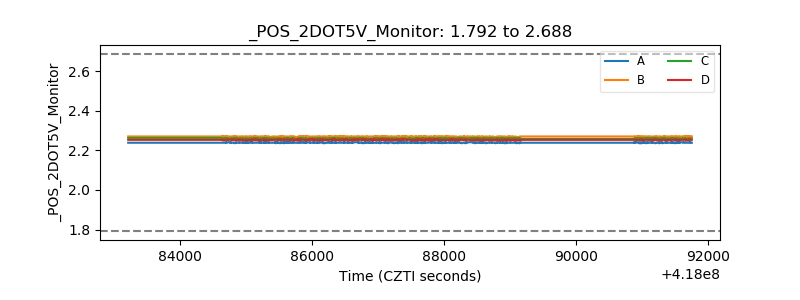 |
| +5 Volts monitor | 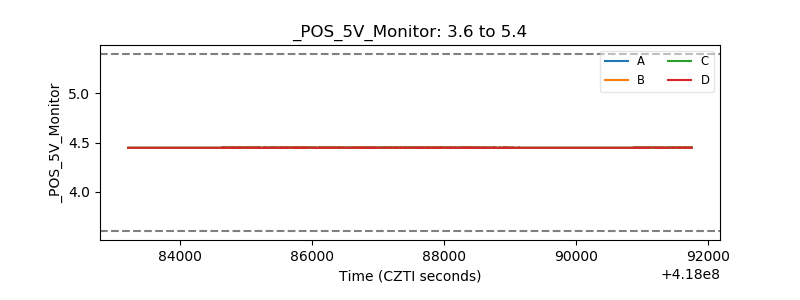 |
| _ROLL_ROT | 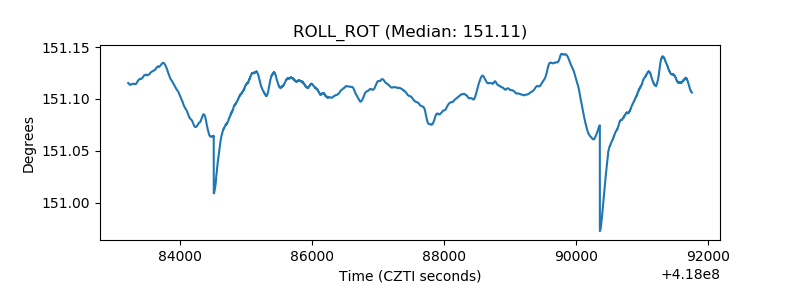 |
| _Roll_DEC | 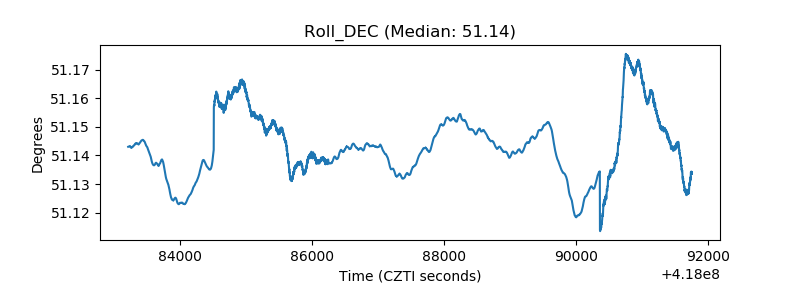 |
| _Roll_RA | 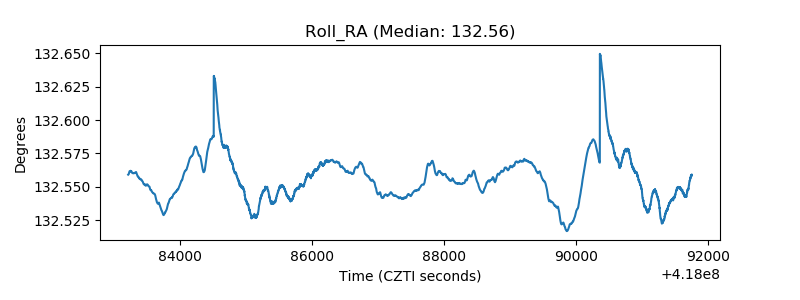 |
| Veto Counter | 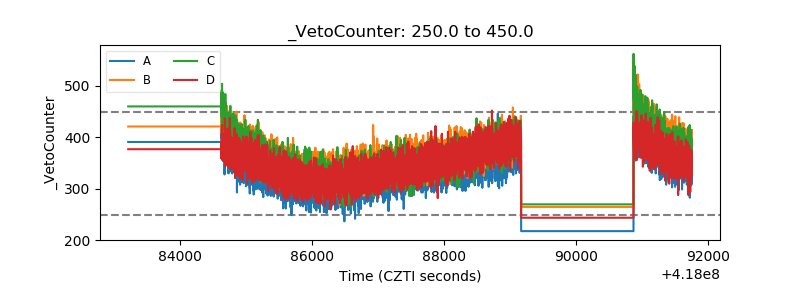 |