| Param | Original file | Final file |
|---|---|---|
| Filename | modeM0/AS1A12_054T02_9000005550_40603cztM0_level2.fits | modeM0/AS1A12_054T02_9000005550_40603cztM0_level2_quad_clean.evt |
| Size (bytes) | 322,300,800 | 86,739,840 |
| Size | 307.4 MB | 82.7 MB |
| Events in quadrant A | 2,818,111 | 593,771 |
| Events in quadrant B | 3,069,460 | 605,685 |
| Events in quadrant C | 2,616,719 | 582,801 |
| Events in quadrant D | 3,013,300 | 473,919 |
| Mode SS | |||
|---|---|---|---|
| Quadrant | BADHDUFLAG | Total packets | Discarded packets |
| A | 0 | 108 | 0 |
| B | 0 | 108 | 0 |
| C | 0 | 108 | 0 |
| D | 0 | 108 | 0 |
| Mode M0 | |||
|---|---|---|---|
| Quadrant | BADHDUFLAG | Total packets | Discarded packets |
| A | 0 | 11637 | 3 |
| B | 0 | 12707 | 2 |
| C | 0 | 11115 | 2 |
| D | 0 | 12588 | 2 |
| Mode M9 | |||
|---|---|---|---|
| Quadrant | BADHDUFLAG | Total packets | Discarded packets |
| A | 0 | 36 | 0 |
| B | 0 | 36 | 0 |
| C | 0 | 36 | 0 |
| D | 0 | 36 | 0 |
| Quadrant | Total seconds | Saturated seconds | Saturation percentage |
|---|---|---|---|
| A | 5293 | 19 | 0.358965% |
| B | 5293 | 84 | 1.587002% |
| C | 5293 | 22 | 0.415643% |
| D | 5293 | 660 | 12.469299% |
Noise dominated data is calculated using 1-second bins in cleaned event files. If a bin has >2000 counts, and if more than 50% of those come from <1% of pixels, then it is considered to be noise-dominated and hence unusable.
| Quadrant | # 1 sec bins | Bins with >0 counts | Bins with >2000 counts | High rate bins dominated by noise | Noise dominated (total time) | Noise dominated (detector-on time) | Marked lightcurve |
|---|---|---|---|---|---|---|---|
| A | 8849 | 5295 | 10 | 10 | 0.11% | 0.19% | 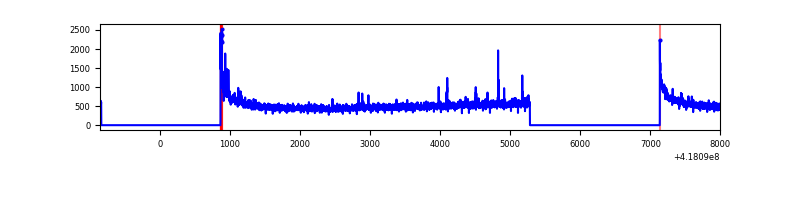 |
| B | 8849 | 5295 | 64 | 64 | 0.72% | 1.21% | 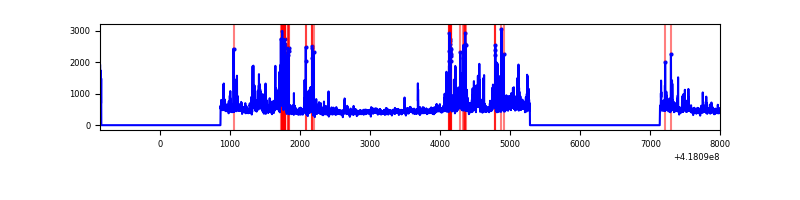 |
| C | 8849 | 5295 | 18 | 18 | 0.20% | 0.34% | 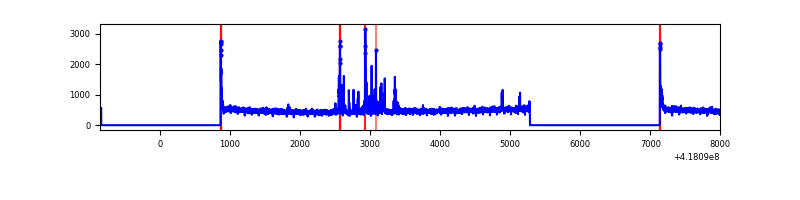 |
| D | 8849 | 5295 | 77 | 77 | 0.87% | 1.45% | 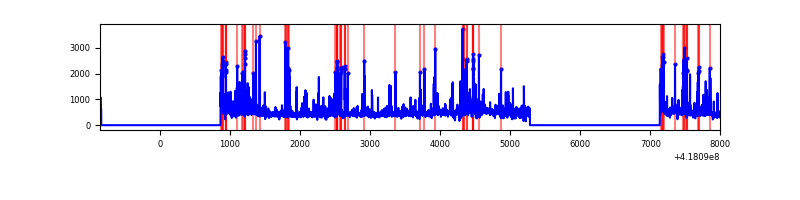 |
Top three noisy pixels from each quadrant. If the there are fewer than three noisy pixels in the level2.evt file, extra rows are filled as -1
| Pixel properties | Quadrant properties | ||||||
|---|---|---|---|---|---|---|---|
| Quadrant | DetID | PixID | Counts | Sigma | Mean | Median | Sigma |
| A | 10 | 83 | 484466 | 4046.45 | 580 | 569 | 119.6 |
| A | 3 | 1 | 47317 | 390.92 | 580 | 569 | 119.6 |
| A | 12 | 189 | 22306 | 181.77 | 580 | 569 | 119.6 |
| B | 0 | 190 | 515240 | 4637.93 | 576 | 559 | 111.0 |
| B | 5 | 255 | 211315 | 1899.18 | 576 | 559 | 111.0 |
| B | 3 | 112 | 49276 | 439.0 | 576 | 559 | 111.0 |
| C | 15 | 214 | 234601 | 1772.43 | 565 | 568 | 132.0 |
| C | 14 | 254 | 118087 | 890.02 | 565 | 568 | 132.0 |
| C | 0 | 10 | 52133 | 390.52 | 565 | 568 | 132.0 |
| D | 12 | 227 | 294372 | 2228.93 | 525 | 508 | 131.8 |
| D | 12 | 191 | 193114 | 1460.89 | 525 | 508 | 131.8 |
| D | 2 | 249 | 178586 | 1350.7 | 525 | 508 | 131.8 |
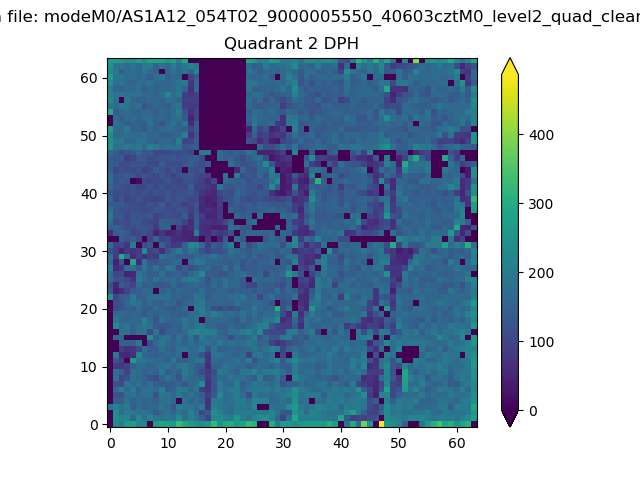
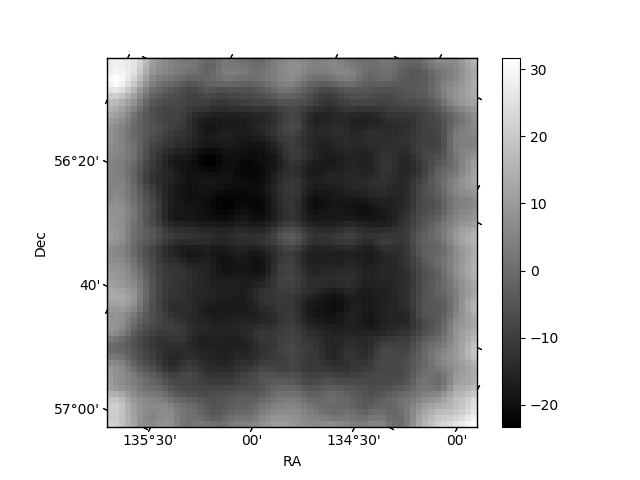
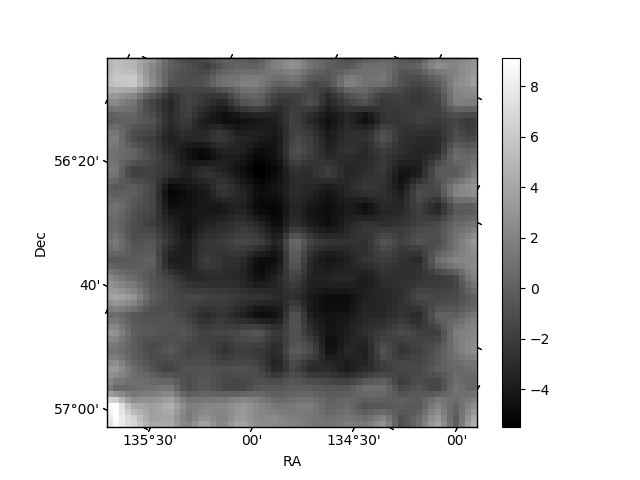
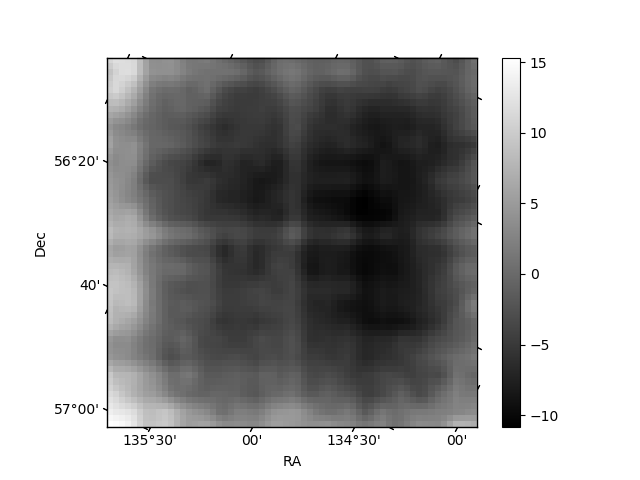
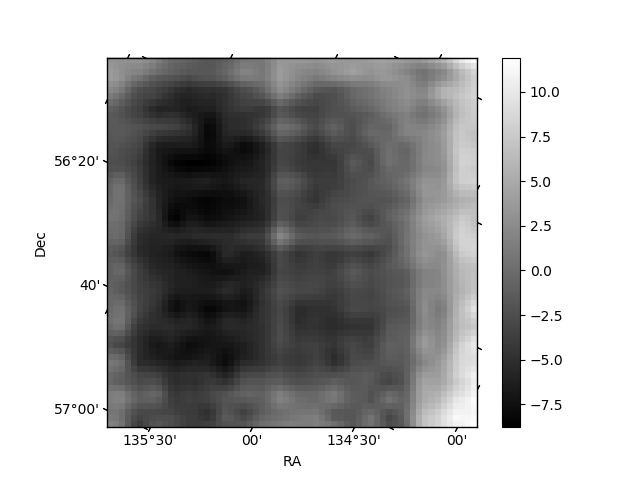
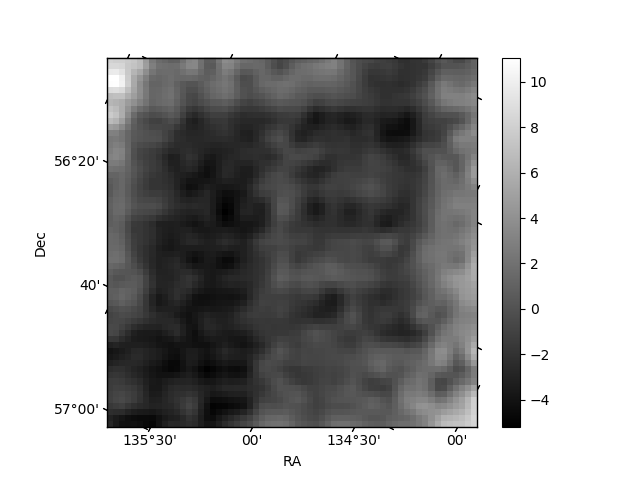
Histogram calculated using DETX and DETY for each event in the final _common_clean file
| Quadrant A | 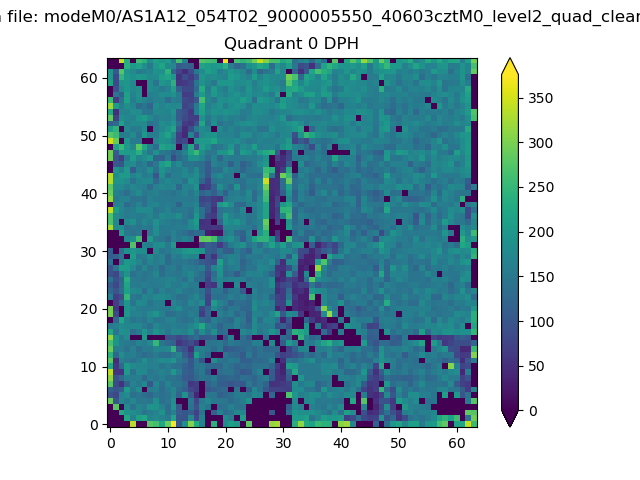 |
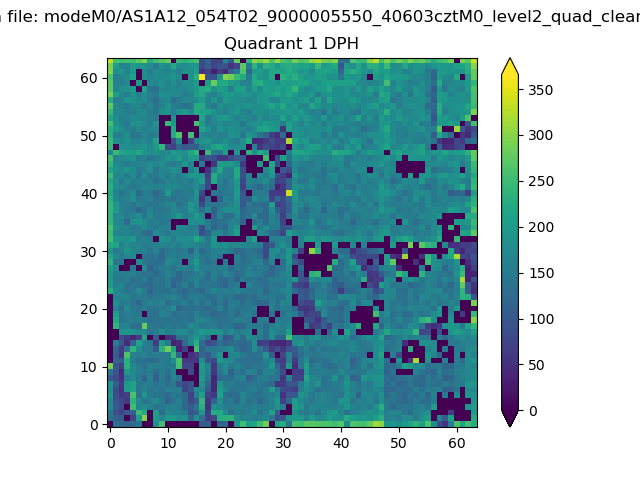 |
Quadrant B |
|---|---|---|---|
| Quadrant D | 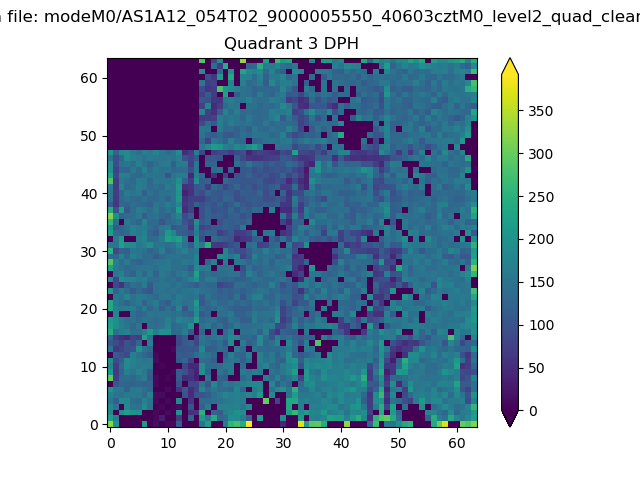 |
 |
Quadrant C |
| Plot type | Count rate plots | Images |
|---|---|---|
| Comparison with Poisson distribution Blue bars denote a histogram of data divided into 1 sec bins. Red curve is a Poisson curve with rate = median count rate of data. |
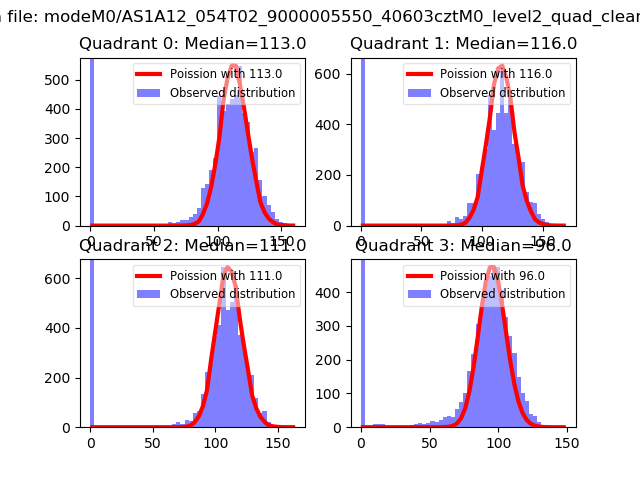 |
 |
| Quadrant-wise count rates Data is divided into 100 sec bins |
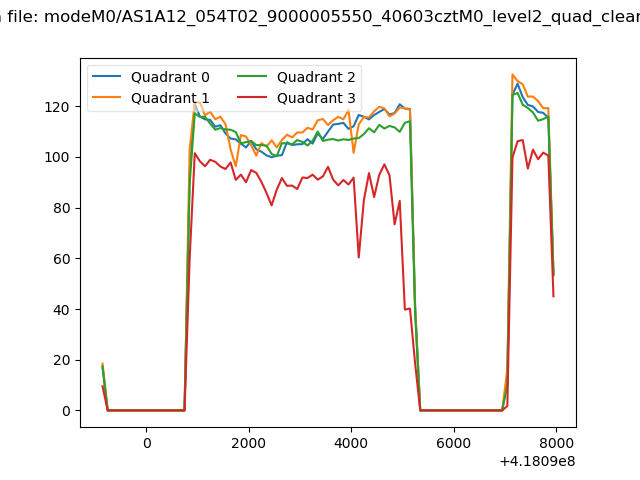 |
|
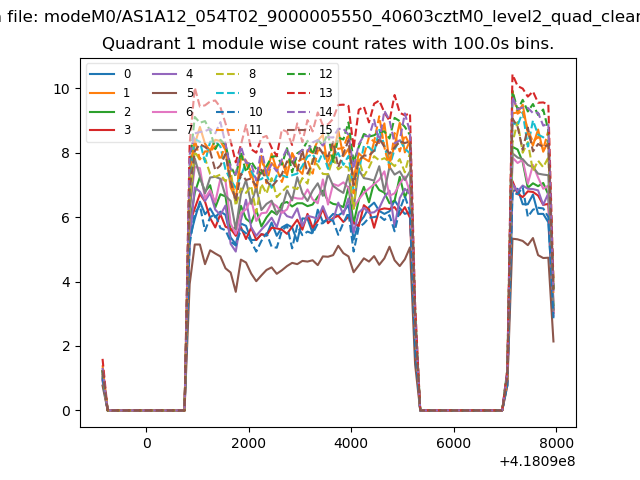
| Module-wise count rates for Quadrant A Data is divided into 100 sec bins |
 |
 |
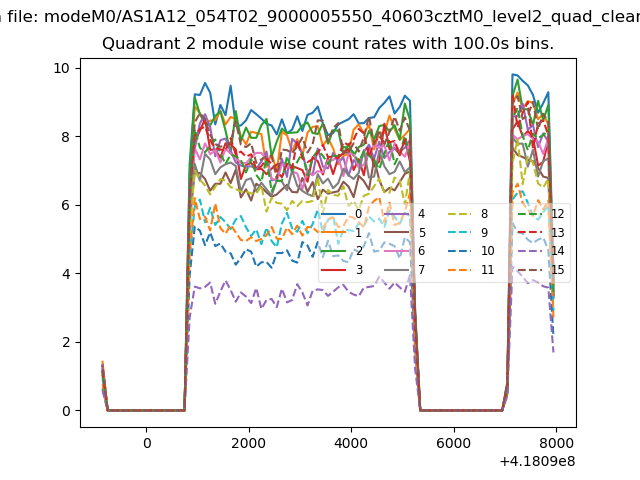
| Module-wise count rates for Quadrant B Data is divided into 100 sec bins |
 |
 |
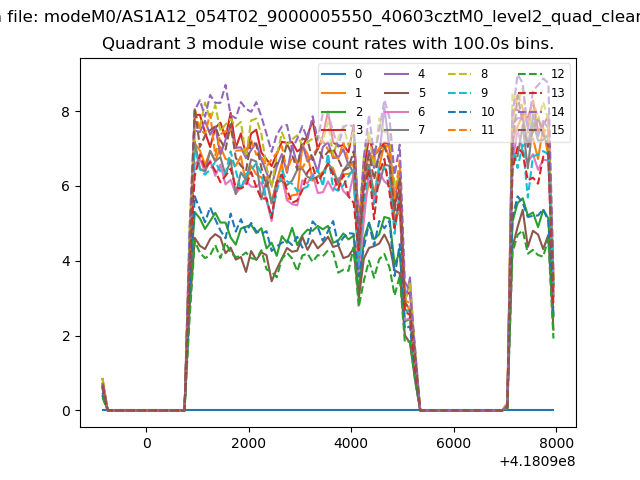
| Module-wise count rates for Quadrant C Data is divided into 100 sec bins |
 |
 |
| Module-wise count rates for Quadrant D Data is divided into 100 sec bins |
 |
 |
| Parameter | Plot |
|---|---|
| CZT HV Monitor | 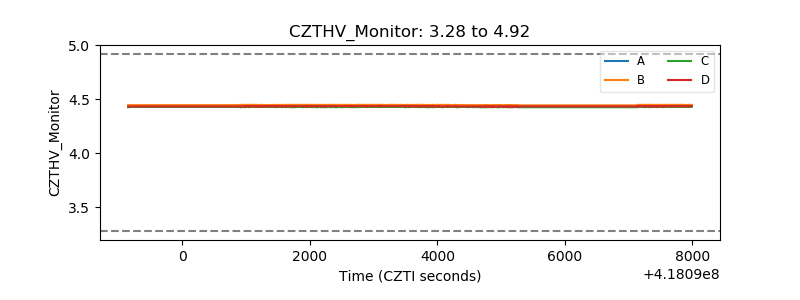 |
| D_VDD | 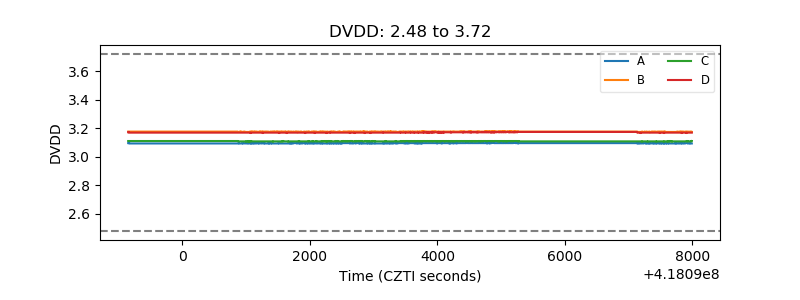 |
| Temperature 1 | 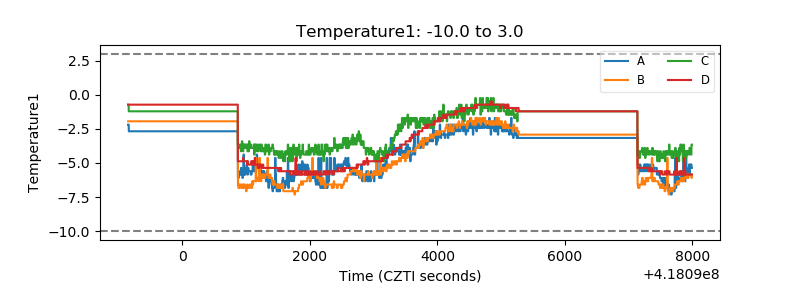 |
| Veto HV Monitor | 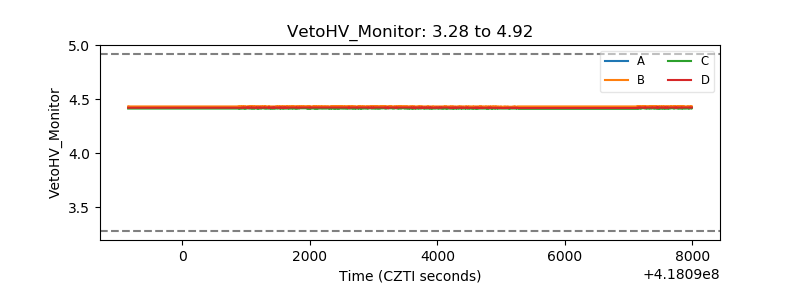 |
| Veto LLD | 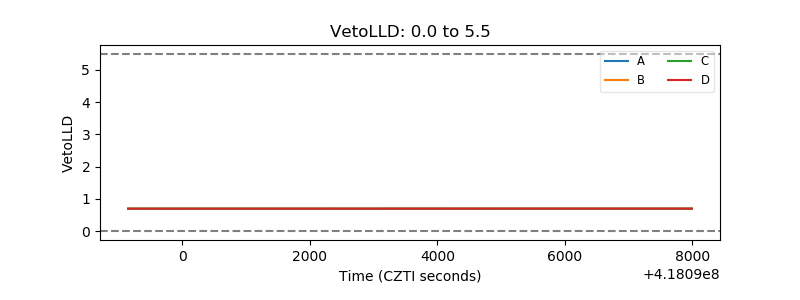 |
| Alpha Counter | 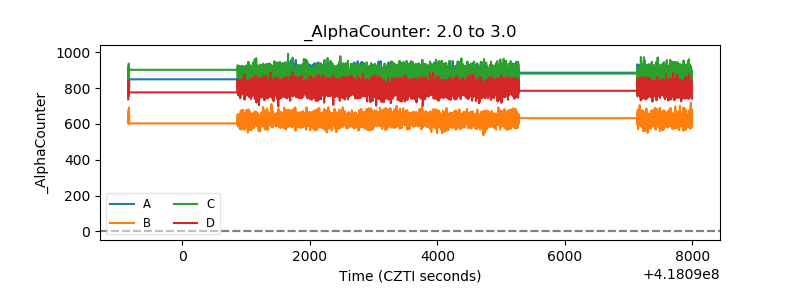 |
| _CPM_Rate | 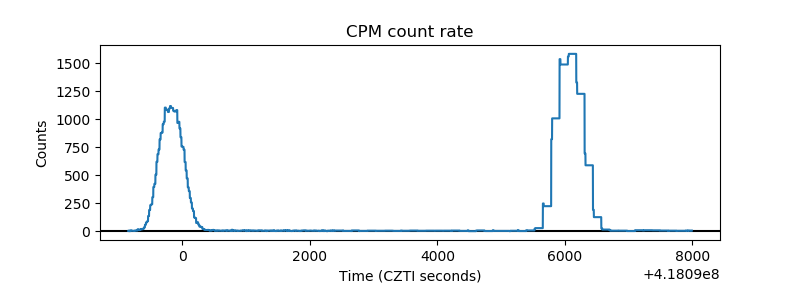 |
| CZT Counter | 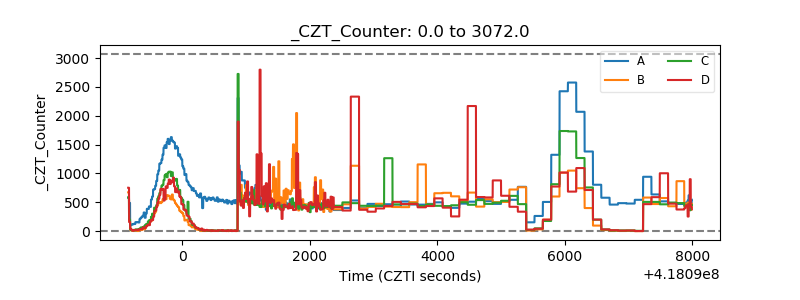 |
| +2.5 Volts monitor | 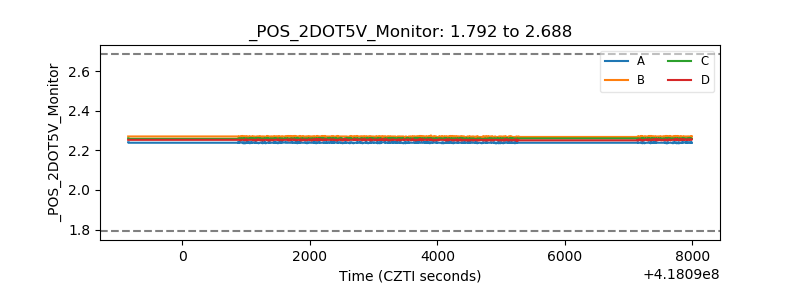 |
| +5 Volts monitor | 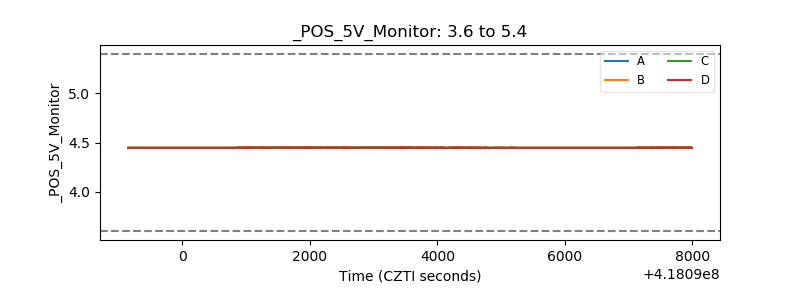 |
| _ROLL_ROT | 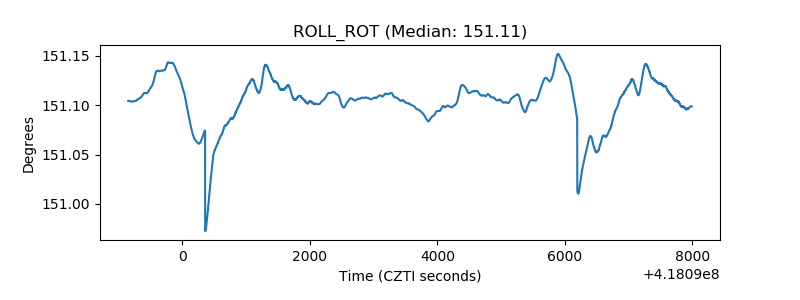 |
| _Roll_DEC | 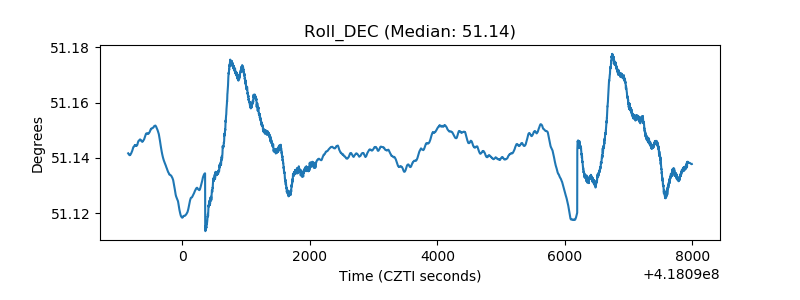 |
| _Roll_RA | 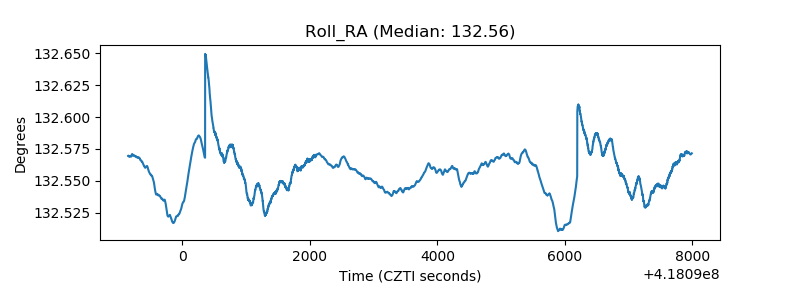 |
| Veto Counter | 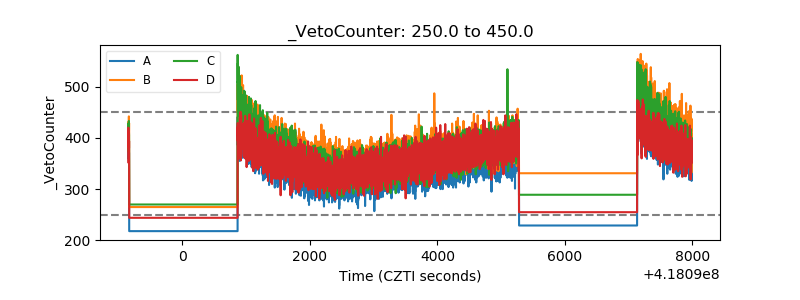 |