| Param | Original file | Final file |
|---|---|---|
| Filename | modeM0/AS1A12_054T02_9000005550_40604cztM0_level2.fits | modeM0/AS1A12_054T02_9000005550_40604cztM0_level2_quad_clean.evt |
| Size (bytes) | 336,775,680 | 90,400,320 |
| Size | 321.2 MB | 86.2 MB |
| Events in quadrant A | 2,930,237 | 637,290 |
| Events in quadrant B | 3,354,633 | 648,144 |
| Events in quadrant C | 2,774,383 | 617,765 |
| Events in quadrant D | 2,982,163 | 452,974 |
| Mode SS | |||
|---|---|---|---|
| Quadrant | BADHDUFLAG | Total packets | Discarded packets |
| A | 0 | 114 | 0 |
| B | 0 | 114 | 0 |
| C | 0 | 114 | 0 |
| D | 0 | 114 | 0 |
| Mode M0 | |||
|---|---|---|---|
| Quadrant | BADHDUFLAG | Total packets | Discarded packets |
| A | 0 | 11907 | 3 |
| B | 0 | 13549 | 2 |
| C | 0 | 11552 | 2 |
| D | 0 | 12679 | 2 |
| Mode M9 | |||
|---|---|---|---|
| Quadrant | BADHDUFLAG | Total packets | Discarded packets |
| A | 0 | 38 | 0 |
| B | 0 | 38 | 0 |
| C | 0 | 38 | 0 |
| D | 0 | 38 | 0 |
| Quadrant | Total seconds | Saturated seconds | Saturation percentage |
|---|---|---|---|
| A | 5441 | 17 | 0.312443% |
| B | 5441 | 132 | 2.426025% |
| C | 5441 | 39 | 0.716780% |
| D | 5441 | 1195 | 21.962874% |
Noise dominated data is calculated using 1-second bins in cleaned event files. If a bin has >2000 counts, and if more than 50% of those come from <1% of pixels, then it is considered to be noise-dominated and hence unusable.
| Quadrant | # 1 sec bins | Bins with >0 counts | Bins with >2000 counts | High rate bins dominated by noise | Noise dominated (total time) | Noise dominated (detector-on time) | Marked lightcurve |
|---|---|---|---|---|---|---|---|
| A | 9267 | 5443 | 3 | 3 | 0.03% | 0.06% | 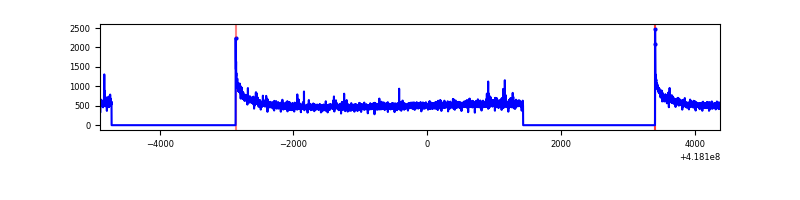 |
| B | 9267 | 5443 | 80 | 80 | 0.86% | 1.47% | 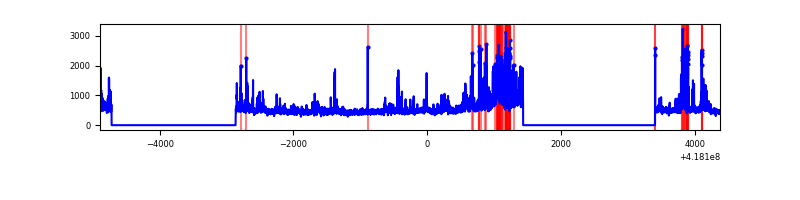 |
| C | 9267 | 5443 | 33 | 33 | 0.36% | 0.61% | 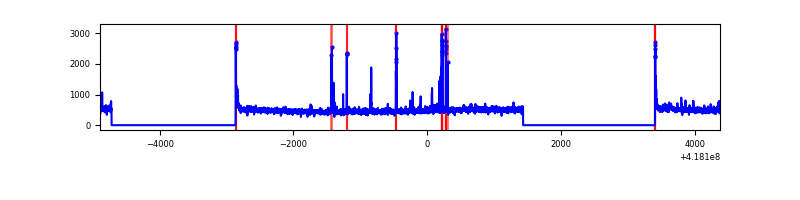 |
| D | 9267 | 5442 | 92 | 92 | 0.99% | 1.69% | 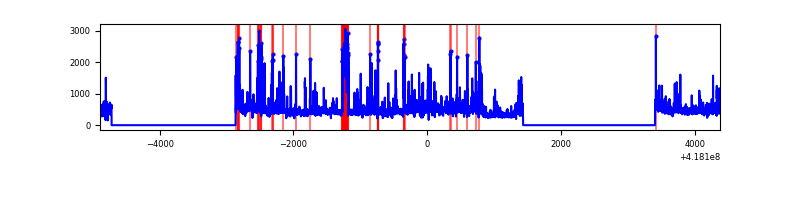 |
Top three noisy pixels from each quadrant. If the there are fewer than three noisy pixels in the level2.evt file, extra rows are filled as -1
| Pixel properties | Quadrant properties | ||||||
|---|---|---|---|---|---|---|---|
| Quadrant | DetID | PixID | Counts | Sigma | Mean | Median | Sigma |
| A | 10 | 83 | 496758 | 3971.78 | 616 | 602 | 124.9 |
| A | 3 | 1 | 19299 | 149.67 | 616 | 602 | 124.9 |
| A | 2 | 79 | 17070 | 131.83 | 616 | 602 | 124.9 |
| B | 0 | 190 | 770127 | 6561.4 | 609 | 592 | 117.3 |
| B | 3 | 112 | 122732 | 1041.42 | 609 | 592 | 117.3 |
| B | 4 | 171 | 29872 | 249.65 | 609 | 592 | 117.3 |
| C | 15 | 214 | 238891 | 1731.05 | 594 | 598 | 137.7 |
| C | 14 | 254 | 131596 | 951.62 | 594 | 598 | 137.7 |
| C | 0 | 10 | 47349 | 339.62 | 594 | 598 | 137.7 |
| D | 12 | 191 | 277562 | 2218.63 | 506 | 492 | 124.9 |
| D | 12 | 227 | 257321 | 2056.55 | 506 | 492 | 124.9 |
| D | 2 | 249 | 134061 | 1069.55 | 506 | 492 | 124.9 |
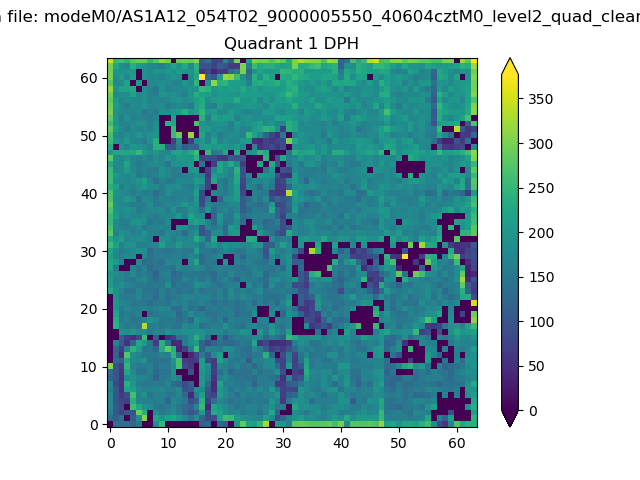
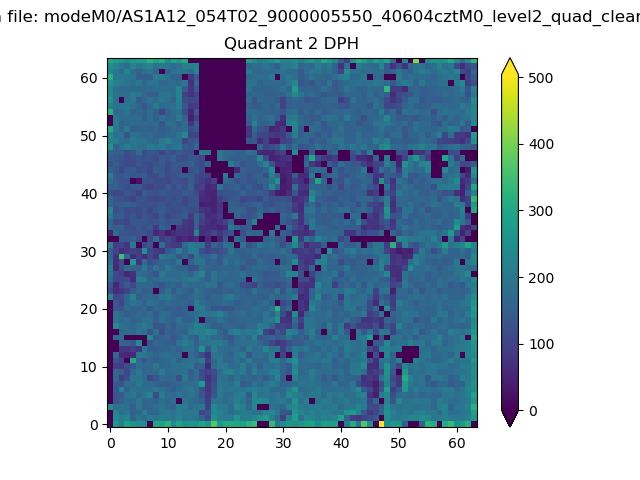
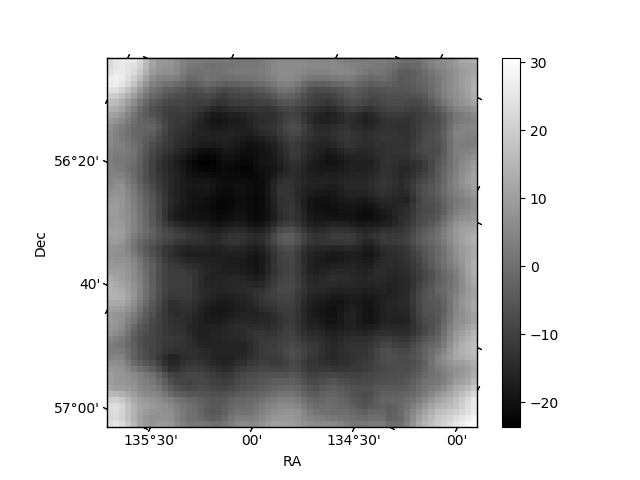
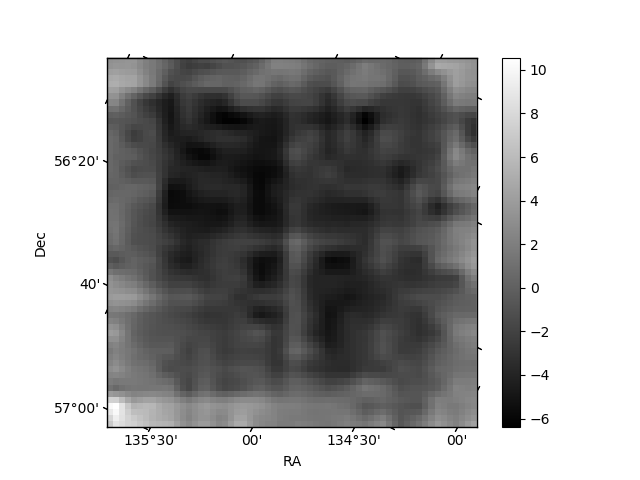
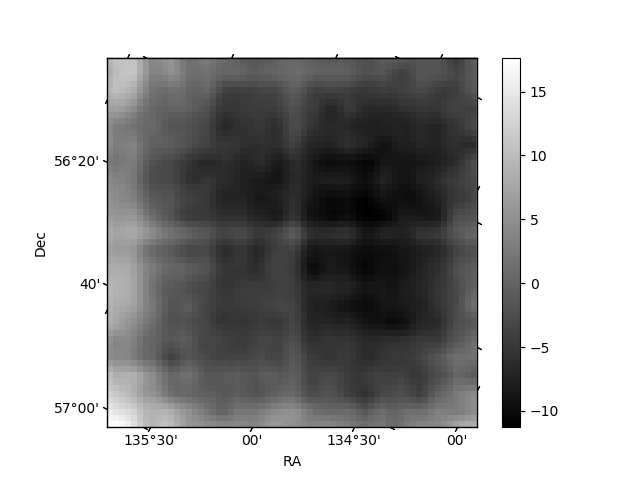
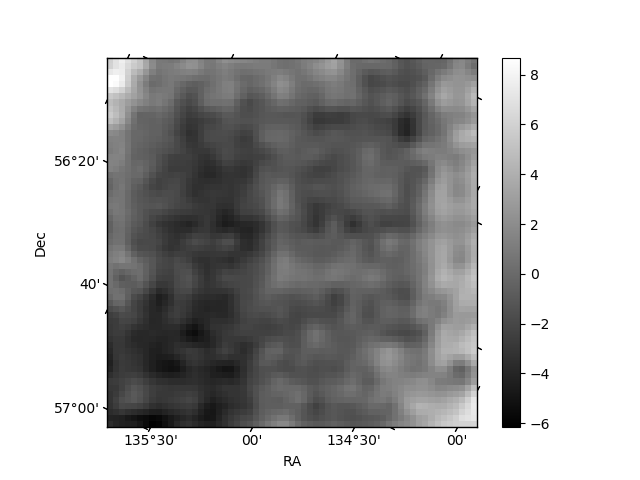
Histogram calculated using DETX and DETY for each event in the final _common_clean file
| Quadrant A |  |
 |
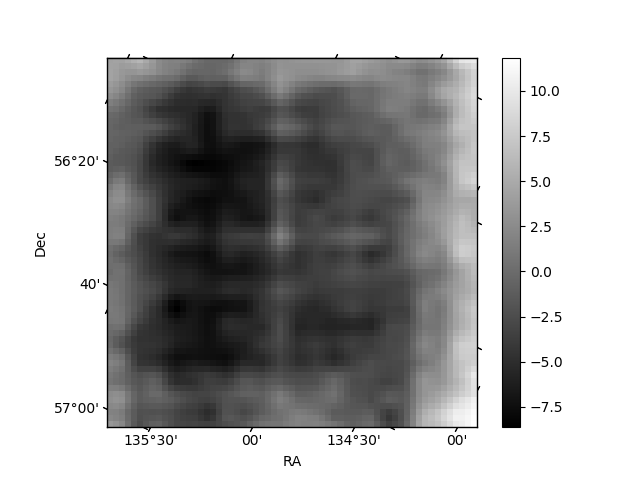
Quadrant B |
|---|---|---|---|
| Quadrant D | 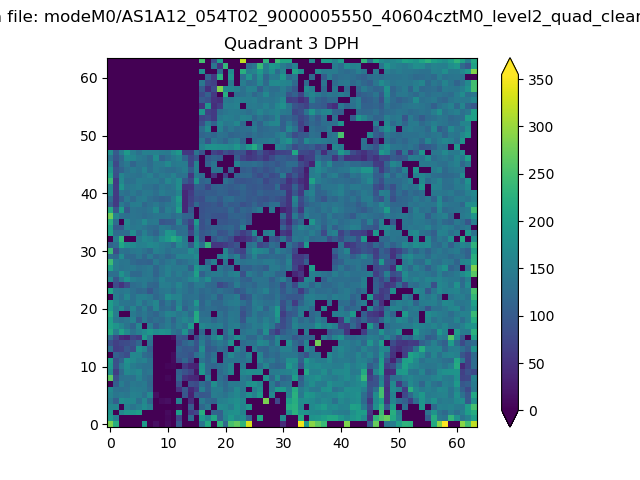 |
 |
Quadrant C |
| Plot type | Count rate plots | Images |
|---|---|---|
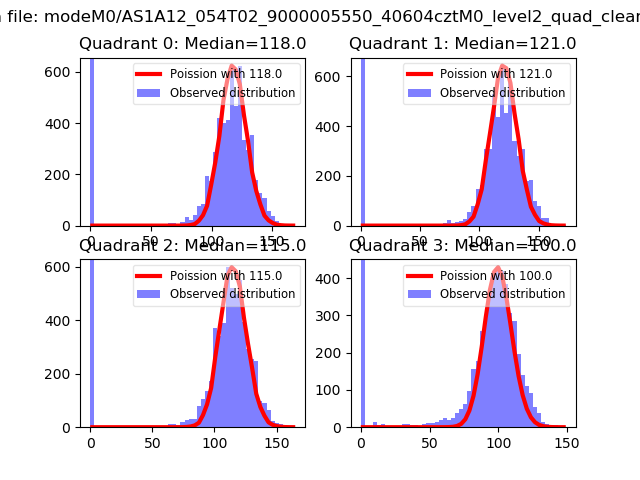
| Comparison with Poisson distribution Blue bars denote a histogram of data divided into 1 sec bins. Red curve is a Poisson curve with rate = median count rate of data. |
 |
 |
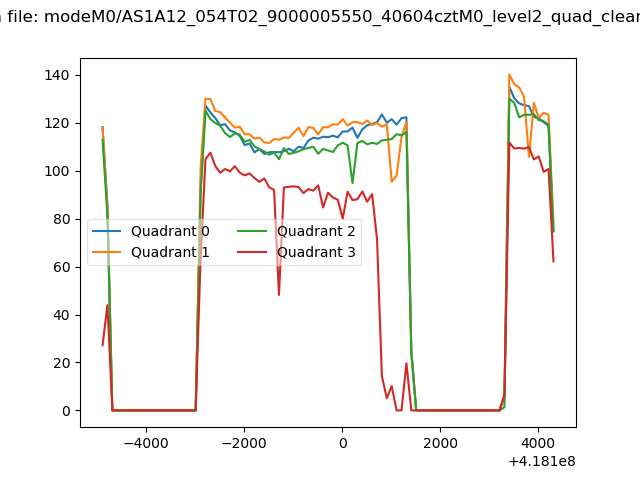
| Quadrant-wise count rates Data is divided into 100 sec bins |
 |
|
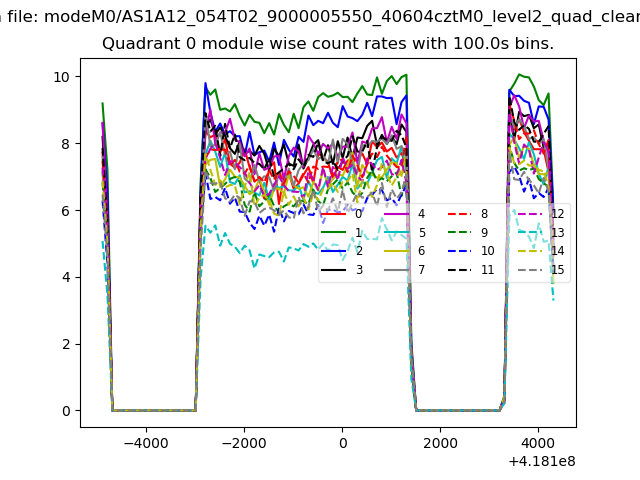
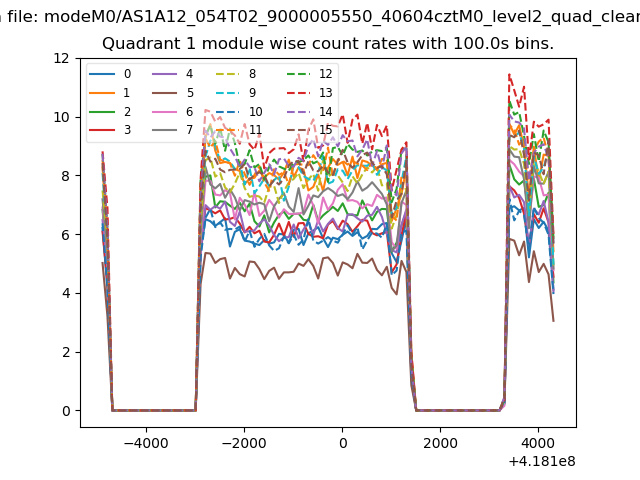
| Module-wise count rates for Quadrant A Data is divided into 100 sec bins |
 |
 |
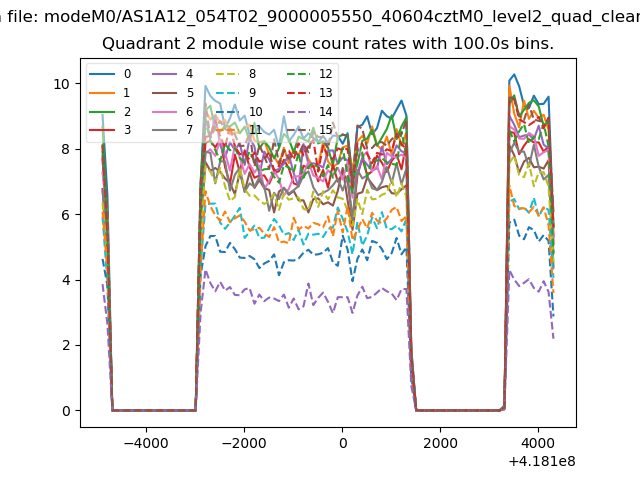
| Module-wise count rates for Quadrant B Data is divided into 100 sec bins |
 |
 |
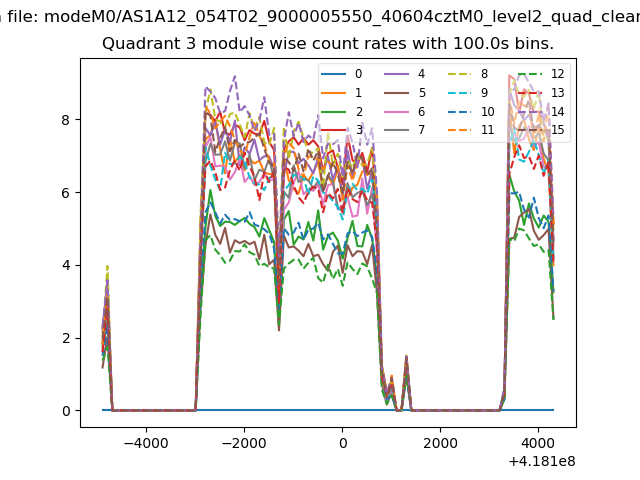
| Module-wise count rates for Quadrant C Data is divided into 100 sec bins |
 |
 |
| Module-wise count rates for Quadrant D Data is divided into 100 sec bins |
 |
 |
| Parameter | Plot |
|---|---|
| CZT HV Monitor | 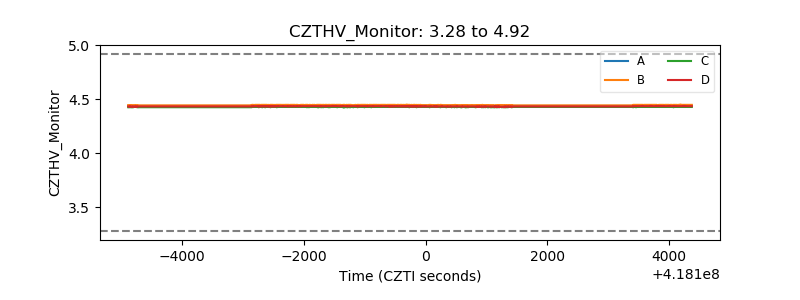 |
| D_VDD | 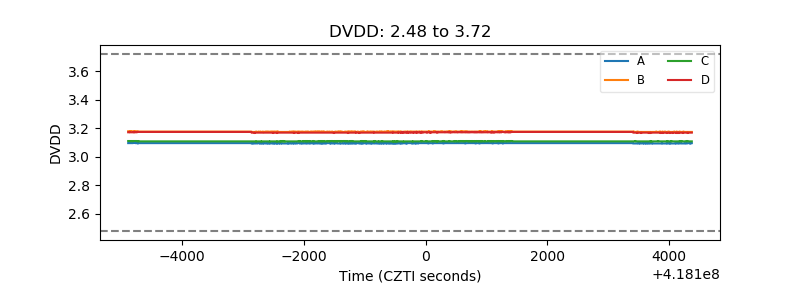 |
| Temperature 1 | 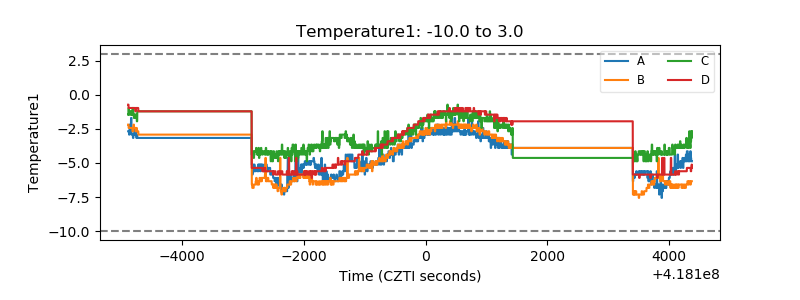 |
| Veto HV Monitor | 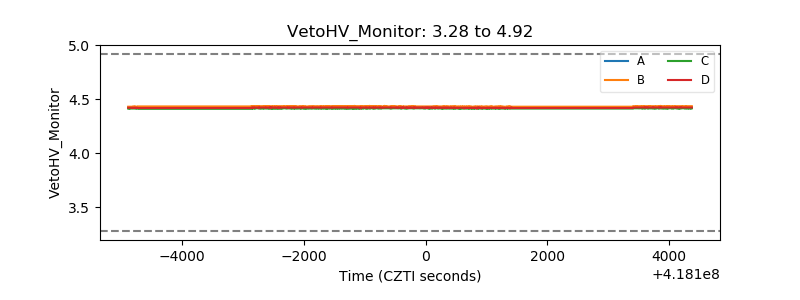 |
| Veto LLD | 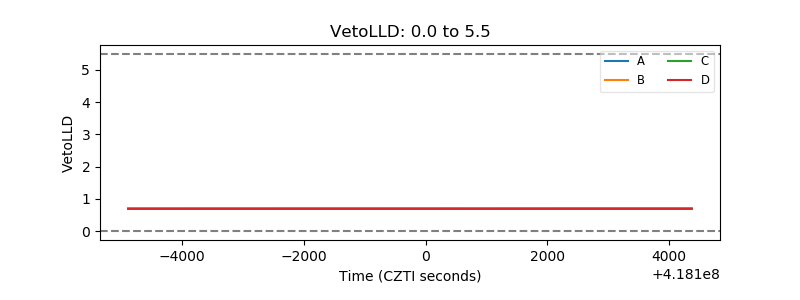 |
| Alpha Counter | 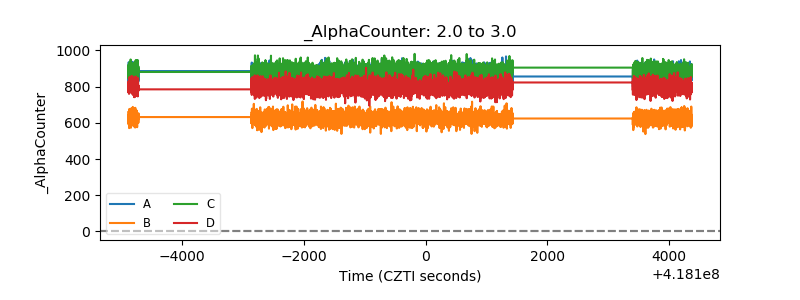 |
| _CPM_Rate | 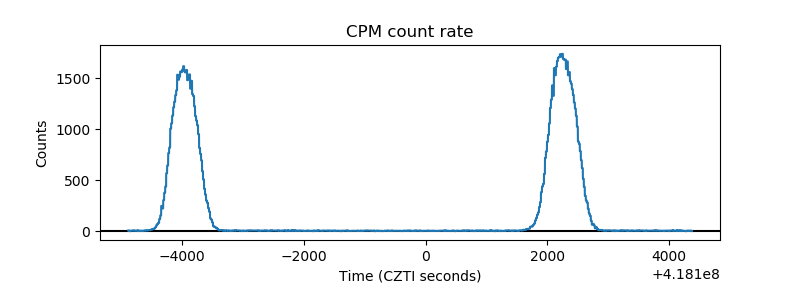 |
| CZT Counter | 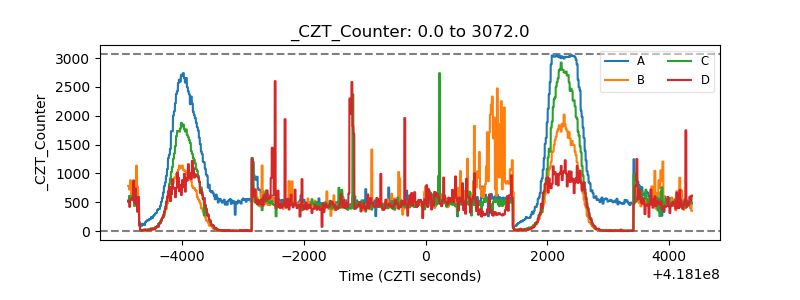 |
| +2.5 Volts monitor | 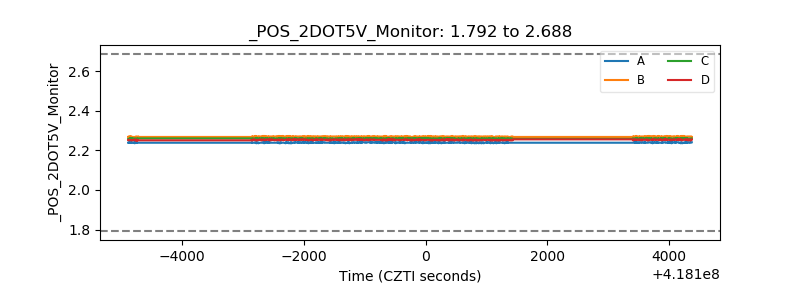 |
| +5 Volts monitor | 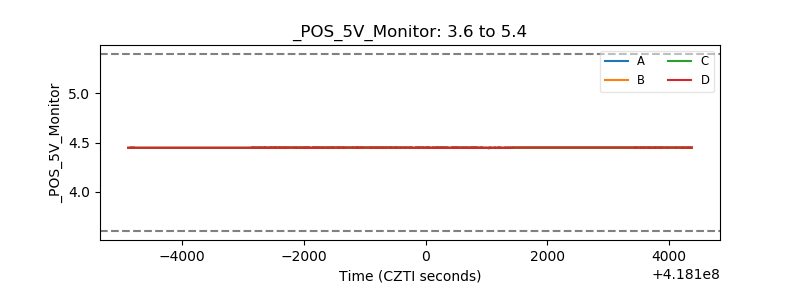 |
| _ROLL_ROT | 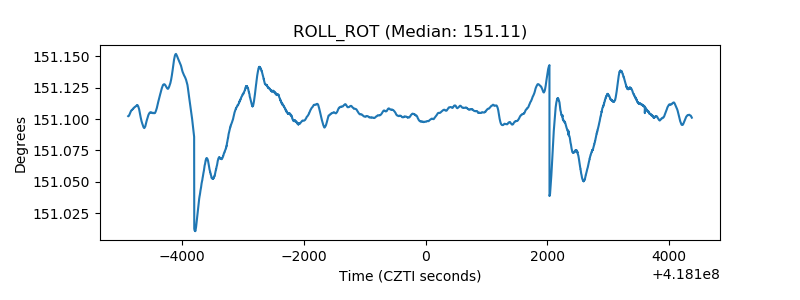 |
| _Roll_DEC | 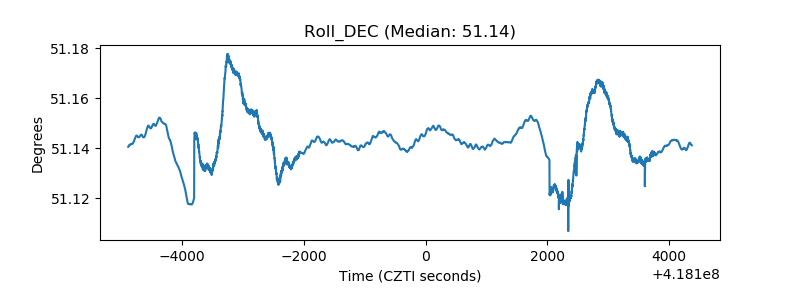 |
| _Roll_RA | 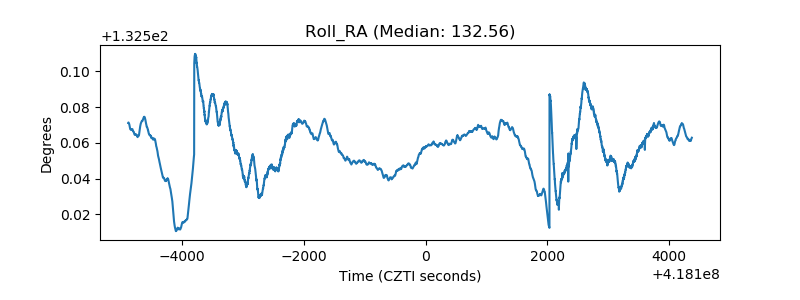 |
| Veto Counter | 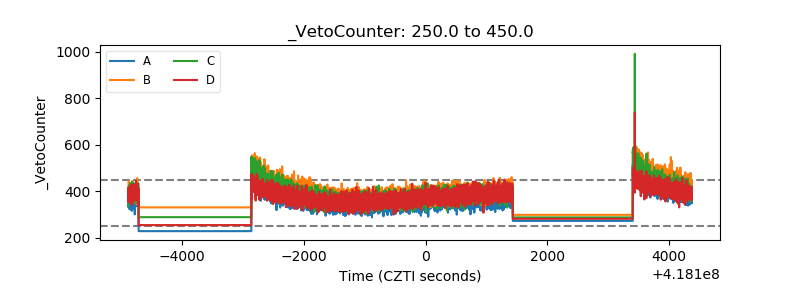 |