| Param | Original file | Final file |
|---|---|---|
| Filename | modeM0/AS1A12_054T02_9000005550_40605cztM0_level2.fits | modeM0/AS1A12_054T02_9000005550_40605cztM0_level2_quad_clean.evt |
| Size (bytes) | 370,059,840 | 86,045,760 |
| Size | 352.9 MB | 82.1 MB |
| Events in quadrant A | 2,783,236 | 617,398 |
| Events in quadrant B | 4,296,373 | 562,323 |
| Events in quadrant C | 3,067,202 | 584,396 |
| Events in quadrant D | 3,154,681 | 484,640 |
| Mode SS | |||
|---|---|---|---|
| Quadrant | BADHDUFLAG | Total packets | Discarded packets |
| A | 0 | 104 | 0 |
| B | 0 | 104 | 0 |
| C | 0 | 104 | 0 |
| D | 0 | 104 | 0 |
| Mode M0 | |||
|---|---|---|---|
| Quadrant | BADHDUFLAG | Total packets | Discarded packets |
| A | 0 | 11165 | 3 |
| B | 0 | 16025 | 2 |
| C | 0 | 12159 | 2 |
| D | 0 | 12715 | 2 |
| Mode M9 | |||
|---|---|---|---|
| Quadrant | BADHDUFLAG | Total packets | Discarded packets |
| A | 0 | 28 | 0 |
| B | 0 | 28 | 0 |
| C | 0 | 28 | 0 |
| D | 0 | 29 | 0 |
| Quadrant | Total seconds | Saturated seconds | Saturation percentage |
|---|---|---|---|
| A | 5088 | 10 | 0.196541% |
| B | 5088 | 663 | 13.030660% |
| C | 5088 | 149 | 2.928459% |
| D | 5088 | 714 | 14.033019% |
Noise dominated data is calculated using 1-second bins in cleaned event files. If a bin has >2000 counts, and if more than 50% of those come from <1% of pixels, then it is considered to be noise-dominated and hence unusable.
| Quadrant | # 1 sec bins | Bins with >0 counts | Bins with >2000 counts | High rate bins dominated by noise | Noise dominated (total time) | Noise dominated (detector-on time) | Marked lightcurve |
|---|---|---|---|---|---|---|---|
| A | 7181 | 5089 | 4 | 4 | 0.06% | 0.08% | 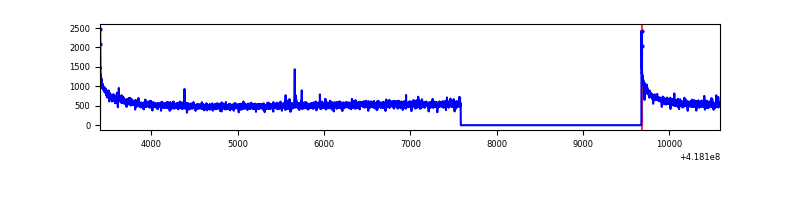 |
| B | 7181 | 5089 | 613 | 613 | 8.54% | 12.05% | 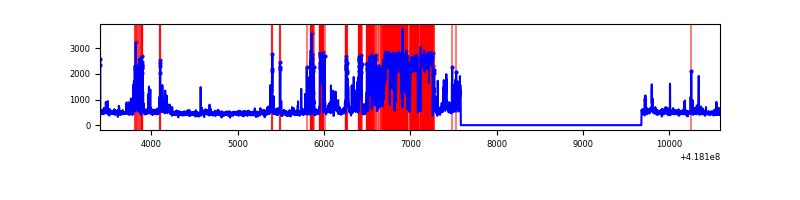 |
| C | 7181 | 5089 | 141 | 141 | 1.96% | 2.77% | 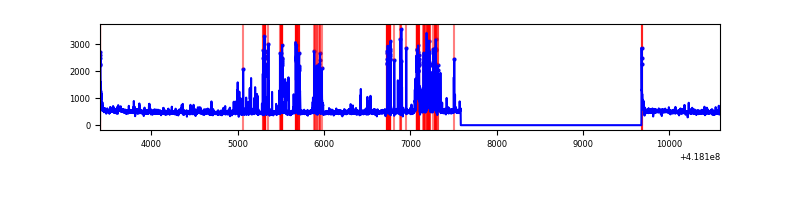 |
| D | 7180 | 5088 | 98 | 98 | 1.36% | 1.93% | 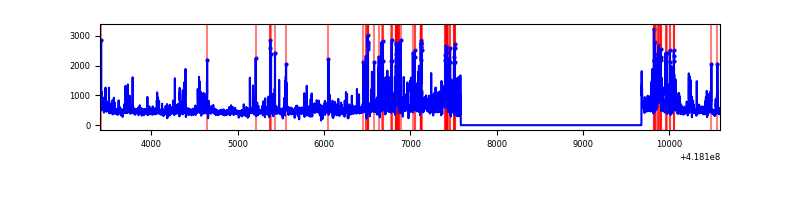 |
Top three noisy pixels from each quadrant. If the there are fewer than three noisy pixels in the level2.evt file, extra rows are filled as -1
| Pixel properties | Quadrant properties | ||||||
|---|---|---|---|---|---|---|---|
| Quadrant | DetID | PixID | Counts | Sigma | Mean | Median | Sigma |
| A | 10 | 83 | 479196 | 4005.87 | 590 | 579 | 119.5 |
| A | 3 | 1 | 15903 | 128.26 | 590 | 579 | 119.5 |
| A | 5 | 168 | 7338 | 56.57 | 590 | 579 | 119.5 |
| B | 5 | 255 | 1539302 | 14690.58 | 546 | 533 | 104.7 |
| B | 0 | 190 | 468548 | 4468.12 | 546 | 533 | 104.7 |
| B | 3 | 112 | 78745 | 746.69 | 546 | 533 | 104.7 |
| C | 14 | 254 | 543083 | 4186.07 | 559 | 564 | 129.6 |
| C | 15 | 214 | 221358 | 1703.64 | 559 | 564 | 129.6 |
| C | 9 | 187 | 43864 | 334.1 | 559 | 564 | 129.6 |
| D | 12 | 227 | 374630 | 2869.53 | 528 | 515 | 130.4 |
| D | 2 | 153 | 276238 | 2114.84 | 528 | 515 | 130.4 |
| D | 12 | 191 | 203075 | 1553.67 | 528 | 515 | 130.4 |
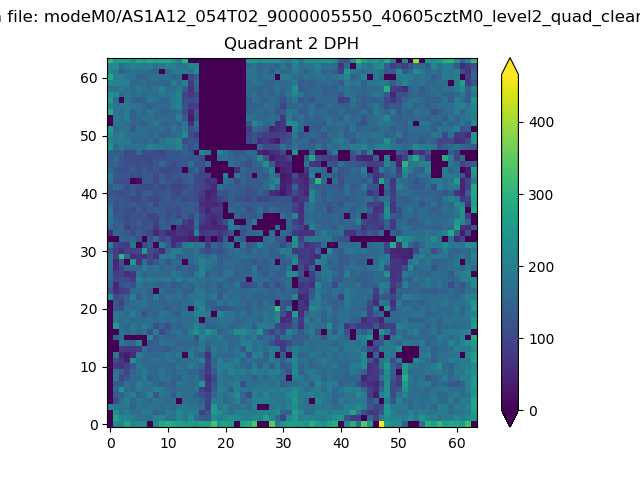
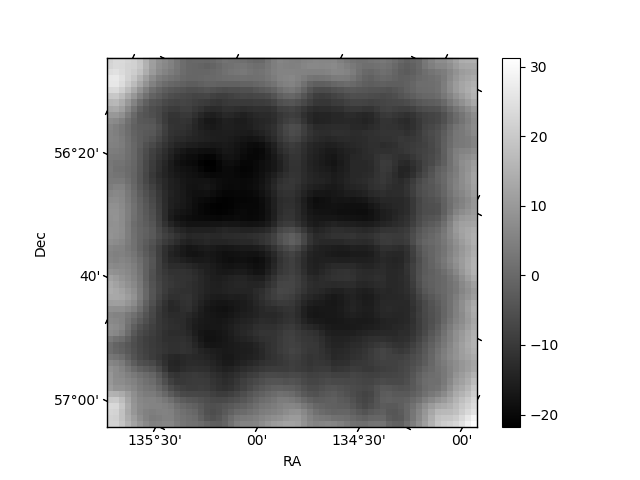
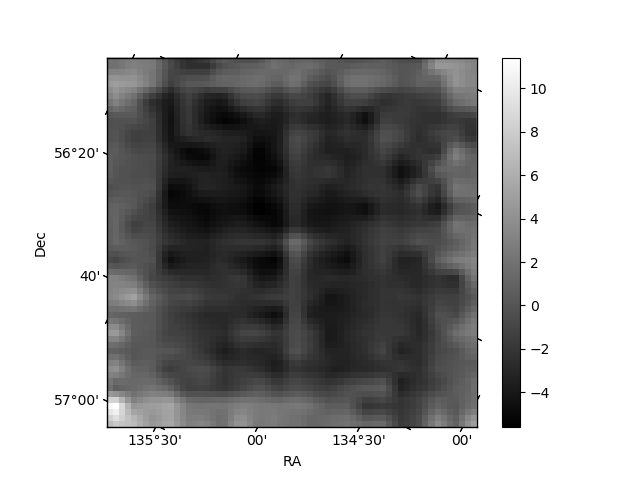
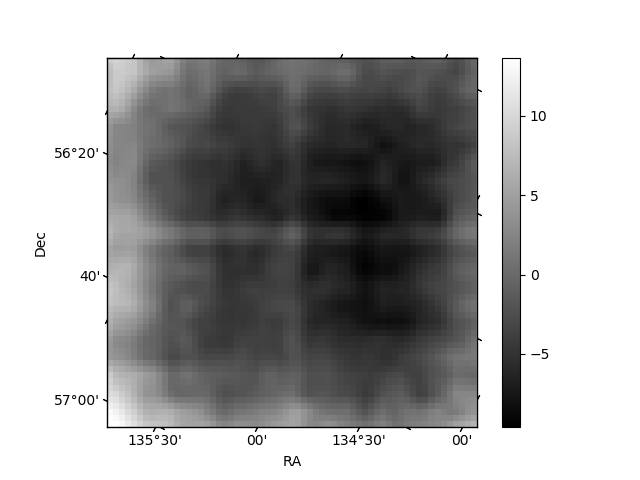
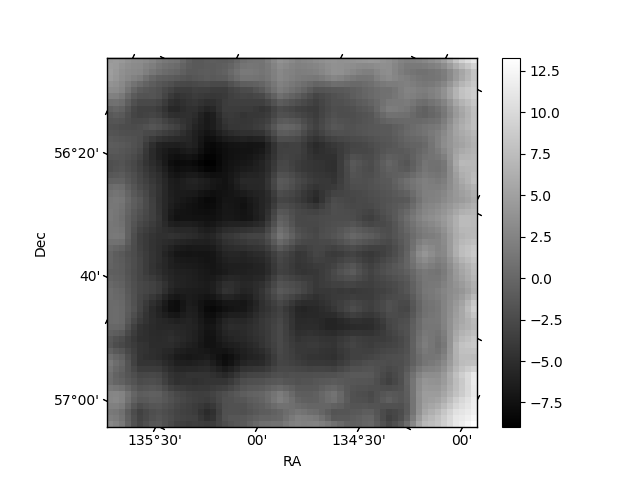
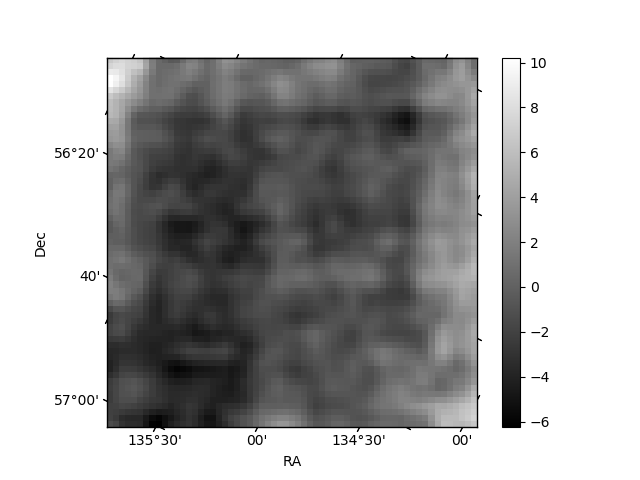
Histogram calculated using DETX and DETY for each event in the final _common_clean file
| Quadrant A | 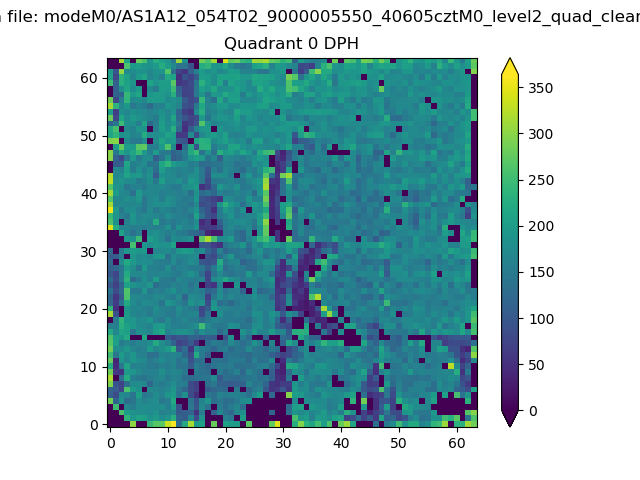 |
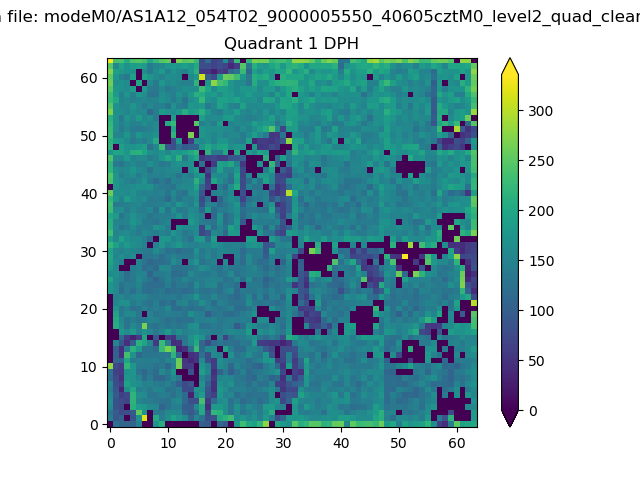 |
Quadrant B |
|---|---|---|---|
| Quadrant D | 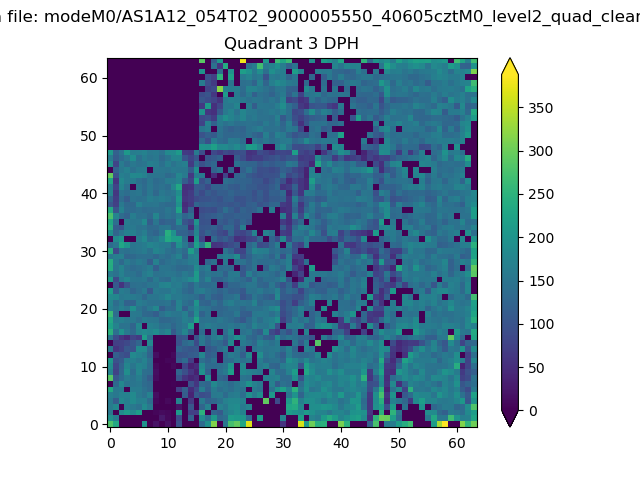 |
 |
Quadrant C |
| Plot type | Count rate plots | Images |
|---|---|---|
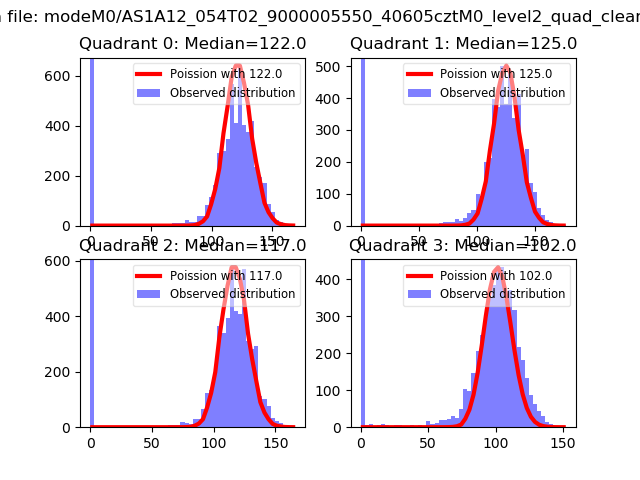
| Comparison with Poisson distribution Blue bars denote a histogram of data divided into 1 sec bins. Red curve is a Poisson curve with rate = median count rate of data. |
 |
 |
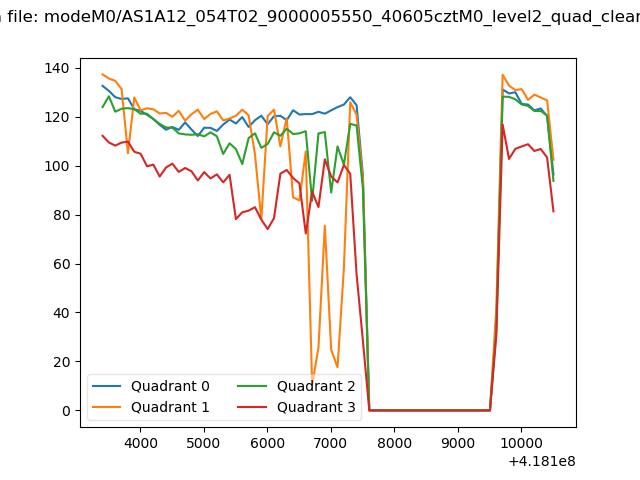
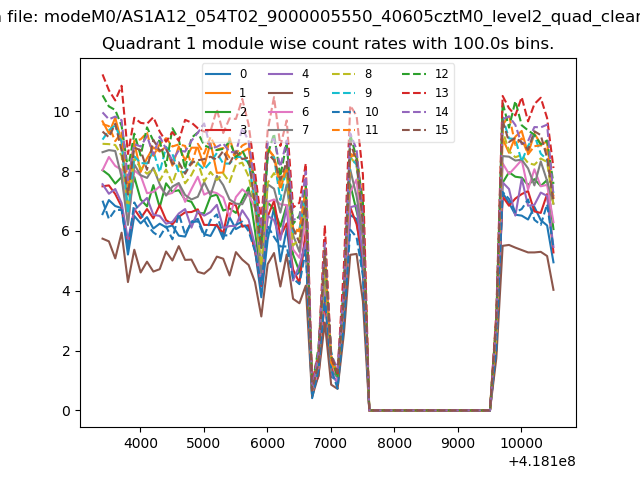
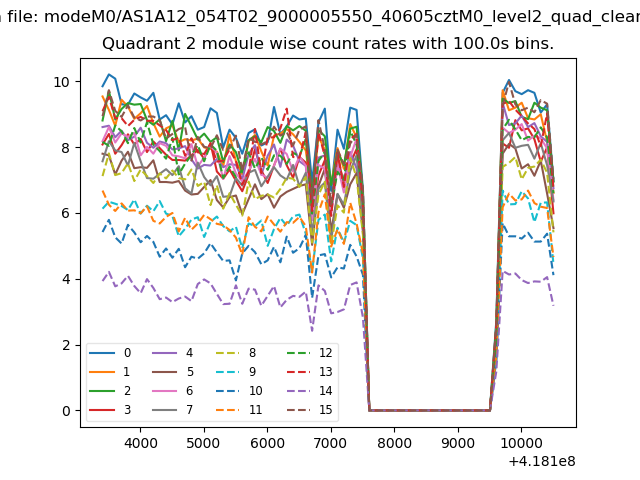
| Quadrant-wise count rates Data is divided into 100 sec bins |
 |
|
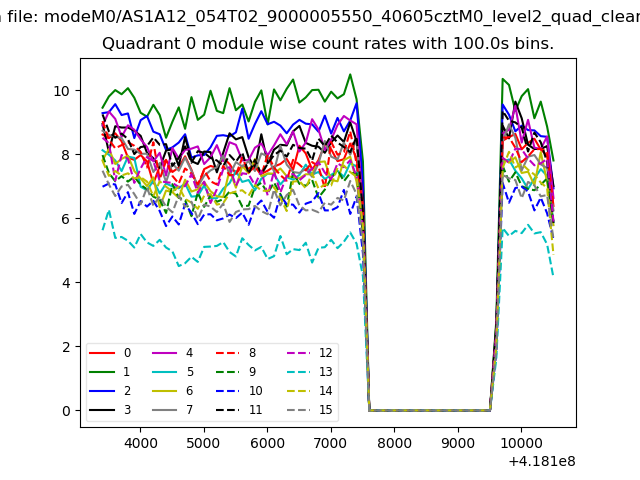
| Module-wise count rates for Quadrant A Data is divided into 100 sec bins |
 |
 |
| Module-wise count rates for Quadrant B Data is divided into 100 sec bins |
 |
 |
| Module-wise count rates for Quadrant C Data is divided into 100 sec bins |
 |
 |
| Module-wise count rates for Quadrant D Data is divided into 100 sec bins |
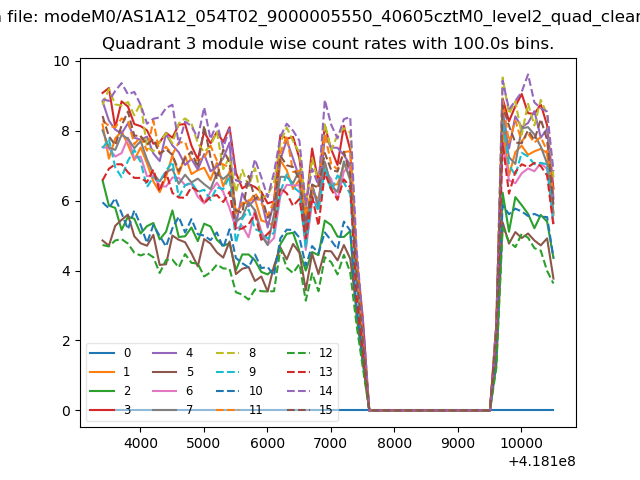 |
 |
| Parameter | Plot |
|---|---|
| CZT HV Monitor | 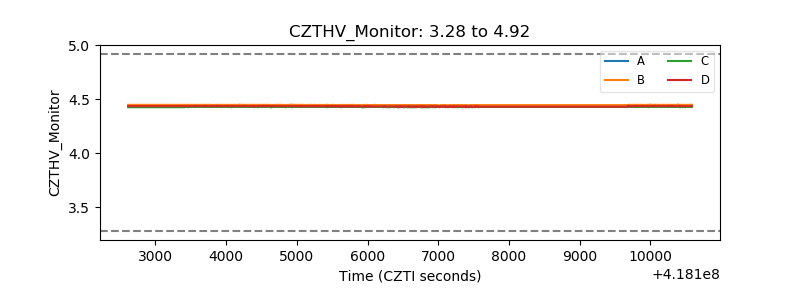 |
| D_VDD | 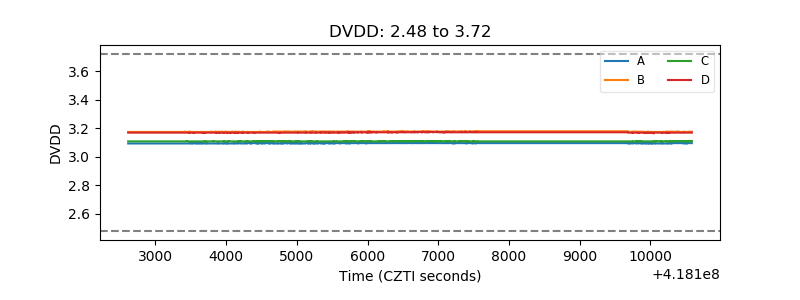 |
| Temperature 1 | 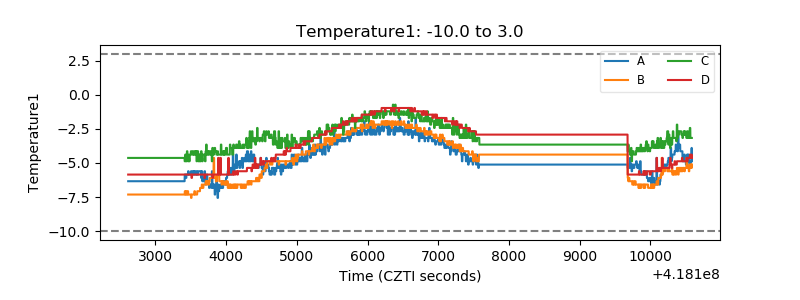 |
| Veto HV Monitor | 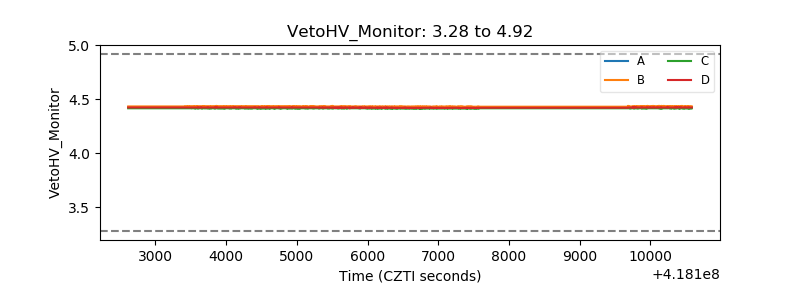 |
| Veto LLD | 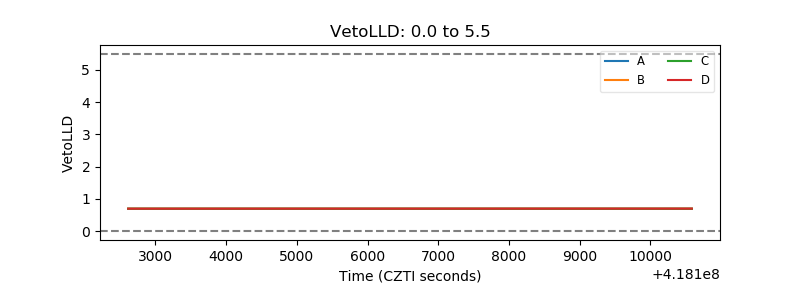 |
| Alpha Counter | 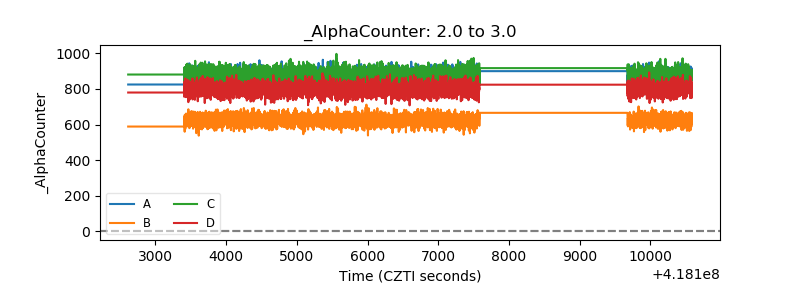 |
| _CPM_Rate | 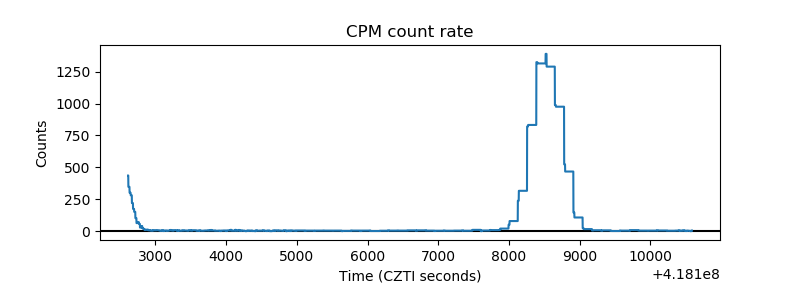 |
| CZT Counter | 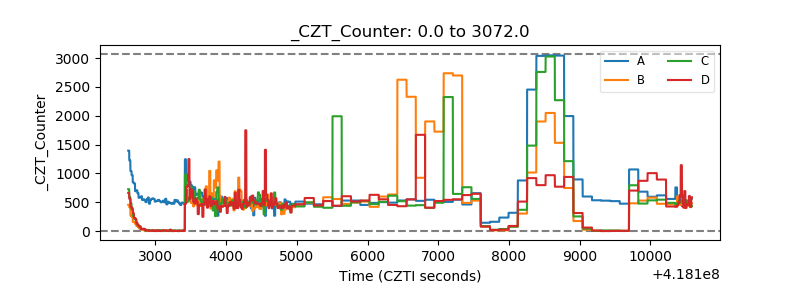 |
| +2.5 Volts monitor | 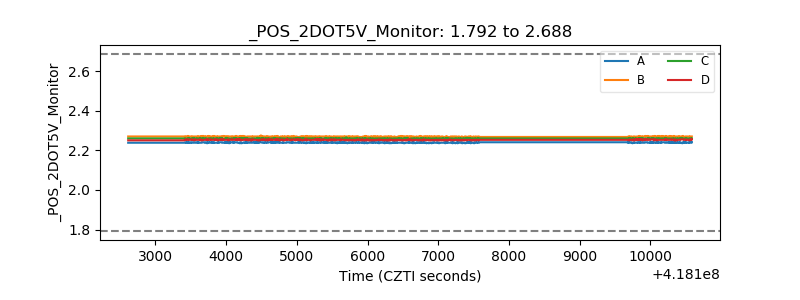 |
| +5 Volts monitor | 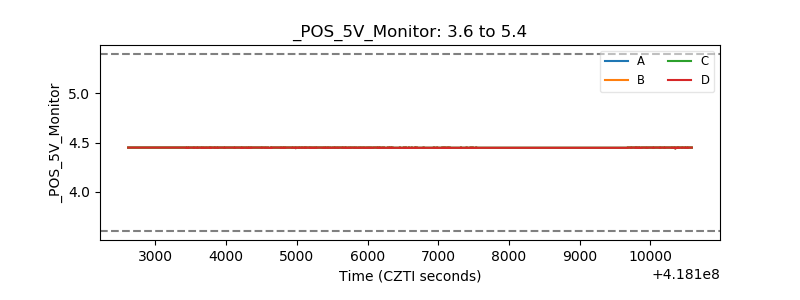 |
| _ROLL_ROT | 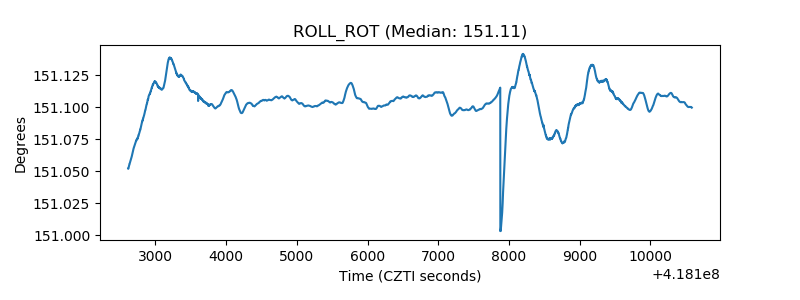 |
| _Roll_DEC | 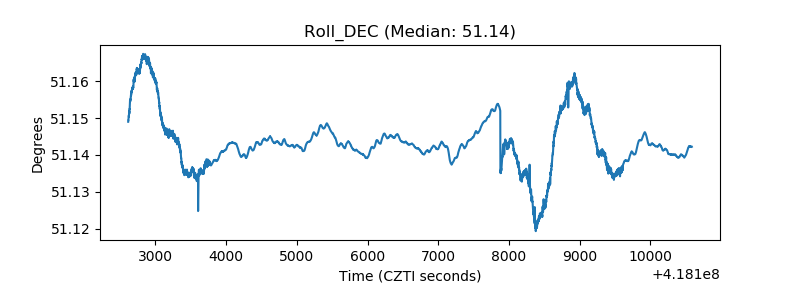 |
| _Roll_RA | 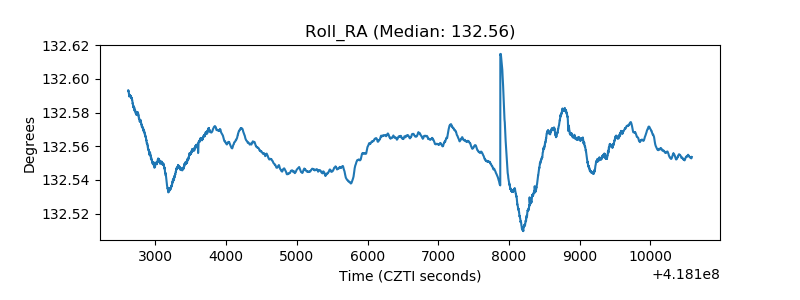 |
| Veto Counter | 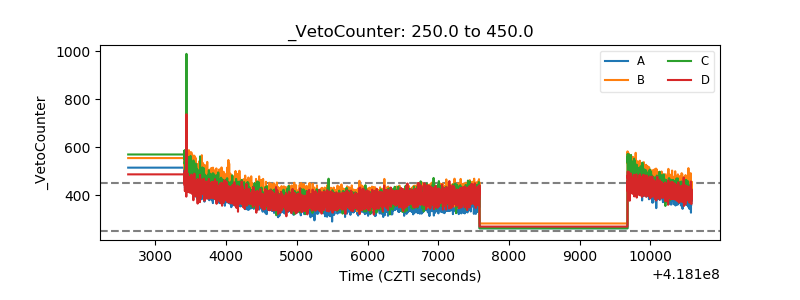 |