| Param | Original file | Final file |
|---|---|---|
| Filename | modeM0/AS1A12_054T02_9000005550_40607cztM0_level2.fits | modeM0/AS1A12_054T02_9000005550_40607cztM0_level2_quad_clean.evt |
| Size (bytes) | 338,209,920 | 82,408,320 |
| Size | 322.5 MB | 78.6 MB |
| Events in quadrant A | 2,657,644 | 572,669 |
| Events in quadrant B | 3,401,559 | 573,913 |
| Events in quadrant C | 2,593,339 | 551,646 |
| Events in quadrant D | 3,486,188 | 454,855 |
| Mode SS | |||
|---|---|---|---|
| Quadrant | BADHDUFLAG | Total packets | Discarded packets |
| A | 0 | 98 | 0 |
| B | 0 | 98 | 0 |
| C | 0 | 98 | 0 |
| D | 0 | 98 | 0 |
| Mode M0 | |||
|---|---|---|---|
| Quadrant | BADHDUFLAG | Total packets | Discarded packets |
| A | 0 | 10700 | 3 |
| B | 0 | 13201 | 2 |
| C | 0 | 10696 | 2 |
| D | 0 | 13762 | 2 |
| Mode M9 | |||
|---|---|---|---|
| Quadrant | BADHDUFLAG | Total packets | Discarded packets |
| A | 0 | 36 | 0 |
| B | 0 | 36 | 0 |
| C | 0 | 36 | 0 |
| D | 0 | 37 | 0 |
| Quadrant | Total seconds | Saturated seconds | Saturation percentage |
|---|---|---|---|
| A | 4883 | 7 | 0.143354% |
| B | 4883 | 199 | 4.075364% |
| C | 4883 | 46 | 0.942044% |
| D | 4883 | 622 | 12.738071% |
Noise dominated data is calculated using 1-second bins in cleaned event files. If a bin has >2000 counts, and if more than 50% of those come from <1% of pixels, then it is considered to be noise-dominated and hence unusable.
| Quadrant | # 1 sec bins | Bins with >0 counts | Bins with >2000 counts | High rate bins dominated by noise | Noise dominated (total time) | Noise dominated (detector-on time) | Marked lightcurve |
|---|---|---|---|---|---|---|---|
| A | 7005 | 4884 | 4 | 4 | 0.06% | 0.08% | 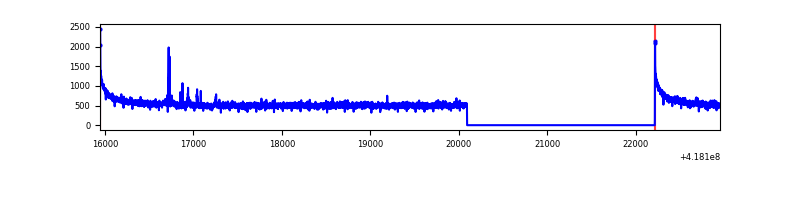 |
| B | 7005 | 4884 | 168 | 168 | 2.40% | 3.44% | 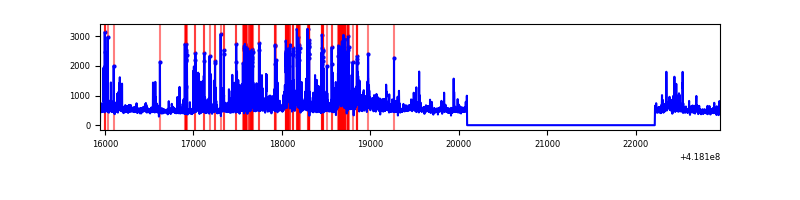 |
| C | 7005 | 4884 | 42 | 42 | 0.60% | 0.86% | 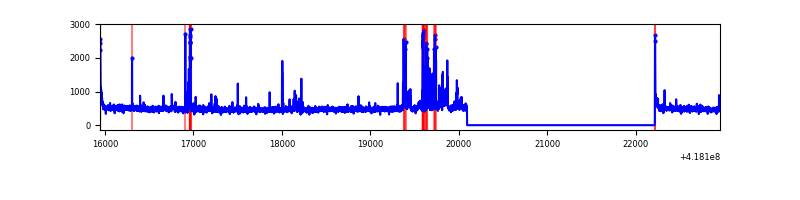 |
| D | 7005 | 4884 | 163 | 163 | 2.33% | 3.34% | 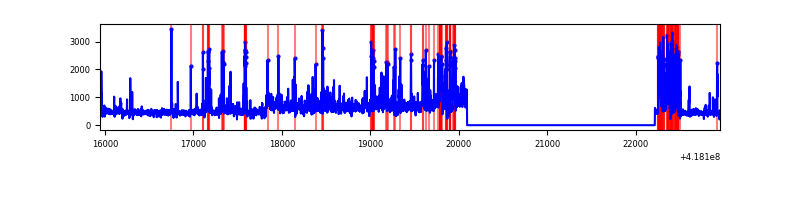 |
Top three noisy pixels from each quadrant. If the there are fewer than three noisy pixels in the level2.evt file, extra rows are filled as -1
| Pixel properties | Quadrant properties | ||||||
|---|---|---|---|---|---|---|---|
| Quadrant | DetID | PixID | Counts | Sigma | Mean | Median | Sigma |
| A | 10 | 83 | 474481 | 4201.11 | 553 | 543 | 112.8 |
| A | 5 | 168 | 26805 | 232.79 | 553 | 543 | 112.8 |
| A | 12 | 189 | 11561 | 97.67 | 553 | 543 | 112.8 |
| B | 0 | 190 | 830441 | 8149.05 | 537 | 524 | 101.8 |
| B | 0 | 229 | 169921 | 1663.33 | 537 | 524 | 101.8 |
| B | 3 | 112 | 144705 | 1415.73 | 537 | 524 | 101.8 |
| C | 14 | 254 | 261057 | 2095.26 | 530 | 533 | 124.3 |
| C | 15 | 214 | 216216 | 1734.62 | 530 | 533 | 124.3 |
| C | 0 | 10 | 36894 | 292.43 | 530 | 533 | 124.3 |
| D | 12 | 227 | 949310 | 7566.04 | 505 | 488 | 125.4 |
| D | 12 | 191 | 168715 | 1341.47 | 505 | 488 | 125.4 |
| D | 2 | 249 | 113944 | 904.71 | 505 | 488 | 125.4 |
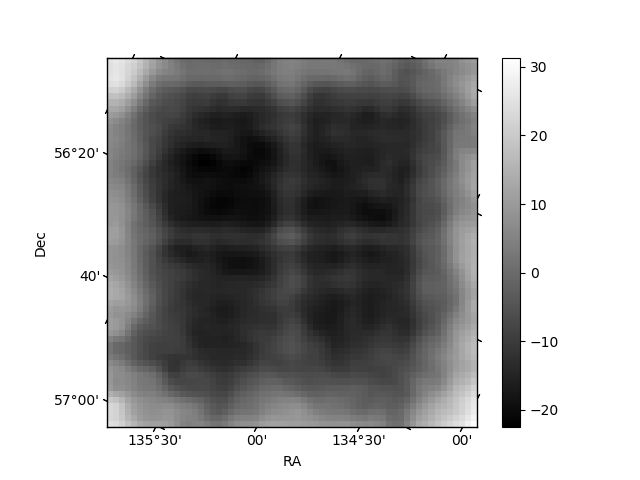
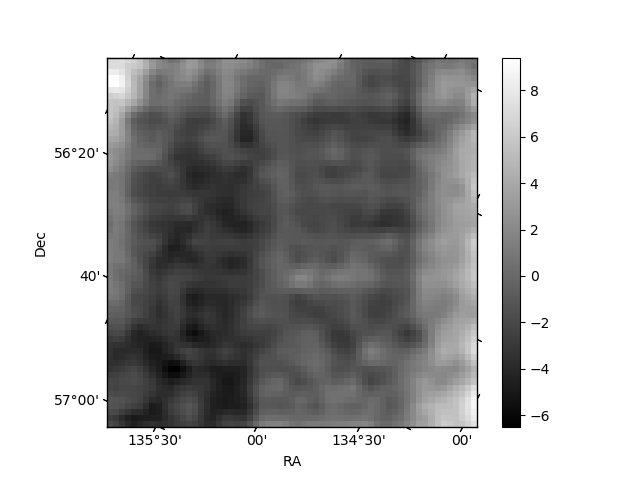
Histogram calculated using DETX and DETY for each event in the final _common_clean file
| Quadrant A | 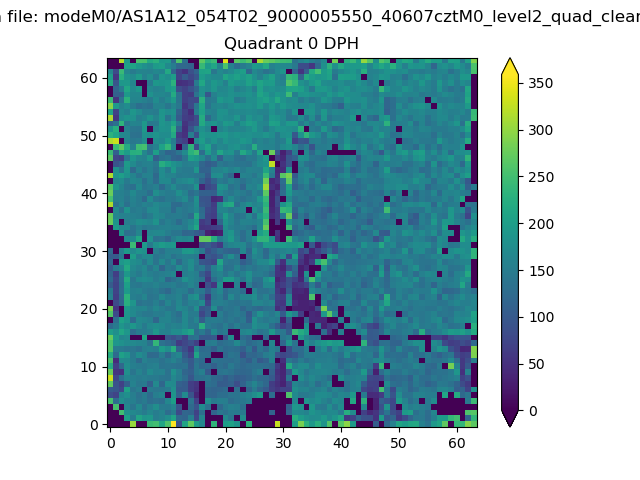 |
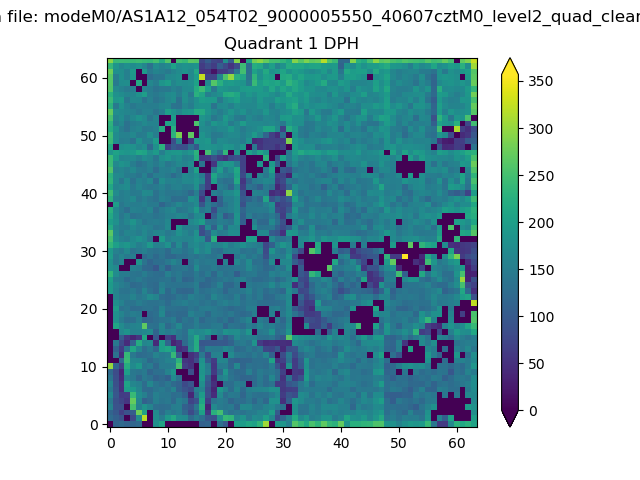 |
Quadrant B |
|---|---|---|---|
| Quadrant D | 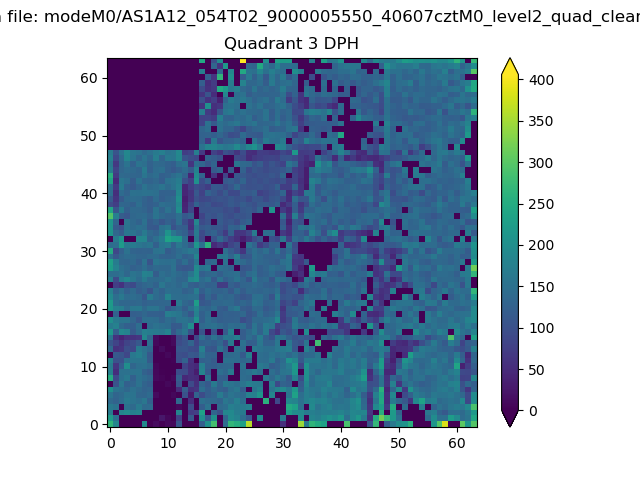 |
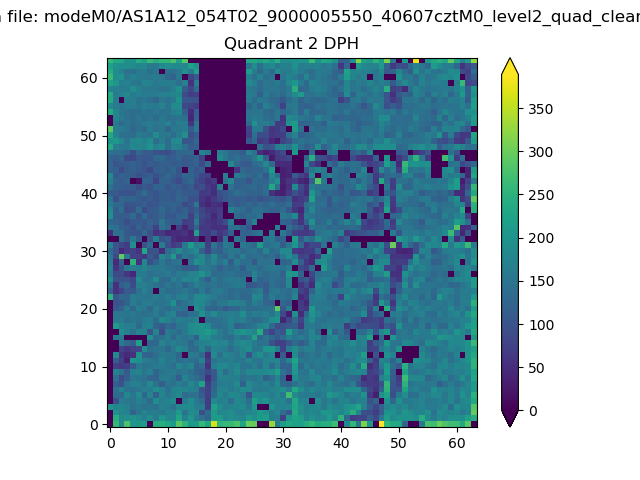 |
Quadrant C |
| Plot type | Count rate plots | Images |
|---|---|---|
| Comparison with Poisson distribution Blue bars denote a histogram of data divided into 1 sec bins. Red curve is a Poisson curve with rate = median count rate of data. |
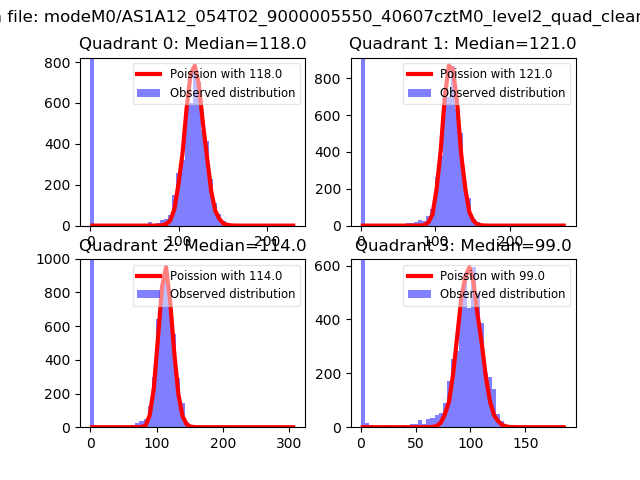 |
 |
| Quadrant-wise count rates Data is divided into 100 sec bins |
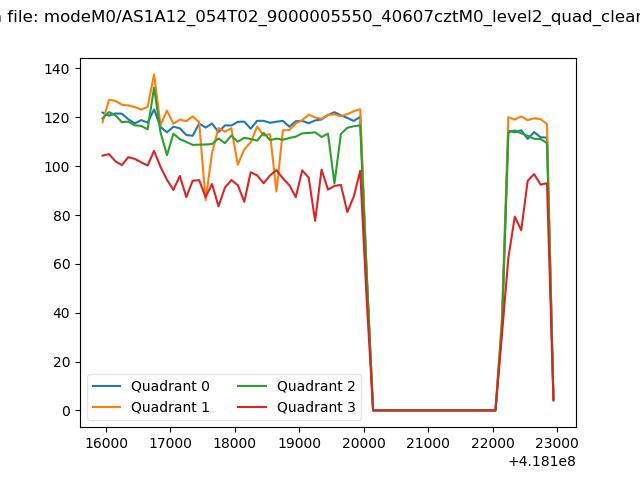 |
|
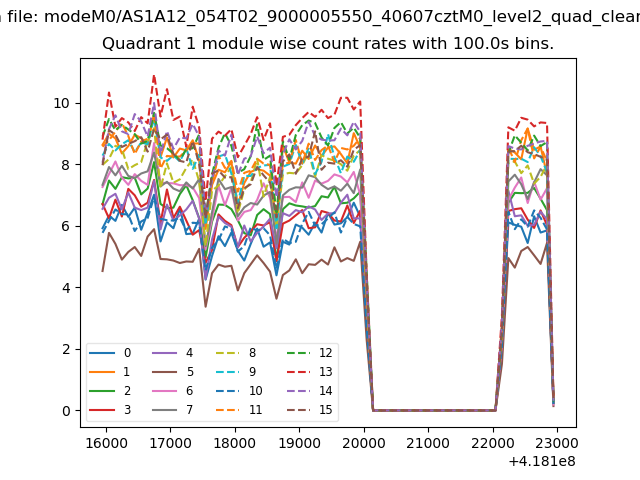
| Module-wise count rates for Quadrant A Data is divided into 100 sec bins |
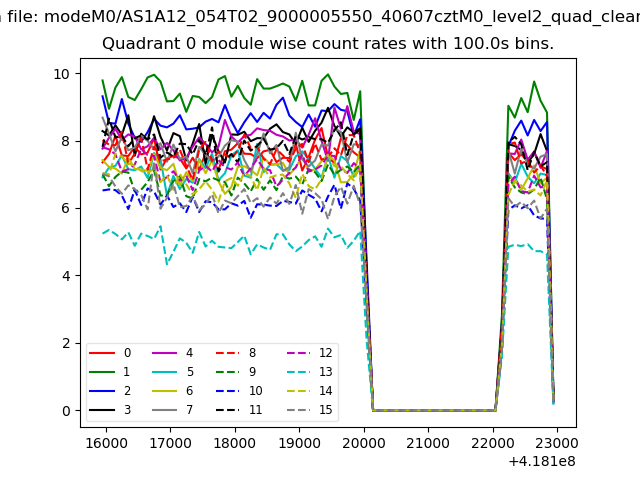 |
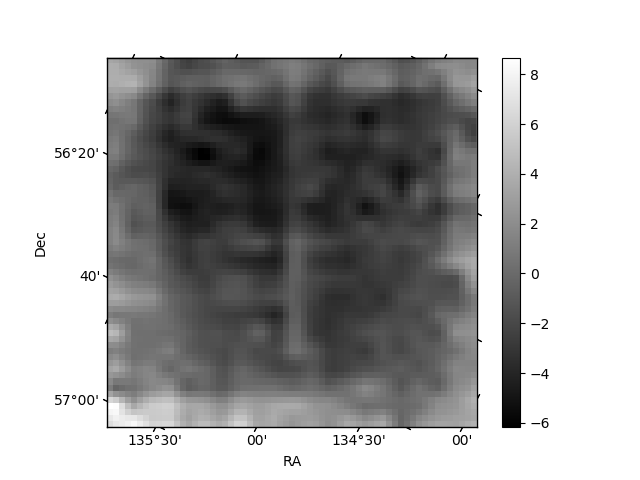 |
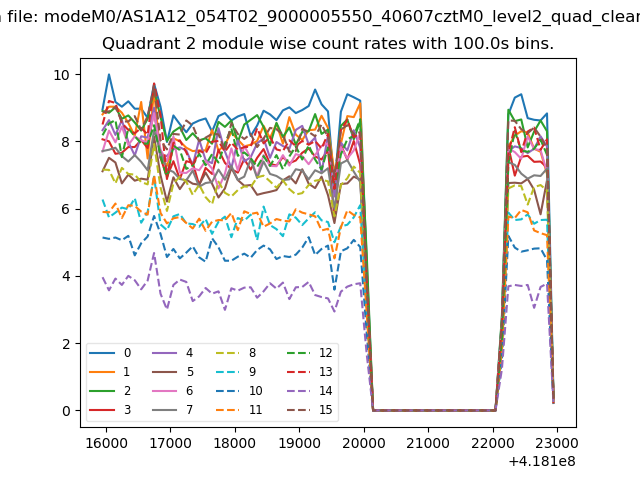
| Module-wise count rates for Quadrant B Data is divided into 100 sec bins |
 |
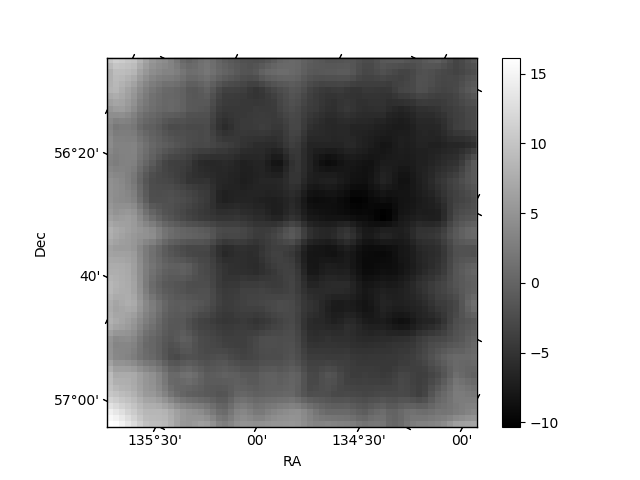 |
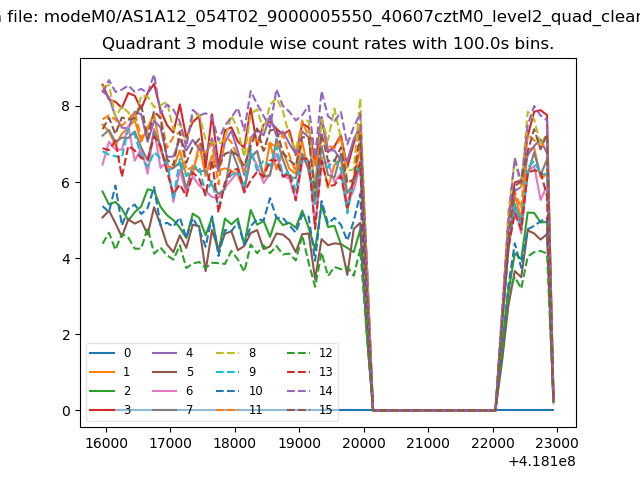
| Module-wise count rates for Quadrant C Data is divided into 100 sec bins |
 |
 |
| Module-wise count rates for Quadrant D Data is divided into 100 sec bins |
 |
 |
| Parameter | Plot |
|---|---|
| CZT HV Monitor | 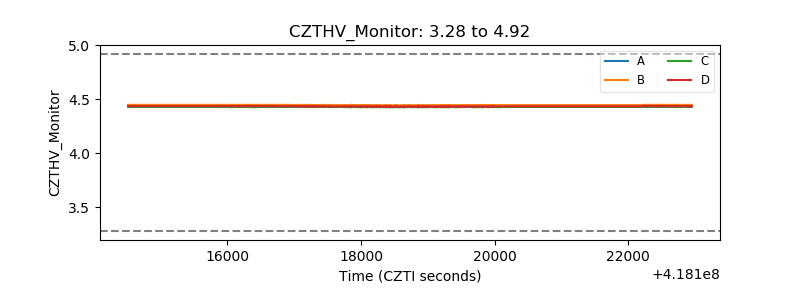 |
| D_VDD | 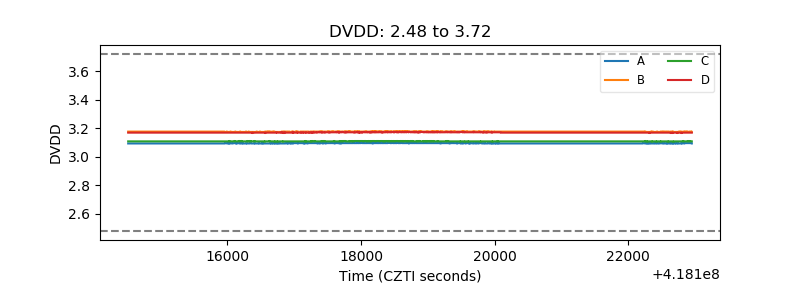 |
| Temperature 1 | 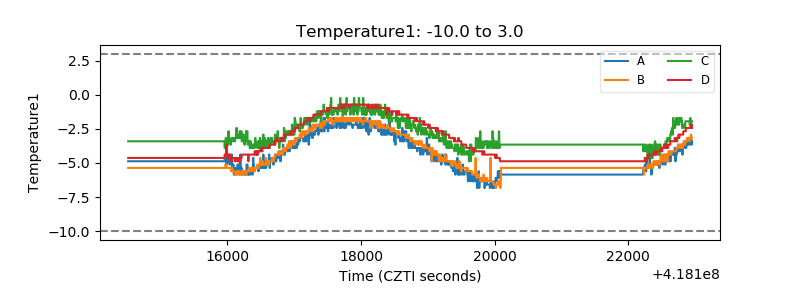 |
| Veto HV Monitor | 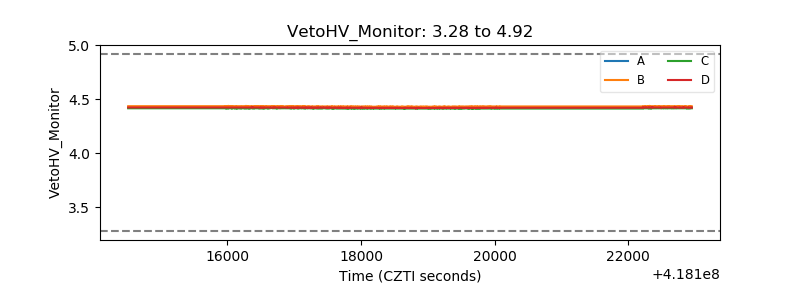 |
| Veto LLD | 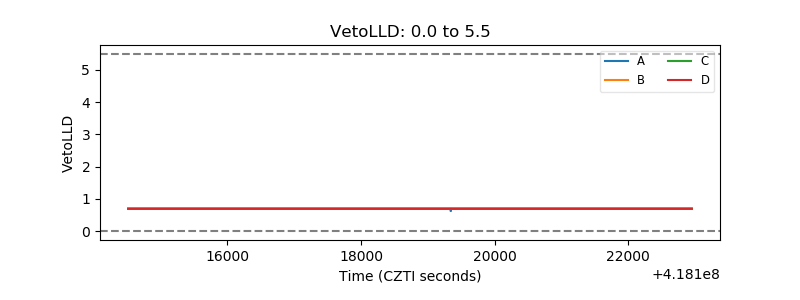 |
| Alpha Counter | 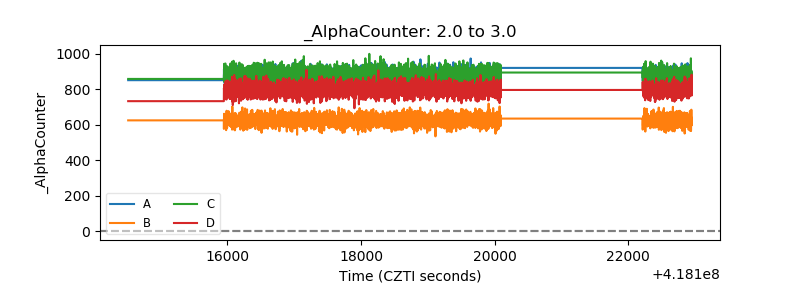 |
| _CPM_Rate | 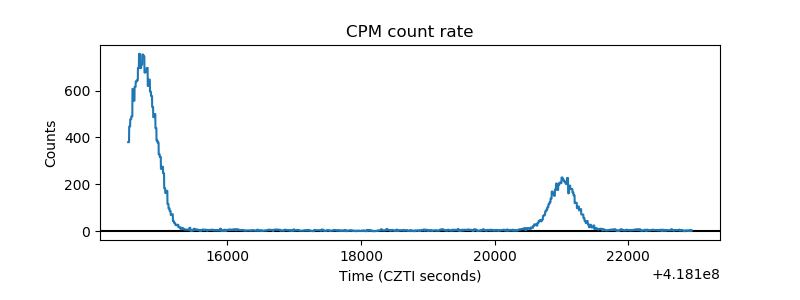 |
| CZT Counter | 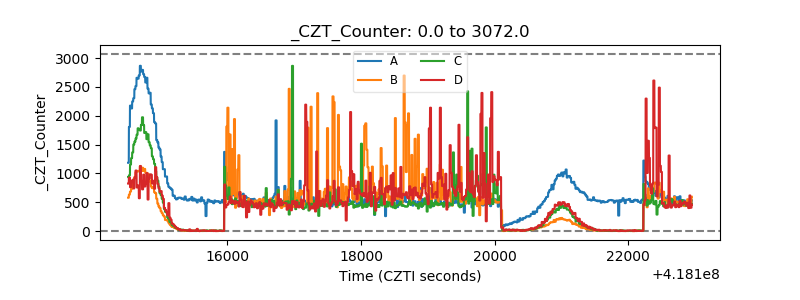 |
| +2.5 Volts monitor | 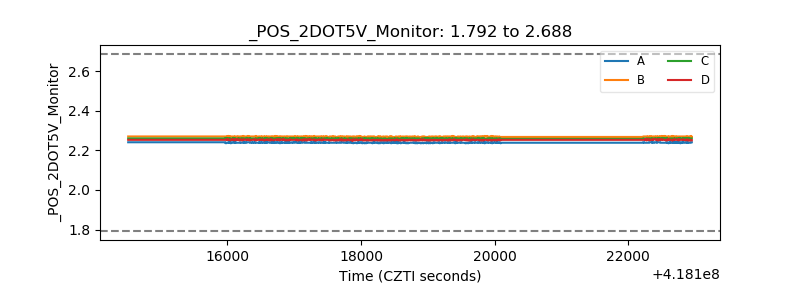 |
| +5 Volts monitor | 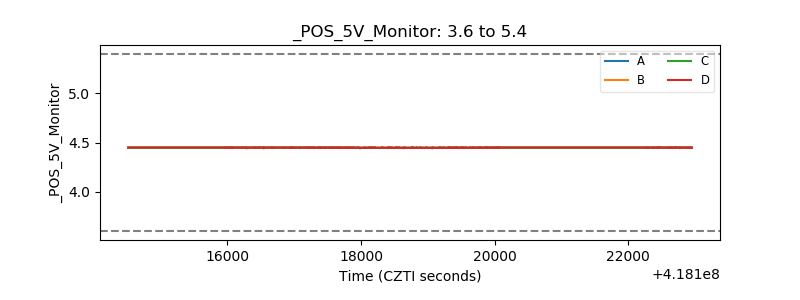 |
| _ROLL_ROT | 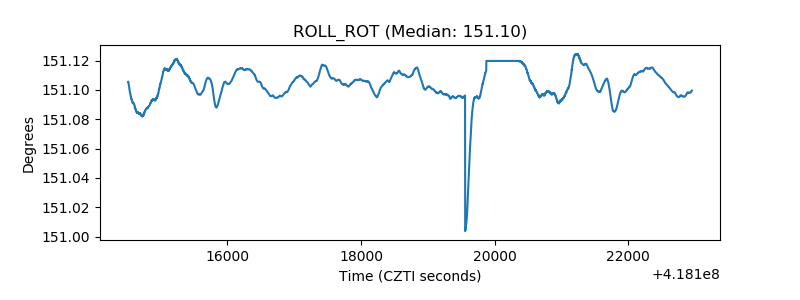 |
| _Roll_DEC | 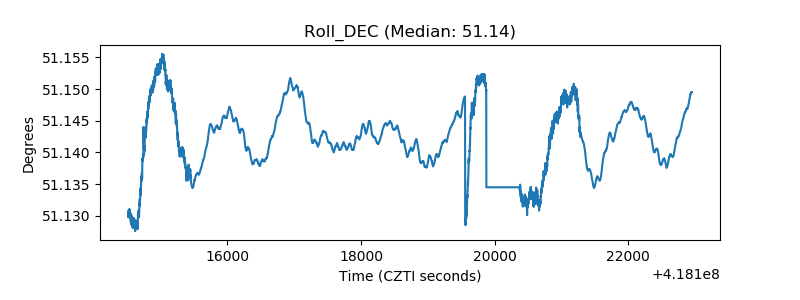 |
| _Roll_RA | 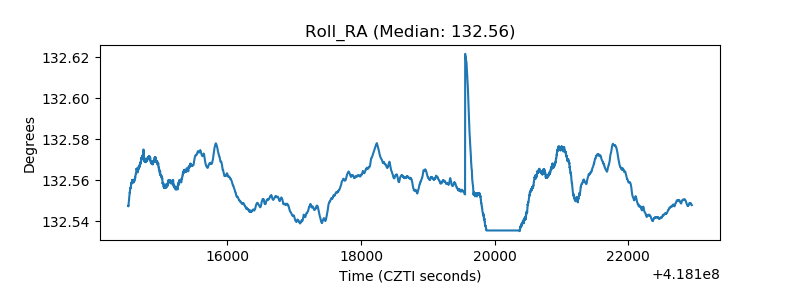 |
| Veto Counter | 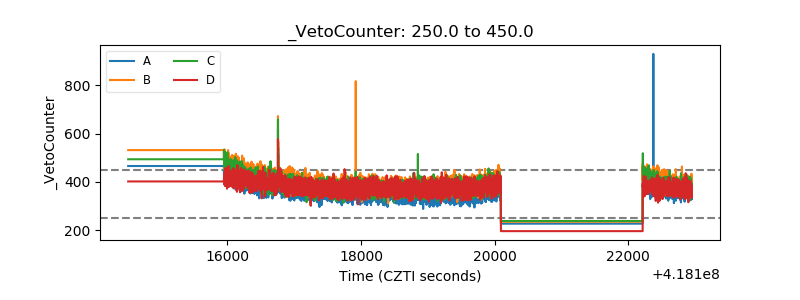 |