| Param | Original file | Final file |
|---|---|---|
| Filename | modeM0/AS1A12_054T02_9000005550_40608cztM0_level2.fits | modeM0/AS1A12_054T02_9000005550_40608cztM0_level2_quad_clean.evt |
| Size (bytes) | 352,941,120 | 83,062,080 |
| Size | 336.6 MB | 79.2 MB |
| Events in quadrant A | 2,673,151 | 575,418 |
| Events in quadrant B | 3,812,940 | 579,498 |
| Events in quadrant C | 2,607,637 | 553,116 |
| Events in quadrant D | 3,573,314 | 449,206 |
| Mode SS | |||
|---|---|---|---|
| Quadrant | BADHDUFLAG | Total packets | Discarded packets |
| A | 0 | 102 | 0 |
| B | 0 | 102 | 0 |
| C | 0 | 102 | 0 |
| D | 0 | 102 | 0 |
| Mode M0 | |||
|---|---|---|---|
| Quadrant | BADHDUFLAG | Total packets | Discarded packets |
| A | 0 | 10965 | 3 |
| B | 0 | 14713 | 2 |
| C | 0 | 10952 | 2 |
| D | 0 | 14031 | 2 |
| Mode M9 | |||
|---|---|---|---|
| Quadrant | BADHDUFLAG | Total packets | Discarded packets |
| A | 0 | 37 | 0 |
| B | 0 | 37 | 0 |
| C | 0 | 37 | 0 |
| D | 0 | 38 | 0 |
| Quadrant | Total seconds | Saturated seconds | Saturation percentage |
|---|---|---|---|
| A | 5102 | 10 | 0.196002% |
| B | 5102 | 172 | 3.371227% |
| C | 5102 | 31 | 0.607605% |
| D | 5102 | 731 | 14.327715% |
Noise dominated data is calculated using 1-second bins in cleaned event files. If a bin has >2000 counts, and if more than 50% of those come from <1% of pixels, then it is considered to be noise-dominated and hence unusable.
| Quadrant | # 1 sec bins | Bins with >0 counts | Bins with >2000 counts | High rate bins dominated by noise | Noise dominated (total time) | Noise dominated (detector-on time) | Marked lightcurve |
|---|---|---|---|---|---|---|---|
| A | 7045 | 5103 | 4 | 4 | 0.06% | 0.08% | 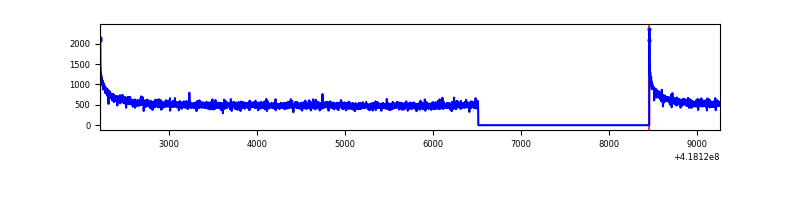 |
| B | 7045 | 5103 | 134 | 134 | 1.90% | 2.63% | 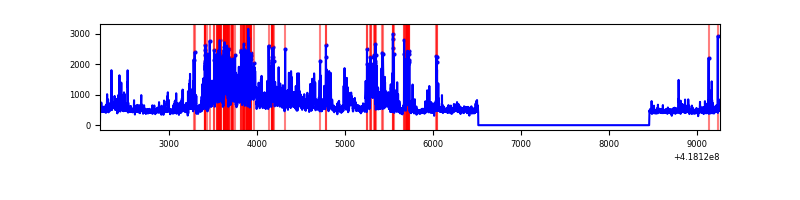 |
| C | 7045 | 5103 | 27 | 27 | 0.38% | 0.53% | 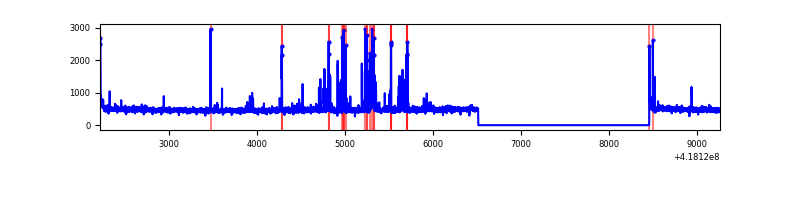 |
| D | 7045 | 5103 | 274 | 274 | 3.89% | 5.37% | 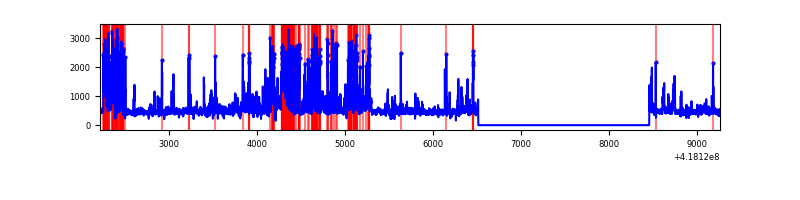 |
Top three noisy pixels from each quadrant. If the there are fewer than three noisy pixels in the level2.evt file, extra rows are filled as -1
| Pixel properties | Quadrant properties | ||||||
|---|---|---|---|---|---|---|---|
| Quadrant | DetID | PixID | Counts | Sigma | Mean | Median | Sigma |
| A | 10 | 83 | 490343 | 4264.19 | 563 | 552 | 114.9 |
| A | 13 | 254 | 6755 | 54.0 | 563 | 552 | 114.9 |
| A | 3 | 137 | 6052 | 47.88 | 563 | 552 | 114.9 |
| B | 0 | 190 | 1190451 | 11124.7 | 551 | 533 | 107.0 |
| B | 3 | 112 | 156087 | 1454.3 | 551 | 533 | 107.0 |
| B | 0 | 229 | 128714 | 1198.38 | 551 | 533 | 107.0 |
| C | 15 | 214 | 226684 | 1774.12 | 543 | 545 | 127.5 |
| C | 14 | 254 | 222510 | 1741.38 | 543 | 545 | 127.5 |
| C | 0 | 10 | 24509 | 188.0 | 543 | 545 | 127.5 |
| D | 12 | 227 | 871299 | 6914.43 | 510 | 495 | 125.9 |
| D | 12 | 128 | 255750 | 2026.8 | 510 | 495 | 125.9 |
| D | 12 | 191 | 155709 | 1232.44 | 510 | 495 | 125.9 |
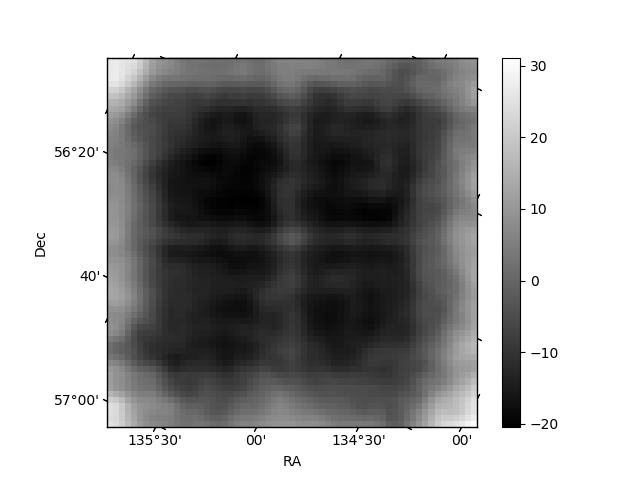
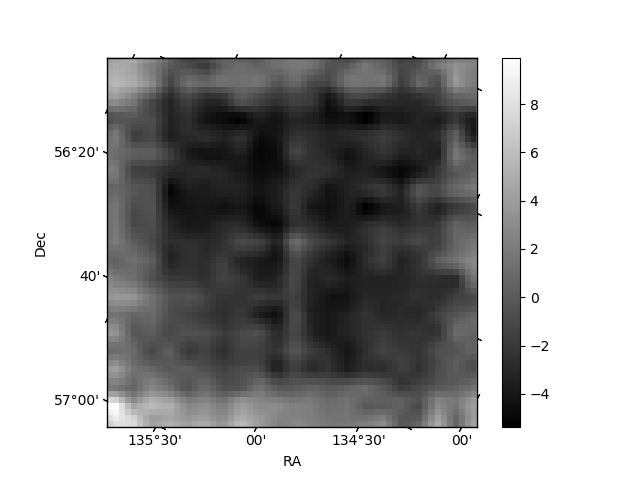
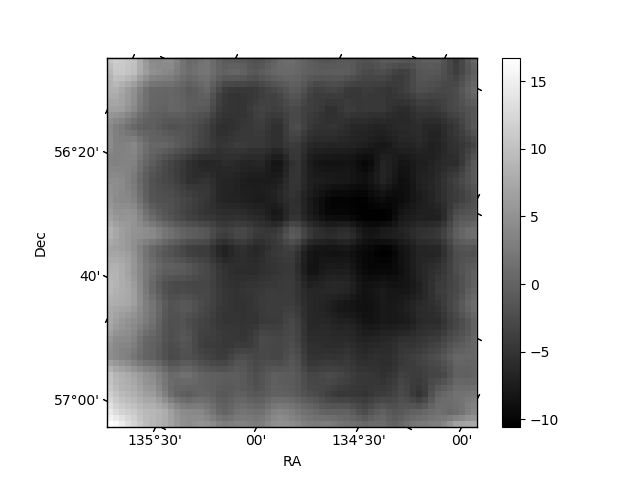
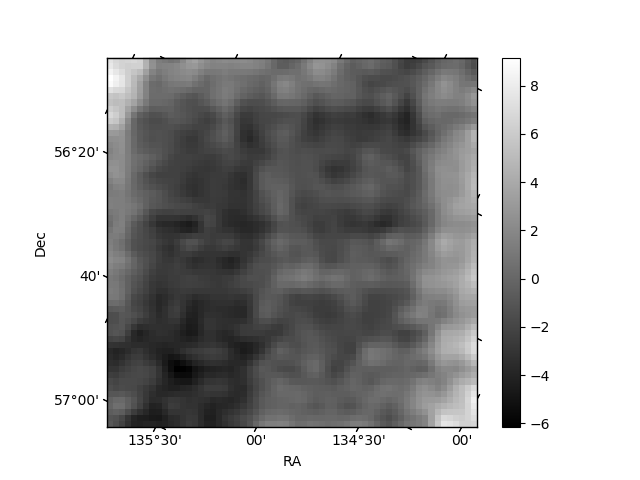
Histogram calculated using DETX and DETY for each event in the final _common_clean file
| Quadrant A | 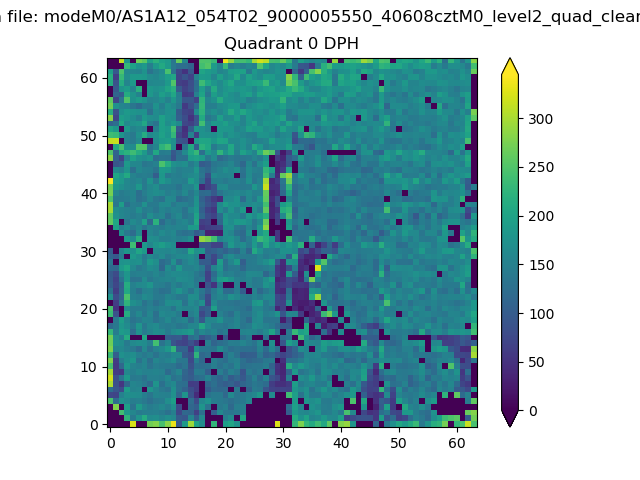 |
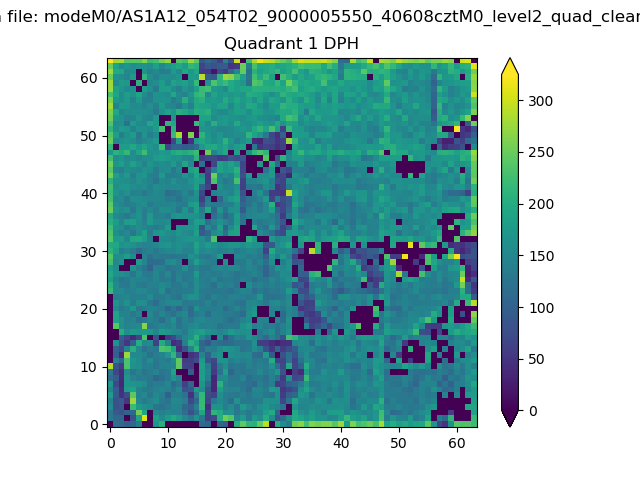 |
Quadrant B |
|---|---|---|---|
| Quadrant D | 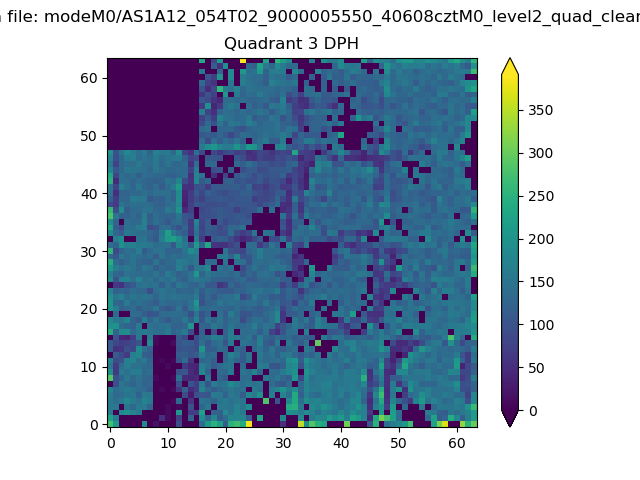 |
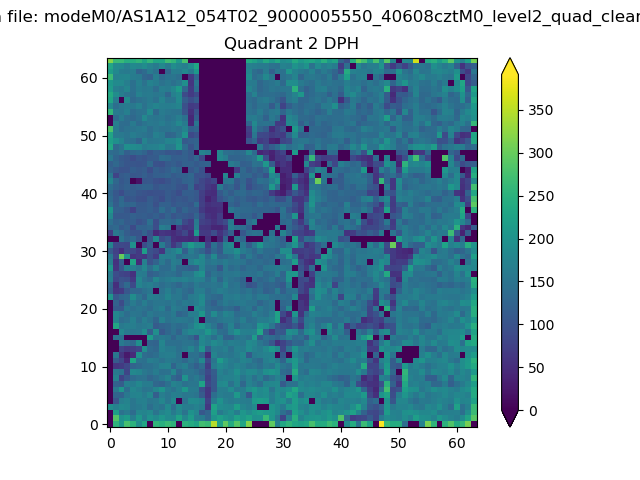 |
Quadrant C |
| Plot type | Count rate plots | Images |
|---|---|---|
| Comparison with Poisson distribution Blue bars denote a histogram of data divided into 1 sec bins. Red curve is a Poisson curve with rate = median count rate of data. |
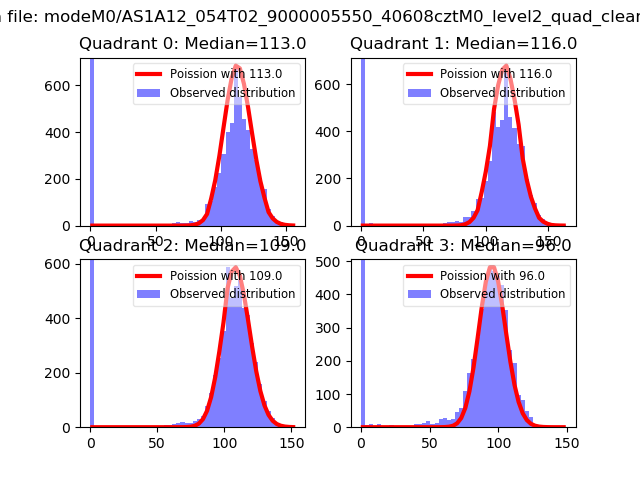 |
 |
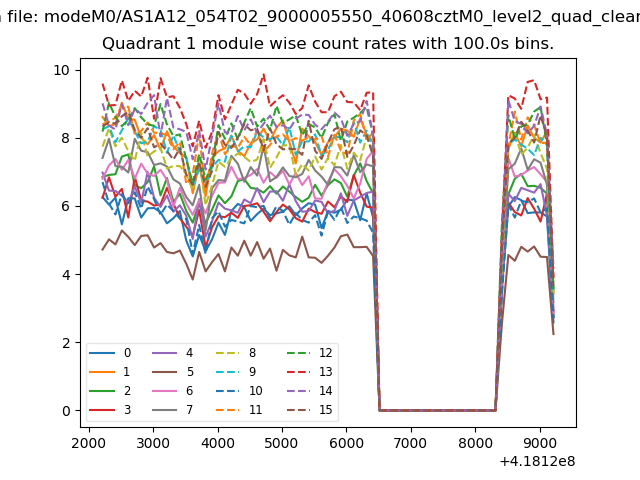
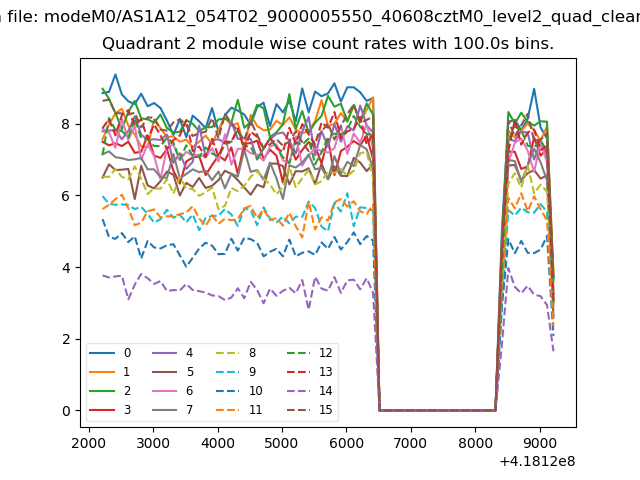
| Quadrant-wise count rates Data is divided into 100 sec bins |
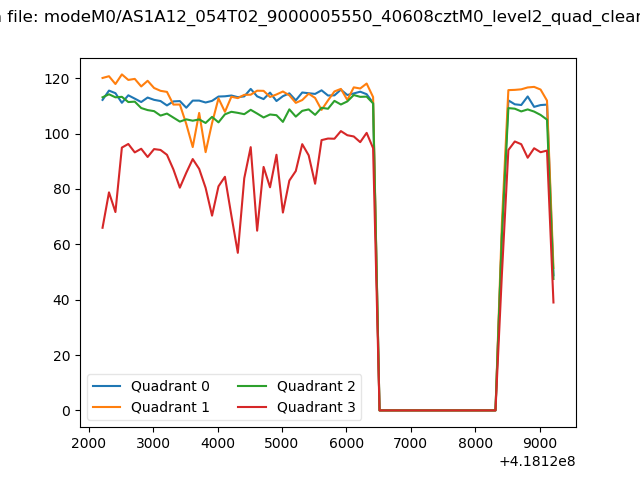 |
|
| Module-wise count rates for Quadrant A Data is divided into 100 sec bins |
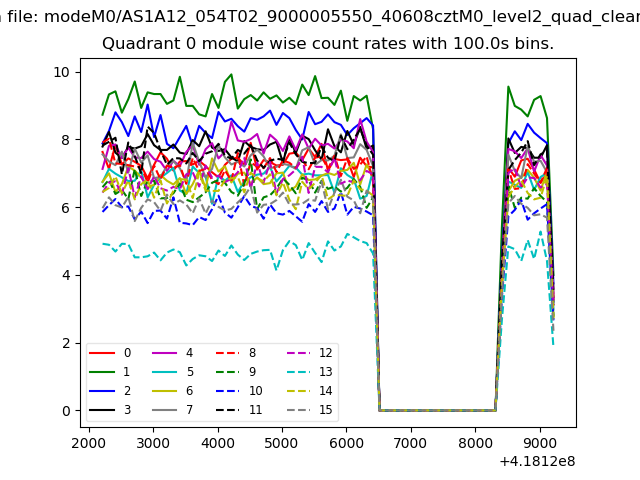 |
 |
| Module-wise count rates for Quadrant B Data is divided into 100 sec bins |
 |
 |
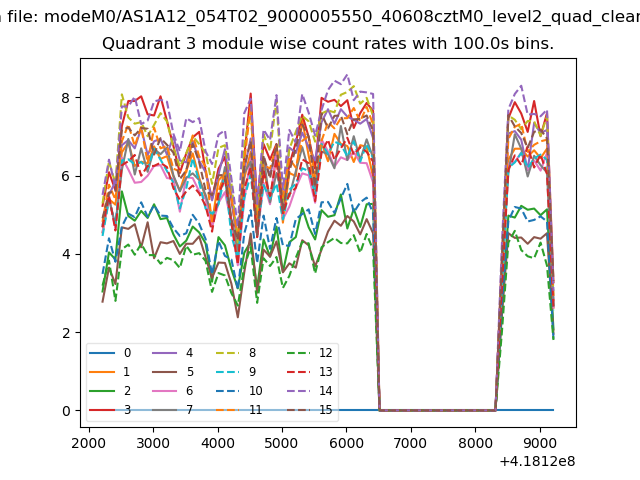
| Module-wise count rates for Quadrant C Data is divided into 100 sec bins |
 |
 |
| Module-wise count rates for Quadrant D Data is divided into 100 sec bins |
 |
 |
| Parameter | Plot |
|---|---|
| CZT HV Monitor | 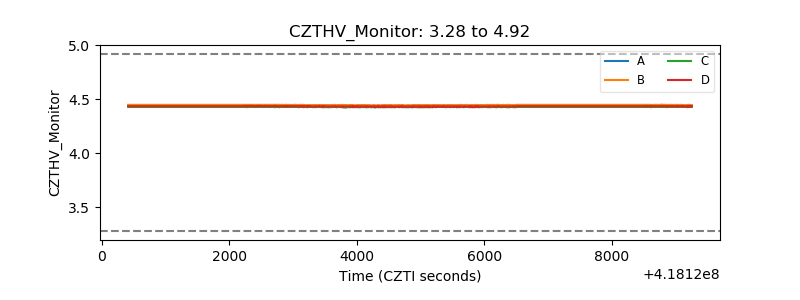 |
| D_VDD | 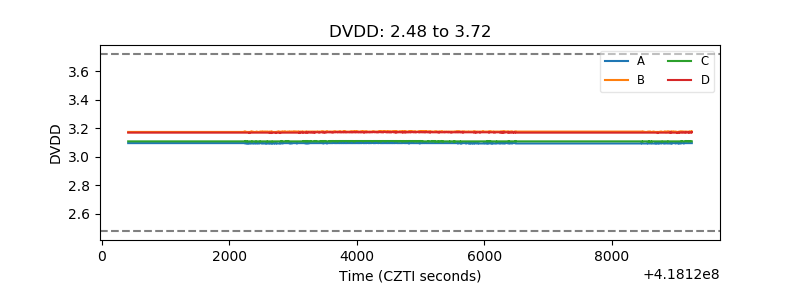 |
| Temperature 1 | 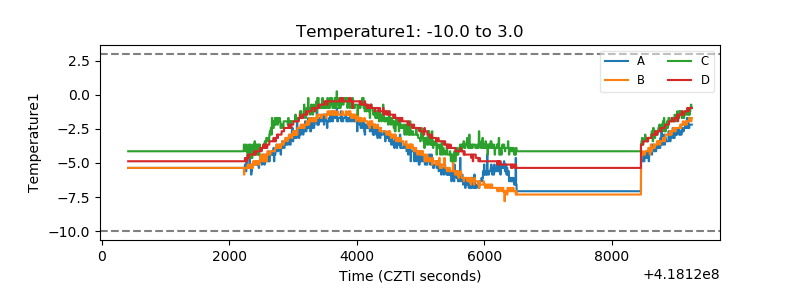 |
| Veto HV Monitor | 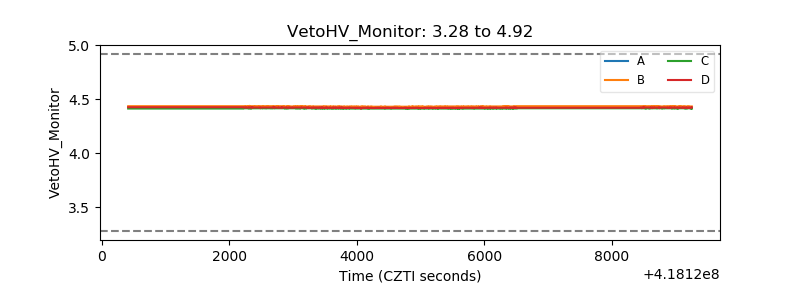 |
| Veto LLD | 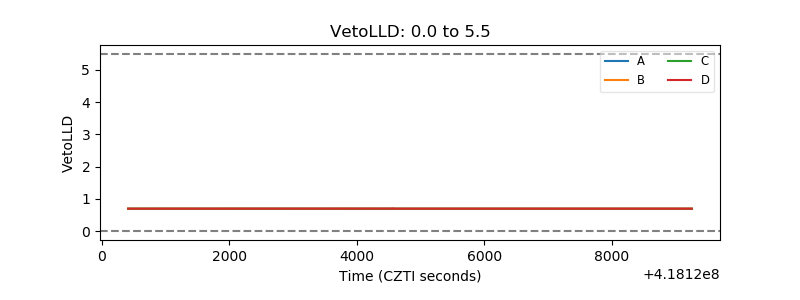 |
| Alpha Counter | 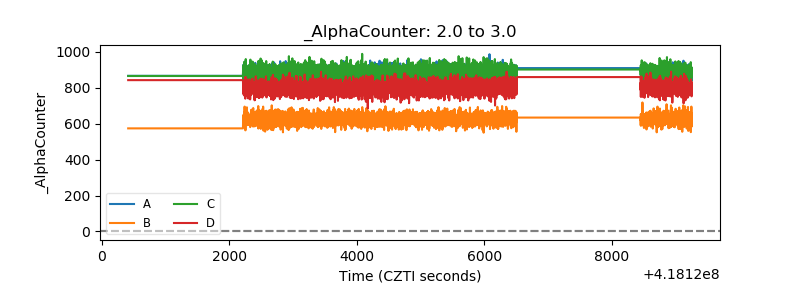 |
| _CPM_Rate | 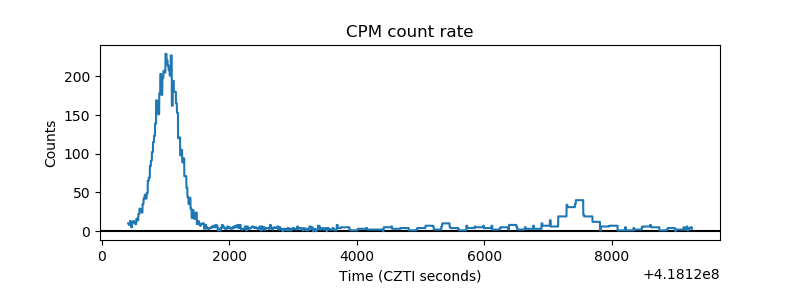 |
| CZT Counter | 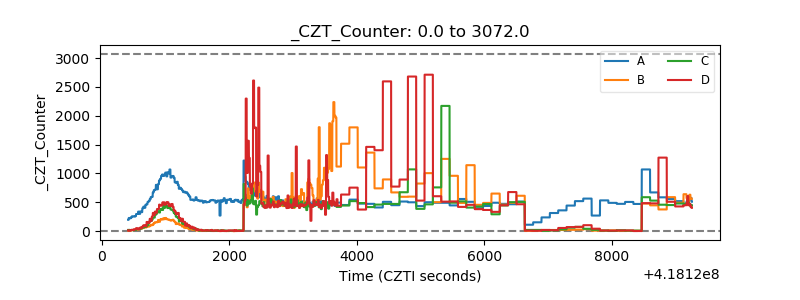 |
| +2.5 Volts monitor | 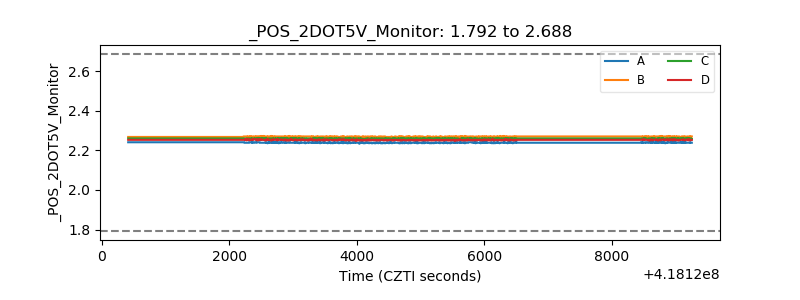 |
| +5 Volts monitor | 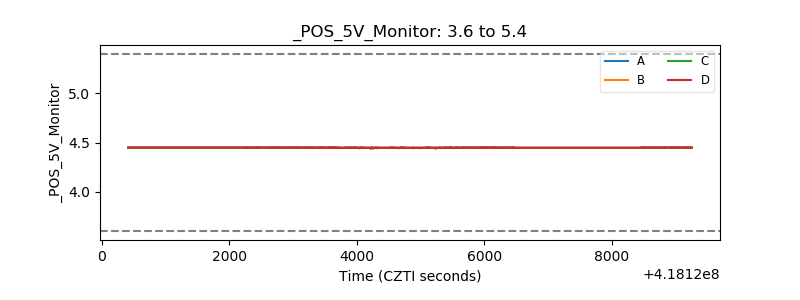 |
| _ROLL_ROT | 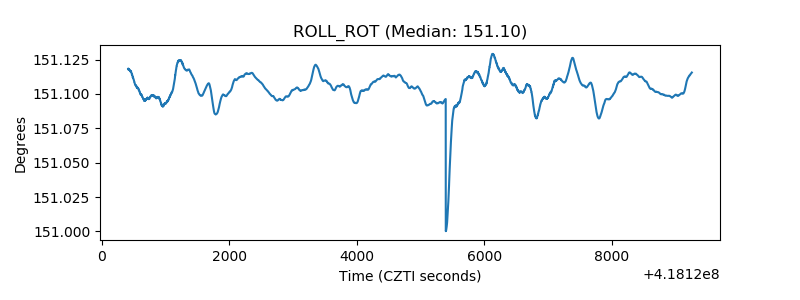 |
| _Roll_DEC | 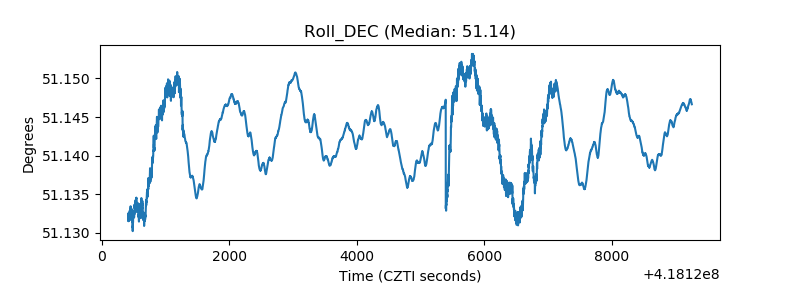 |
| _Roll_RA | 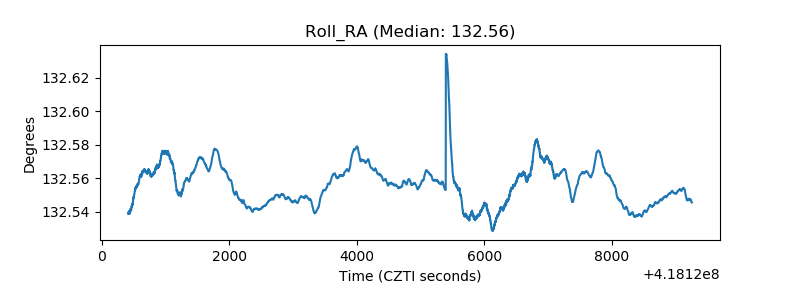 |
| Veto Counter | 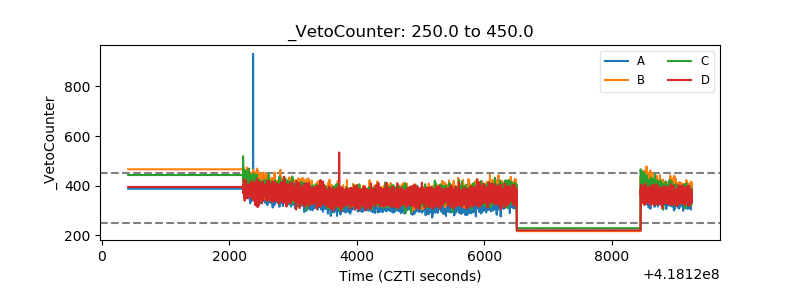 |