| Param | Original file | Final file |
|---|---|---|
| Filename | modeM0/AS1A12_054T02_9000005550_40609cztM0_level2.fits | modeM0/AS1A12_054T02_9000005550_40609cztM0_level2_quad_clean.evt |
| Size (bytes) | 401,181,120 | 90,529,920 |
| Size | 382.6 MB | 86.3 MB |
| Events in quadrant A | 2,974,549 | 633,890 |
| Events in quadrant B | 3,224,070 | 640,504 |
| Events in quadrant C | 3,000,096 | 604,811 |
| Events in quadrant D | 5,204,064 | 459,671 |
| Mode SS | |||
|---|---|---|---|
| Quadrant | BADHDUFLAG | Total packets | Discarded packets |
| A | 0 | 116 | 0 |
| B | 0 | 116 | 0 |
| C | 0 | 116 | 0 |
| D | 0 | 116 | 0 |
| Mode M0 | |||
|---|---|---|---|
| Quadrant | BADHDUFLAG | Total packets | Discarded packets |
| A | 0 | 12352 | 3 |
| B | 0 | 13316 | 2 |
| C | 0 | 12597 | 2 |
| D | 0 | 19417 | 2 |
| Mode M9 | |||
|---|---|---|---|
| Quadrant | BADHDUFLAG | Total packets | Discarded packets |
| A | 0 | 34 | 0 |
| B | 0 | 34 | 0 |
| C | 0 | 34 | 0 |
| D | 0 | 35 | 0 |
| Quadrant | Total seconds | Saturated seconds | Saturation percentage |
|---|---|---|---|
| A | 5746 | 12 | 0.208841% |
| B | 5746 | 70 | 1.218239% |
| C | 5746 | 71 | 1.235642% |
| D | 5746 | 1259 | 21.910895% |
Noise dominated data is calculated using 1-second bins in cleaned event files. If a bin has >2000 counts, and if more than 50% of those come from <1% of pixels, then it is considered to be noise-dominated and hence unusable.
| Quadrant | # 1 sec bins | Bins with >0 counts | Bins with >2000 counts | High rate bins dominated by noise | Noise dominated (total time) | Noise dominated (detector-on time) | Marked lightcurve |
|---|---|---|---|---|---|---|---|
| A | 7359 | 5747 | 4 | 4 | 0.05% | 0.07% | 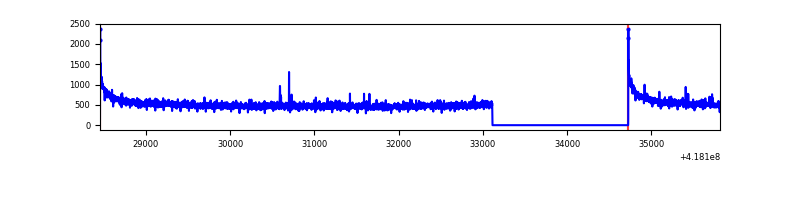 |
| B | 7359 | 5747 | 60 | 60 | 0.82% | 1.04% | 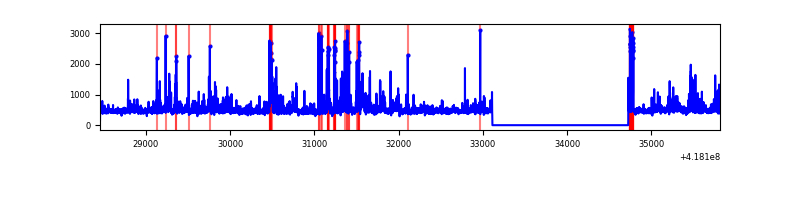 |
| C | 7359 | 5747 | 63 | 63 | 0.86% | 1.10% | 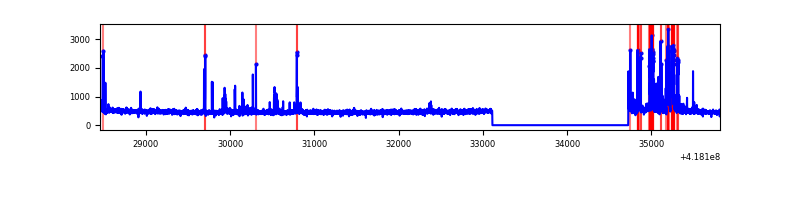 |
| D | 7359 | 5747 | 397 | 397 | 5.39% | 6.91% | 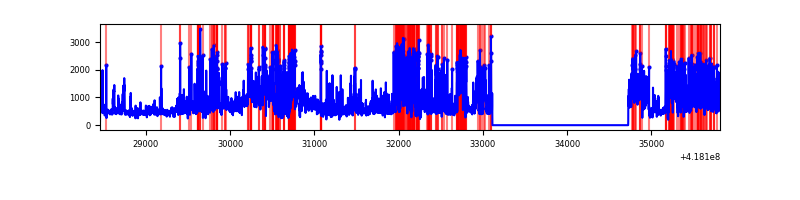 |
Top three noisy pixels from each quadrant. If the there are fewer than three noisy pixels in the level2.evt file, extra rows are filled as -1
| Pixel properties | Quadrant properties | ||||||
|---|---|---|---|---|---|---|---|
| Quadrant | DetID | PixID | Counts | Sigma | Mean | Median | Sigma |
| A | 10 | 83 | 534058 | 4123.4 | 623 | 609 | 129.4 |
| A | 12 | 189 | 17008 | 126.76 | 623 | 609 | 129.4 |
| A | 6 | 10 | 8750 | 62.93 | 623 | 609 | 129.4 |
| B | 0 | 190 | 254873 | 2131.29 | 615 | 597 | 119.3 |
| B | 0 | 229 | 186071 | 1554.6 | 615 | 597 | 119.3 |
| B | 5 | 255 | 153831 | 1284.37 | 615 | 597 | 119.3 |
| C | 14 | 254 | 328244 | 2331.83 | 604 | 607 | 140.5 |
| C | 15 | 214 | 252240 | 1790.9 | 604 | 607 | 140.5 |
| C | 3 | 233 | 16748 | 114.88 | 604 | 607 | 140.5 |
| D | 12 | 227 | 1173705 | 8667.75 | 549 | 533 | 135.3 |
| D | 2 | 249 | 1017582 | 7514.27 | 549 | 533 | 135.3 |
| D | 12 | 191 | 200056 | 1474.14 | 549 | 533 | 135.3 |
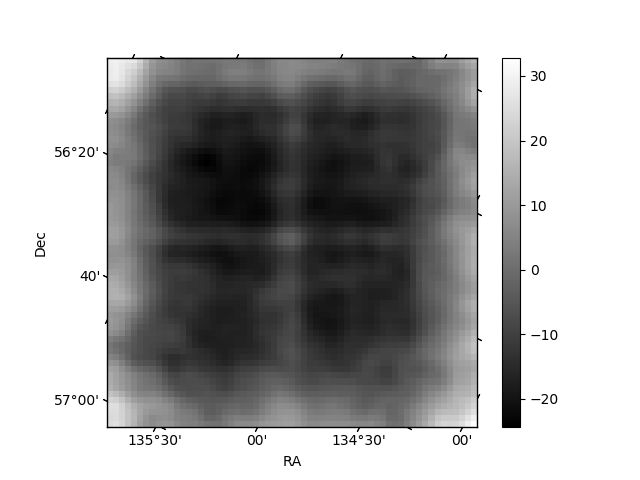
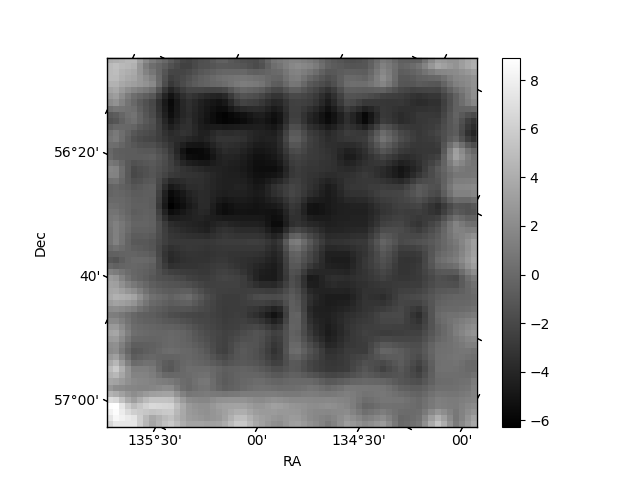
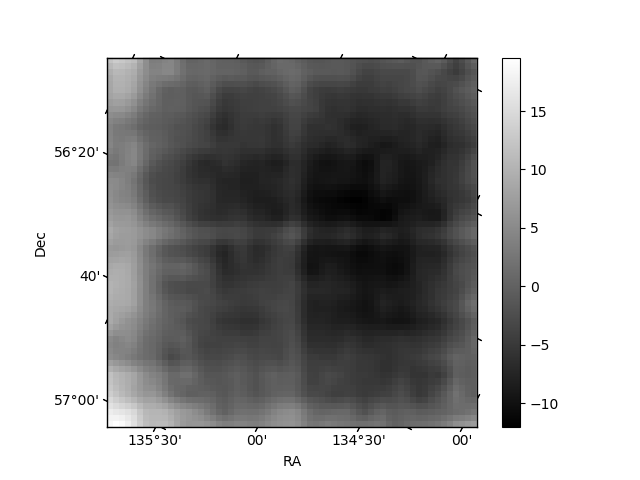
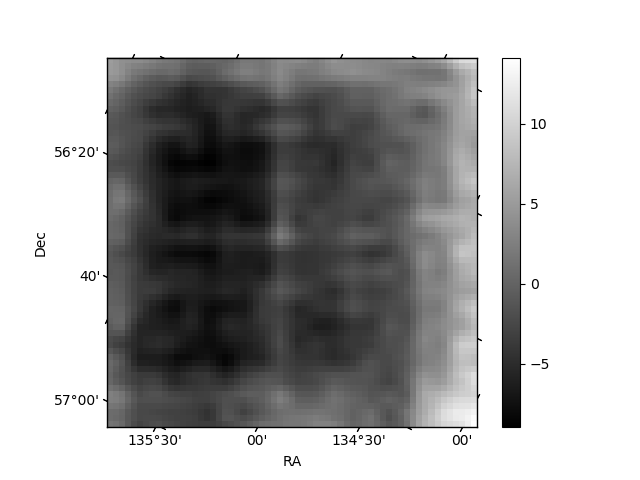
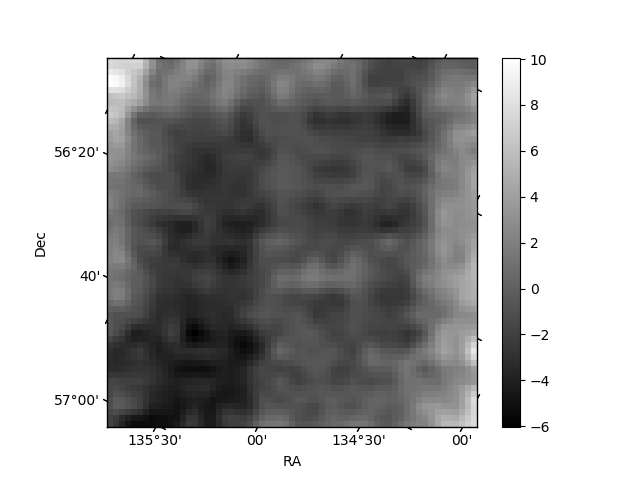
Histogram calculated using DETX and DETY for each event in the final _common_clean file
| Quadrant A | 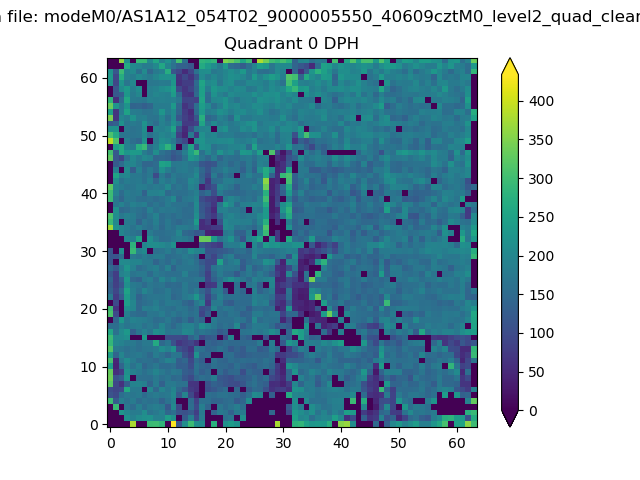 |
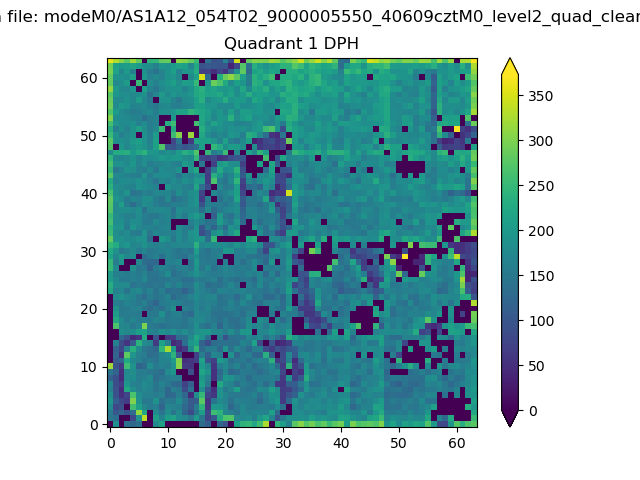 |
Quadrant B |
|---|---|---|---|
| Quadrant D | 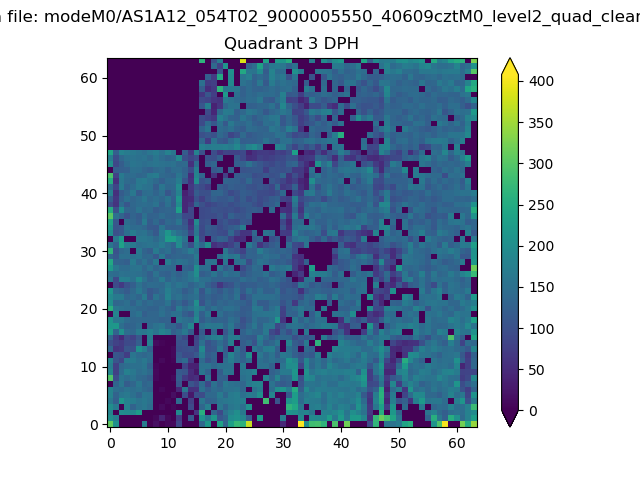 |
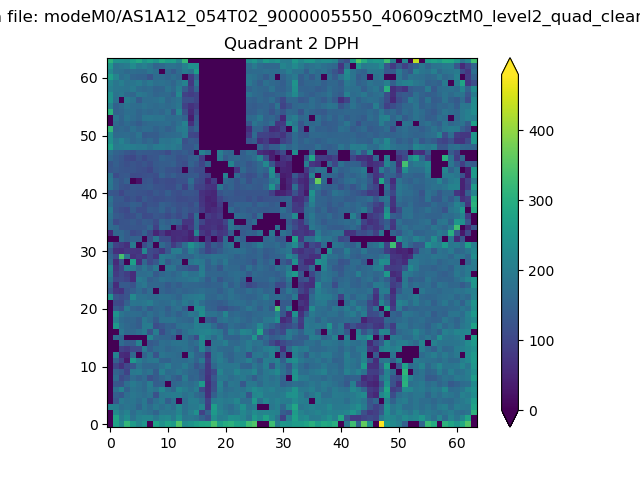 |
Quadrant C |
| Plot type | Count rate plots | Images |
|---|---|---|
| Comparison with Poisson distribution Blue bars denote a histogram of data divided into 1 sec bins. Red curve is a Poisson curve with rate = median count rate of data. |
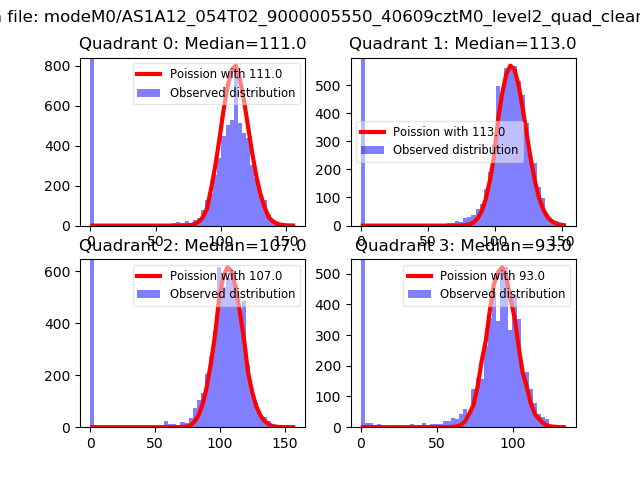 |
 |
| Quadrant-wise count rates Data is divided into 100 sec bins |
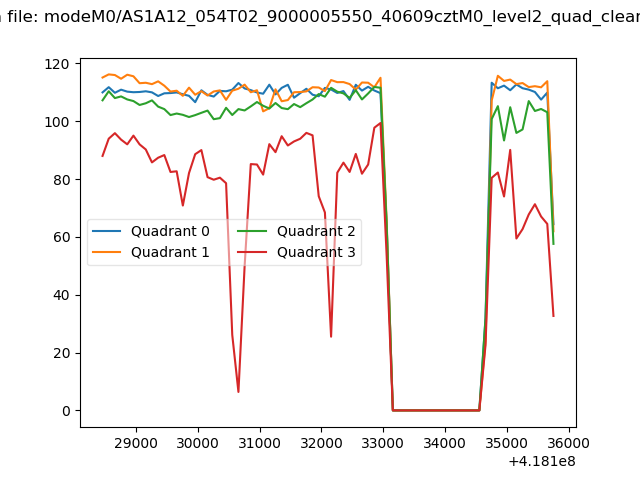 |
|
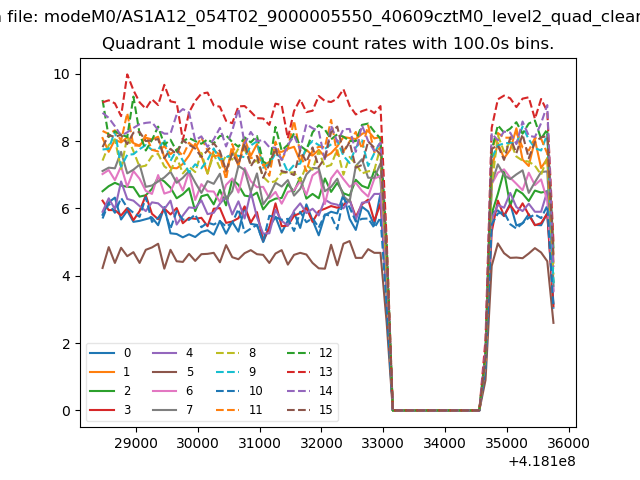
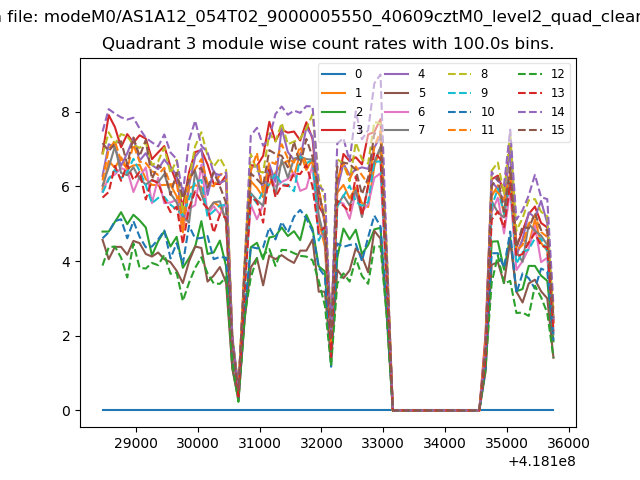
| Module-wise count rates for Quadrant A Data is divided into 100 sec bins |
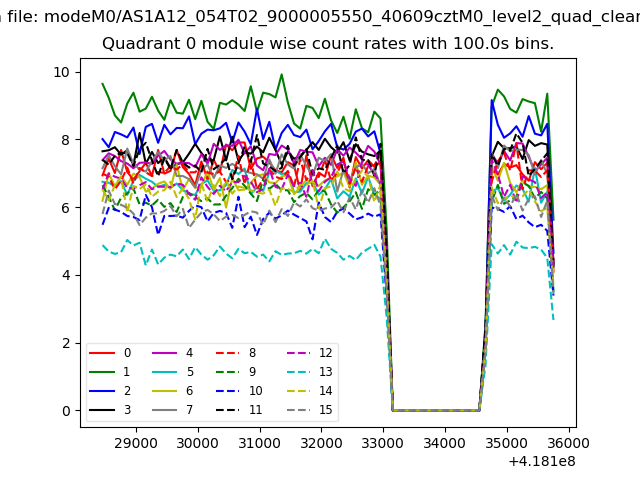 |
 |
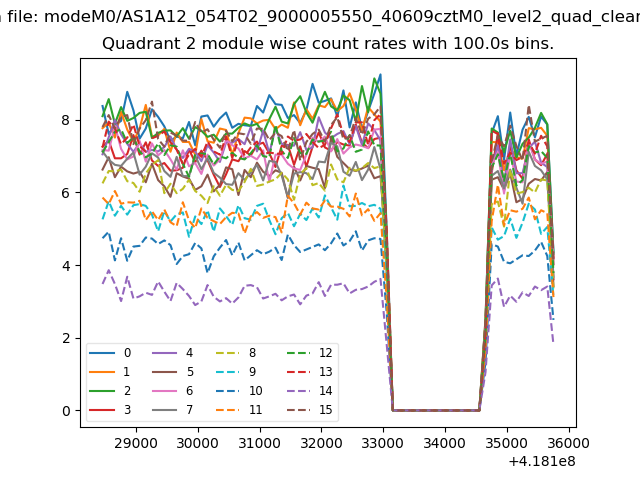
| Module-wise count rates for Quadrant B Data is divided into 100 sec bins |
 |
 |
| Module-wise count rates for Quadrant C Data is divided into 100 sec bins |
 |
 |
| Module-wise count rates for Quadrant D Data is divided into 100 sec bins |
 |
 |
| Parameter | Plot |
|---|---|
| CZT HV Monitor | 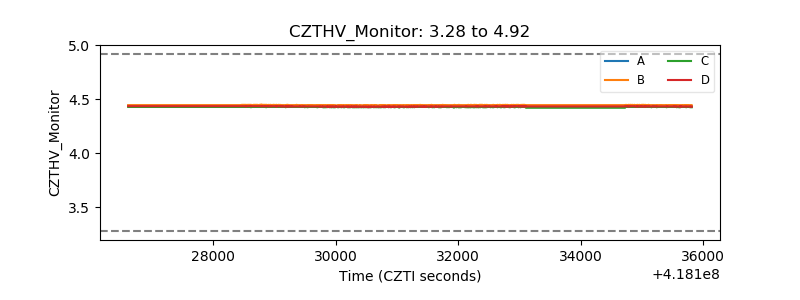 |
| D_VDD | 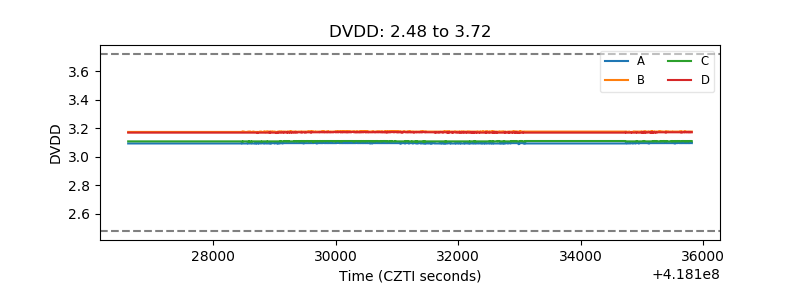 |
| Temperature 1 | 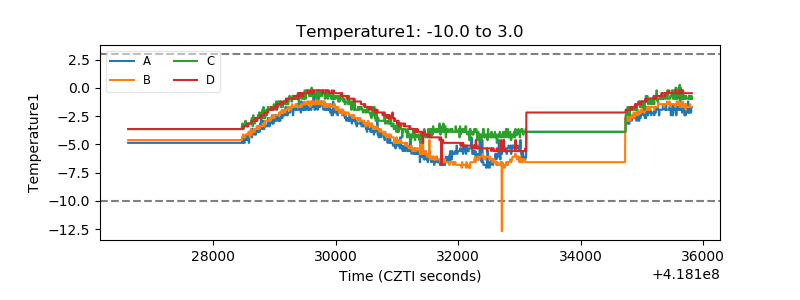 |
| Veto HV Monitor | 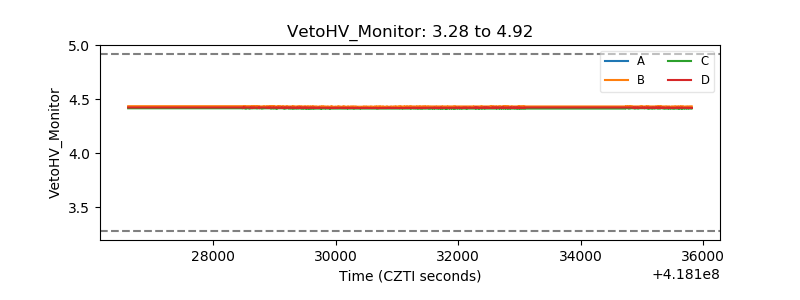 |
| Veto LLD | 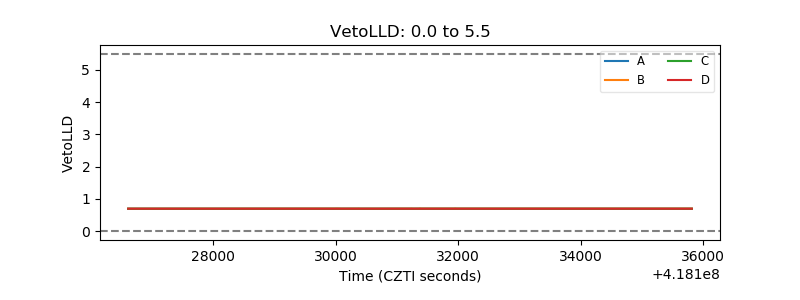 |
| Alpha Counter | 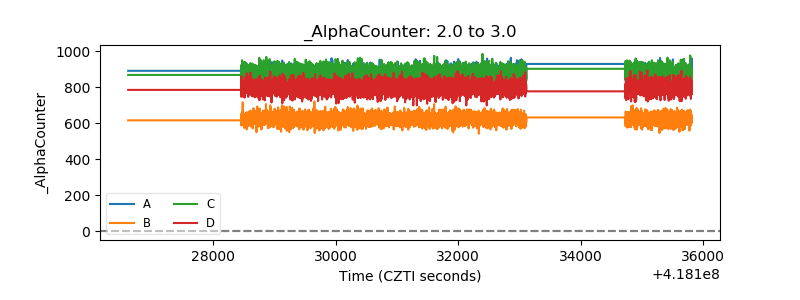 |
| _CPM_Rate | 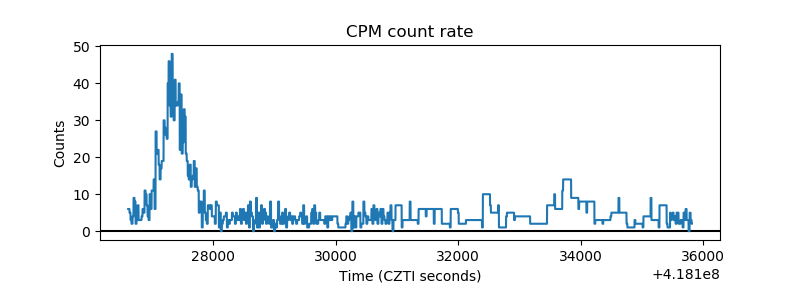 |
| CZT Counter | 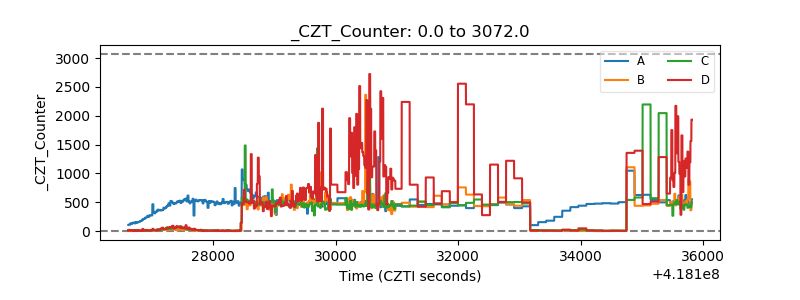 |
| +2.5 Volts monitor | 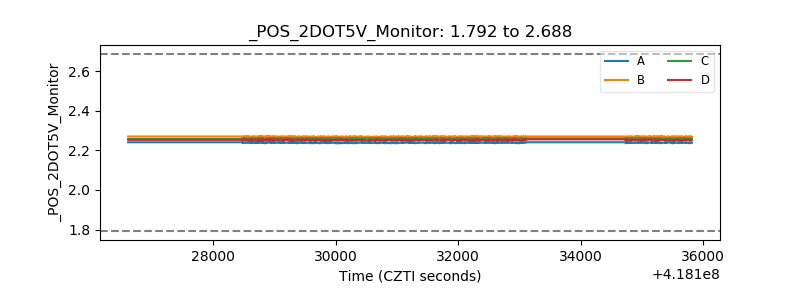 |
| +5 Volts monitor | 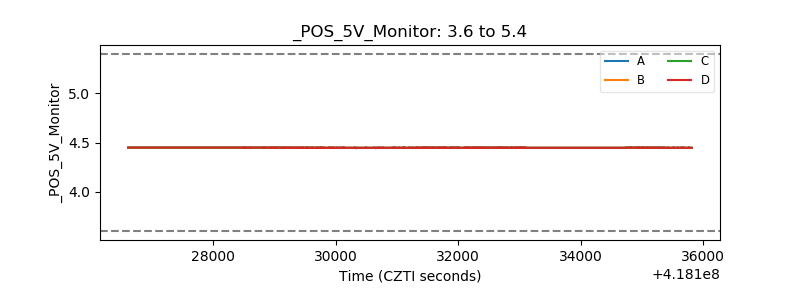 |
| _ROLL_ROT | 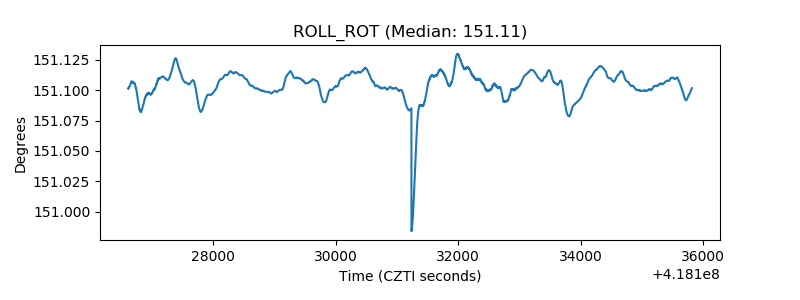 |
| _Roll_DEC | 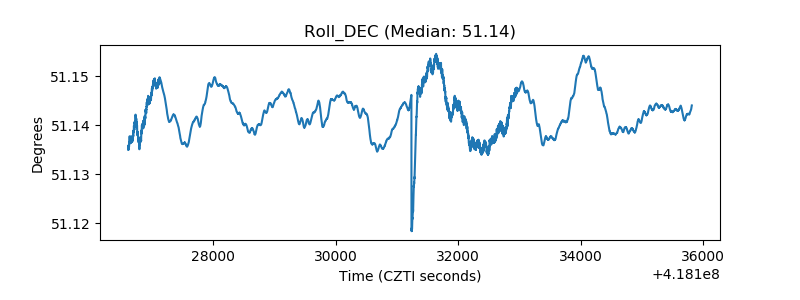 |
| _Roll_RA | 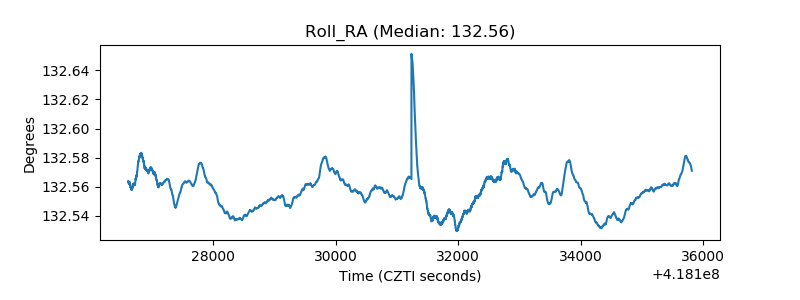 |
| Veto Counter | 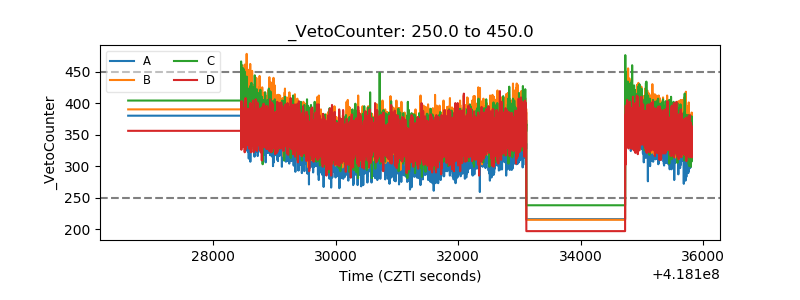 |