| Param | Original file | Final file |
|---|---|---|
| Filename | modeM0/AS1A12_054T02_9000005550_40610cztM0_level2.fits | modeM0/AS1A12_054T02_9000005550_40610cztM0_level2_quad_clean.evt |
| Size (bytes) | 415,391,040 | 90,357,120 |
| Size | 396.1 MB | 86.2 MB |
| Events in quadrant A | 3,013,557 | 633,908 |
| Events in quadrant B | 3,250,957 | 638,303 |
| Events in quadrant C | 3,218,222 | 605,022 |
| Events in quadrant D | 5,442,640 | 453,603 |
| Mode SS | |||
|---|---|---|---|
| Quadrant | BADHDUFLAG | Total packets | Discarded packets |
| A | 0 | 118 | 0 |
| B | 0 | 118 | 0 |
| C | 0 | 118 | 0 |
| D | 0 | 118 | 0 |
| Mode M0 | |||
|---|---|---|---|
| Quadrant | BADHDUFLAG | Total packets | Discarded packets |
| A | 0 | 12483 | 3 |
| B | 0 | 13399 | 2 |
| C | 0 | 13289 | 2 |
| D | 0 | 20174 | 2 |
| Mode M9 | |||
|---|---|---|---|
| Quadrant | BADHDUFLAG | Total packets | Discarded packets |
| A | 0 | 14 | 0 |
| B | 0 | 14 | 0 |
| C | 0 | 14 | 0 |
| D | 0 | 15 | 0 |
| Quadrant | Total seconds | Saturated seconds | Saturation percentage |
|---|---|---|---|
| A | 5790 | 17 | 0.293610% |
| B | 5790 | 59 | 1.018998% |
| C | 5790 | 99 | 1.709845% |
| D | 5790 | 1449 | 25.025907% |
Noise dominated data is calculated using 1-second bins in cleaned event files. If a bin has >2000 counts, and if more than 50% of those come from <1% of pixels, then it is considered to be noise-dominated and hence unusable.
| Quadrant | # 1 sec bins | Bins with >0 counts | Bins with >2000 counts | High rate bins dominated by noise | Noise dominated (total time) | Noise dominated (detector-on time) | Marked lightcurve |
|---|---|---|---|---|---|---|---|
| A | 7163 | 5791 | 5 | 5 | 0.07% | 0.09% |  |
| B | 7163 | 5791 | 48 | 48 | 0.67% | 0.83% | 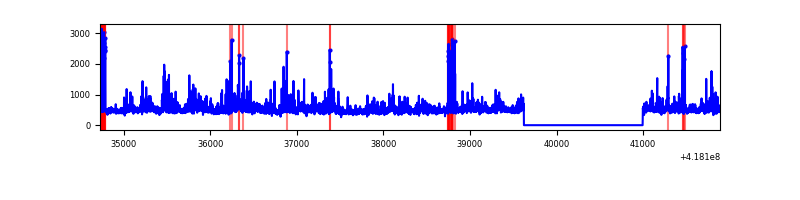 |
| C | 7163 | 5791 | 97 | 97 | 1.35% | 1.68% | 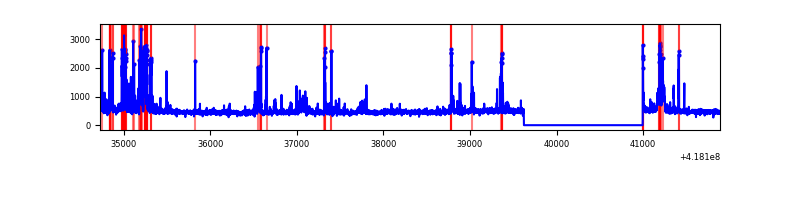 |
| D | 7163 | 5791 | 439 | 439 | 6.13% | 7.58% | 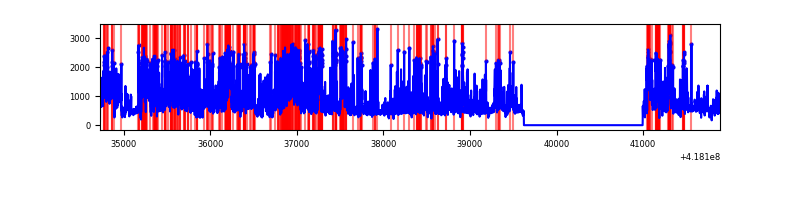 |
Top three noisy pixels from each quadrant. If the there are fewer than three noisy pixels in the level2.evt file, extra rows are filled as -1
| Pixel properties | Quadrant properties | ||||||
|---|---|---|---|---|---|---|---|
| Quadrant | DetID | PixID | Counts | Sigma | Mean | Median | Sigma |
| A | 10 | 83 | 544035 | 4240.19 | 626 | 613 | 128.2 |
| A | 12 | 189 | 19212 | 145.12 | 626 | 613 | 128.2 |
| A | 15 | 237 | 8598 | 62.3 | 626 | 613 | 128.2 |
| B | 0 | 190 | 475710 | 4000.59 | 619 | 601 | 118.8 |
| B | 0 | 229 | 125887 | 1054.95 | 619 | 601 | 118.8 |
| B | 5 | 255 | 115688 | 969.07 | 619 | 601 | 118.8 |
| C | 14 | 254 | 520456 | 3677.42 | 606 | 610 | 141.4 |
| C | 15 | 214 | 250821 | 1770.01 | 606 | 610 | 141.4 |
| C | 12 | 175 | 34747 | 241.49 | 606 | 610 | 141.4 |
| D | 12 | 227 | 957919 | 6956.84 | 552 | 537 | 137.6 |
| D | 2 | 249 | 788261 | 5724.01 | 552 | 537 | 137.6 |
| D | 2 | 250 | 451821 | 3279.26 | 552 | 537 | 137.6 |
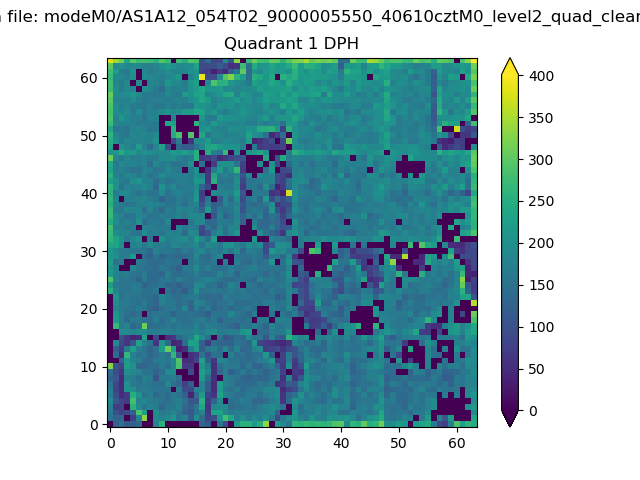
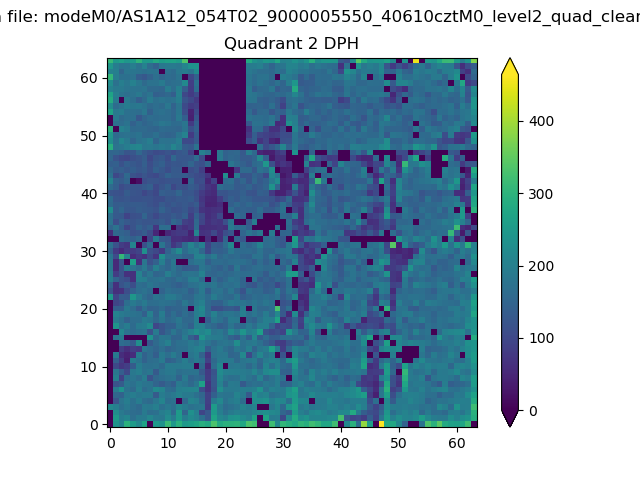
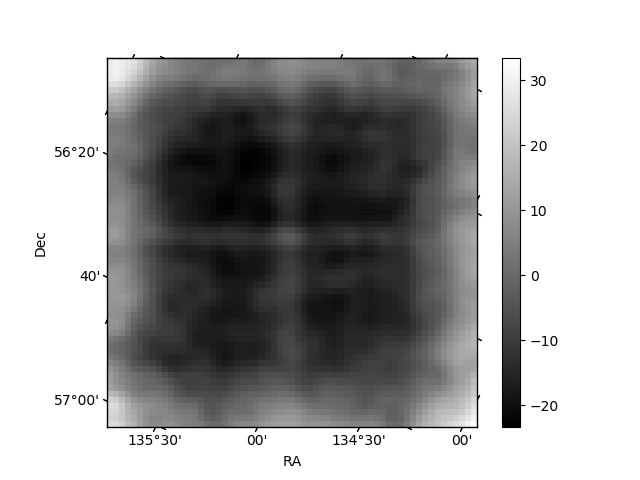
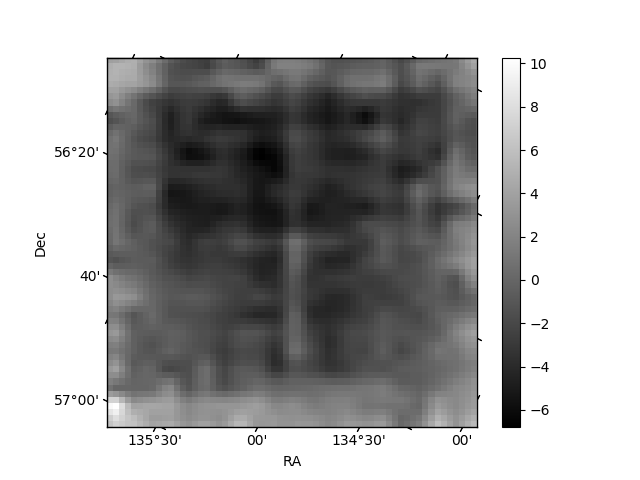
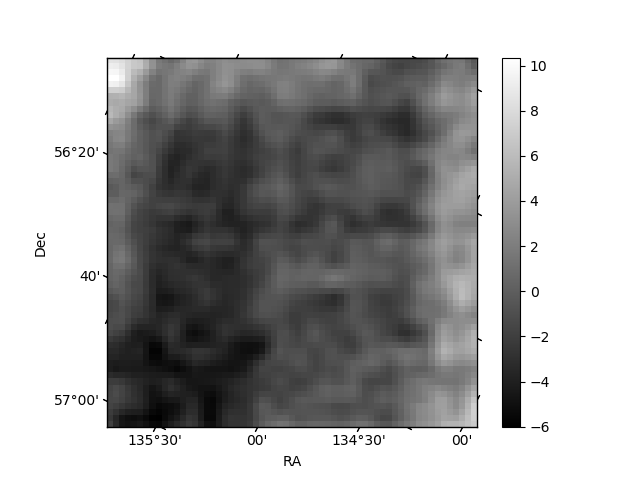
Histogram calculated using DETX and DETY for each event in the final _common_clean file
| Quadrant A | 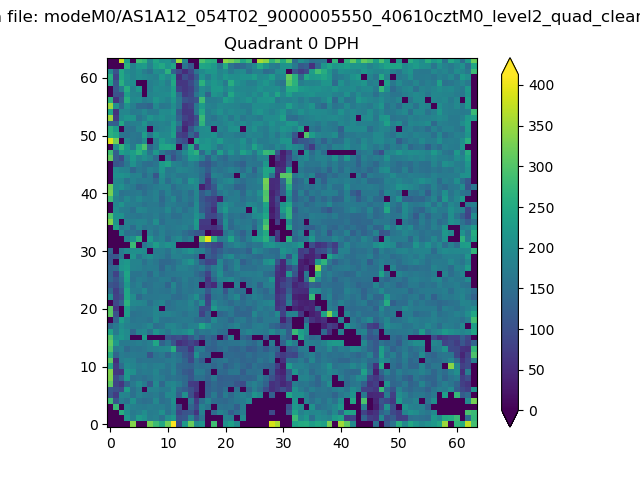 |
 |
Quadrant B |
|---|---|---|---|
| Quadrant D | 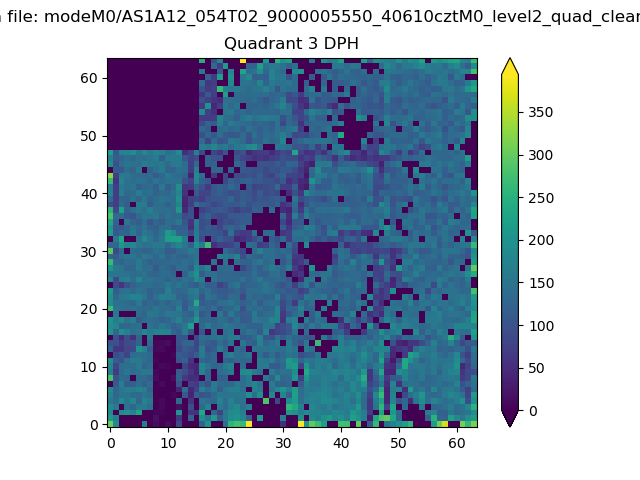 |
 |
Quadrant C |
| Plot type | Count rate plots | Images |
|---|---|---|
| Comparison with Poisson distribution Blue bars denote a histogram of data divided into 1 sec bins. Red curve is a Poisson curve with rate = median count rate of data. |
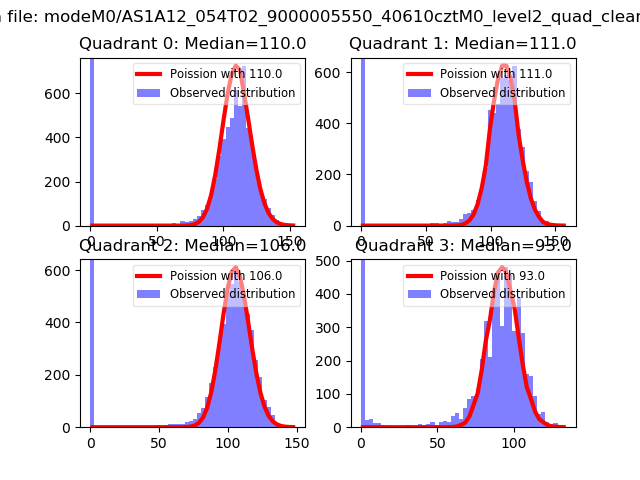 |
 |
| Quadrant-wise count rates Data is divided into 100 sec bins |
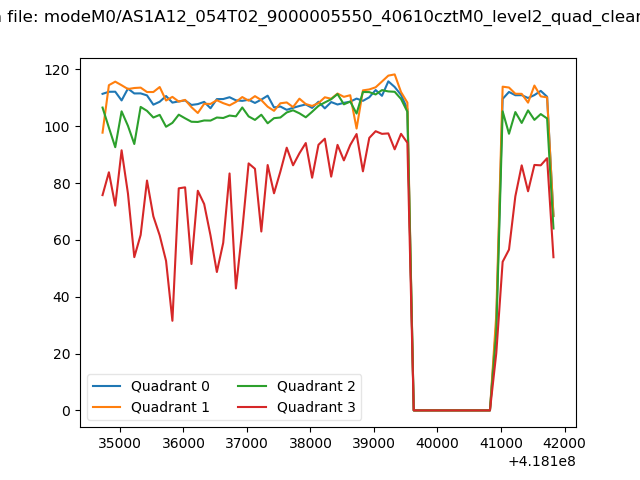 |
|
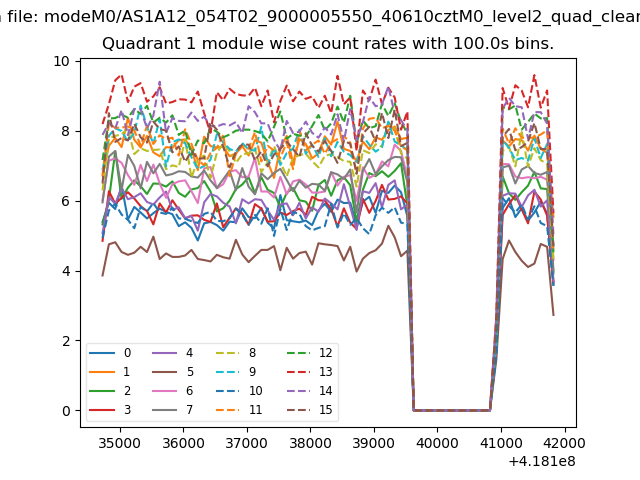
| Module-wise count rates for Quadrant A Data is divided into 100 sec bins |
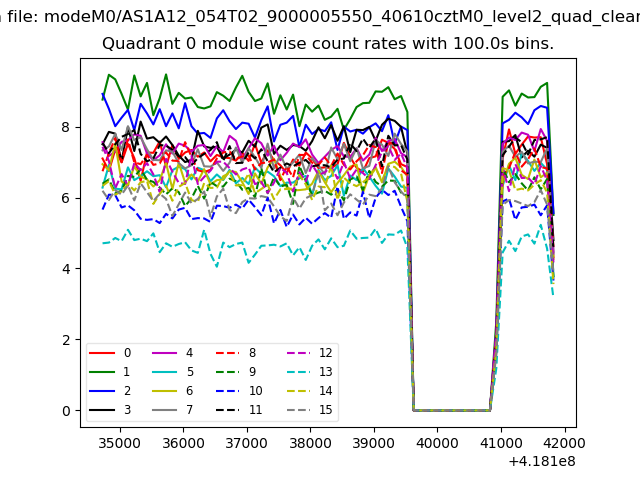 |
 |
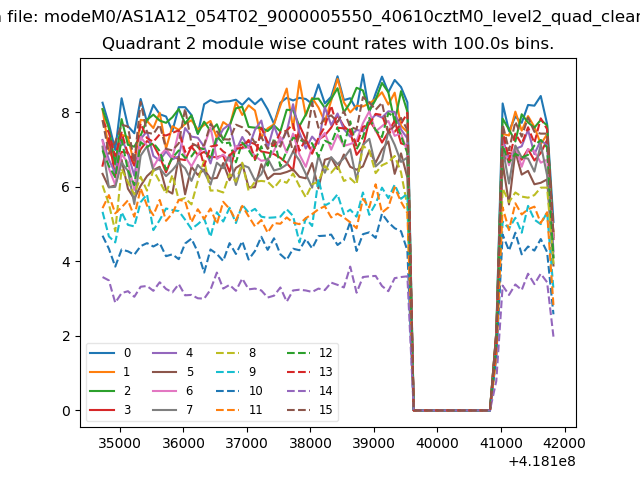
| Module-wise count rates for Quadrant B Data is divided into 100 sec bins |
 |
 |
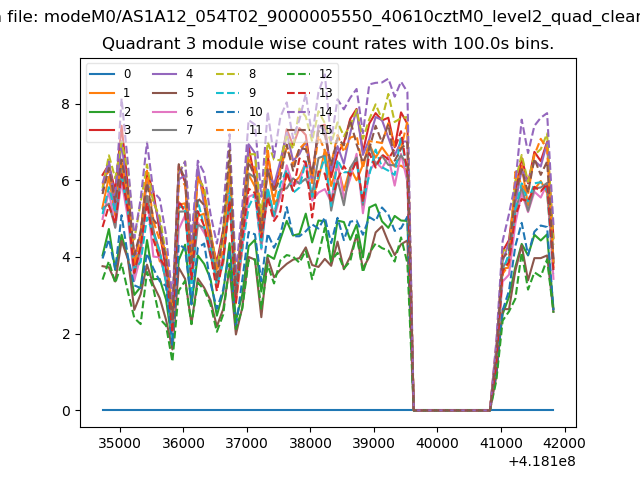
| Module-wise count rates for Quadrant C Data is divided into 100 sec bins |
 |
 |
| Module-wise count rates for Quadrant D Data is divided into 100 sec bins |
 |
 |
| Parameter | Plot |
|---|---|
| CZT HV Monitor | 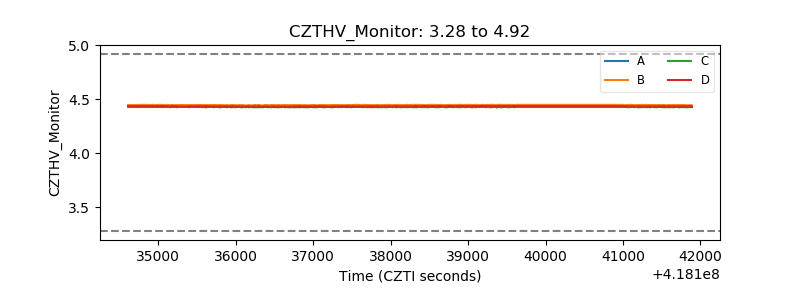 |
| D_VDD | 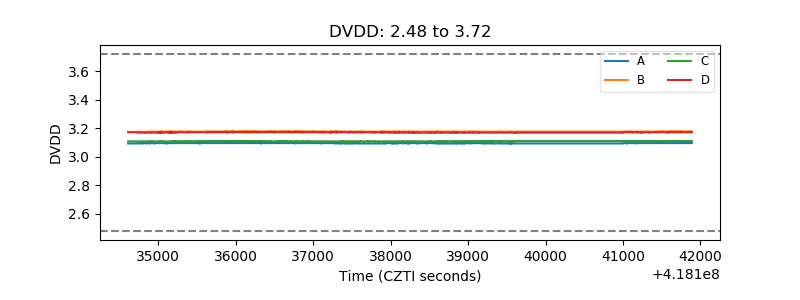 |
| Temperature 1 | 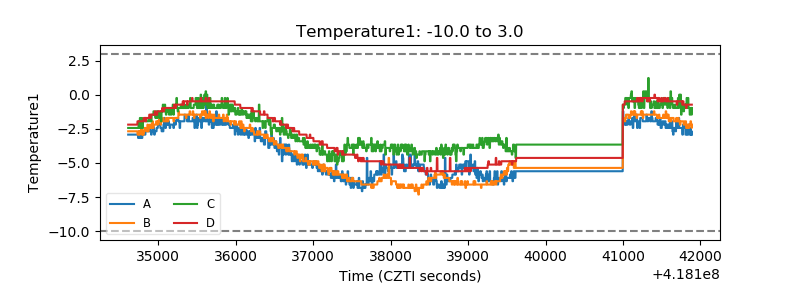 |
| Veto HV Monitor | 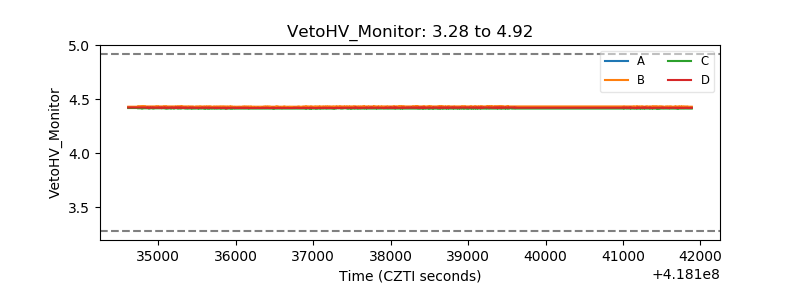 |
| Veto LLD | 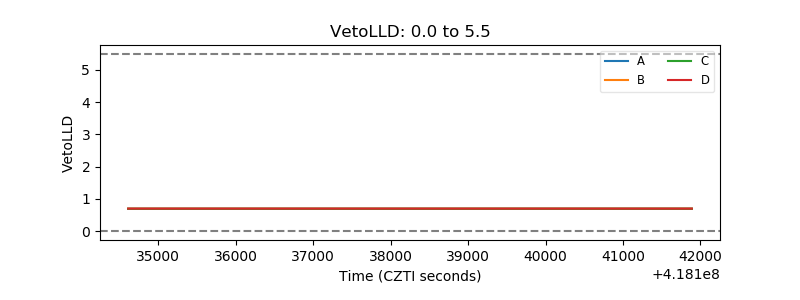 |
| Alpha Counter | 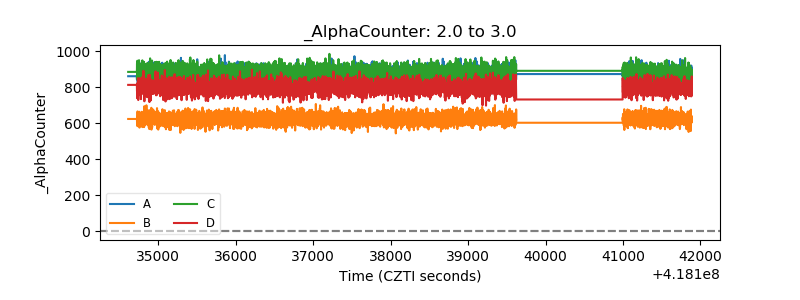 |
| _CPM_Rate | 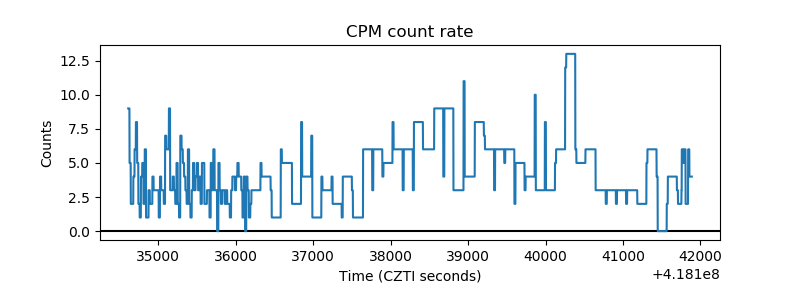 |
| CZT Counter | 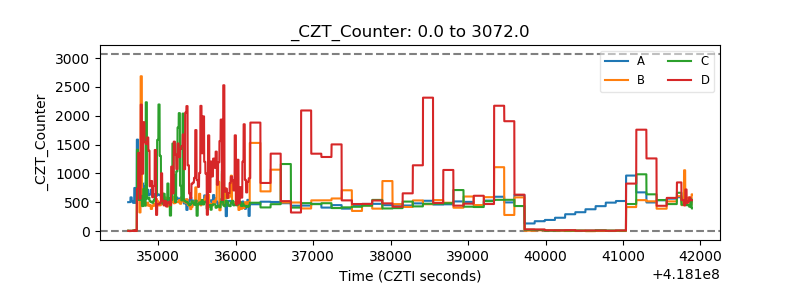 |
| +2.5 Volts monitor | 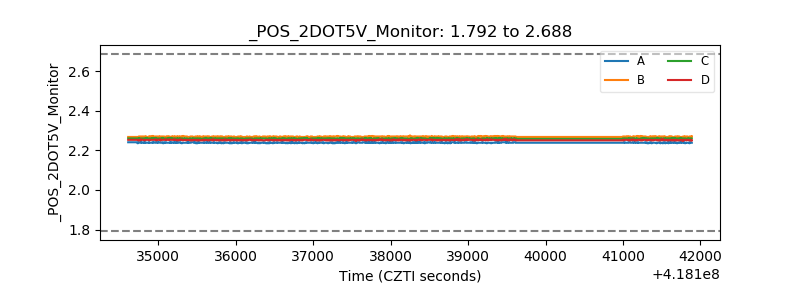 |
| +5 Volts monitor | 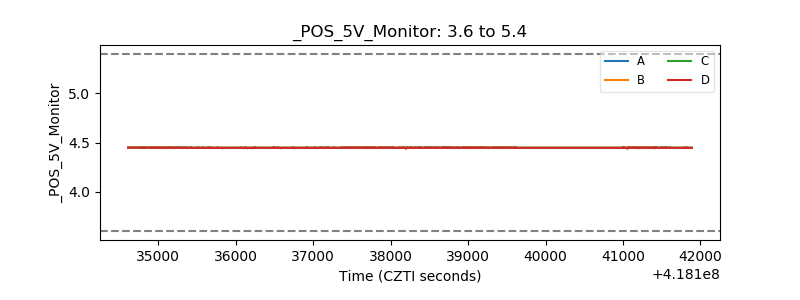 |
| _ROLL_ROT | 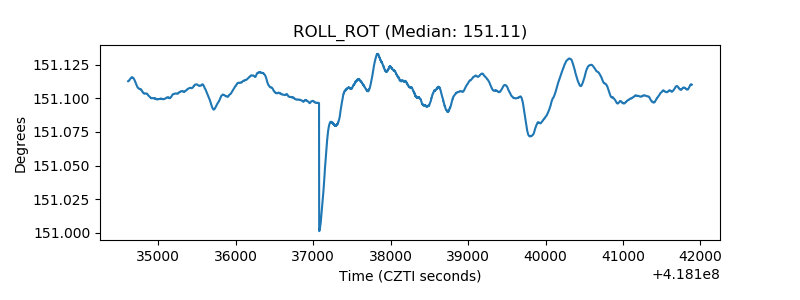 |
| _Roll_DEC | 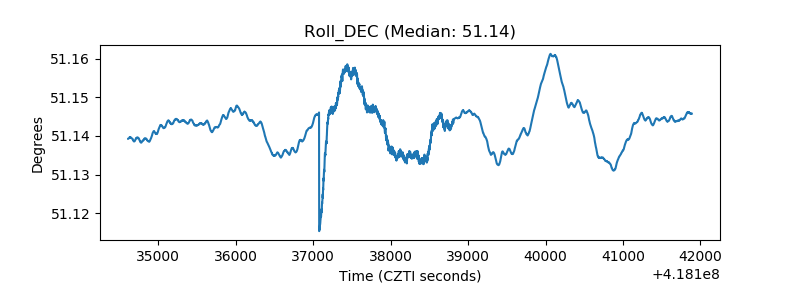 |
| _Roll_RA | 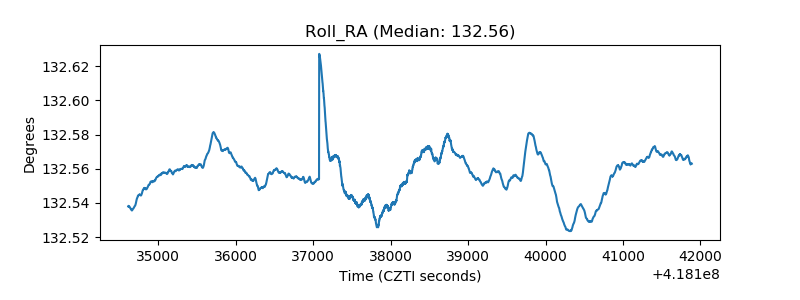 |
| Veto Counter | 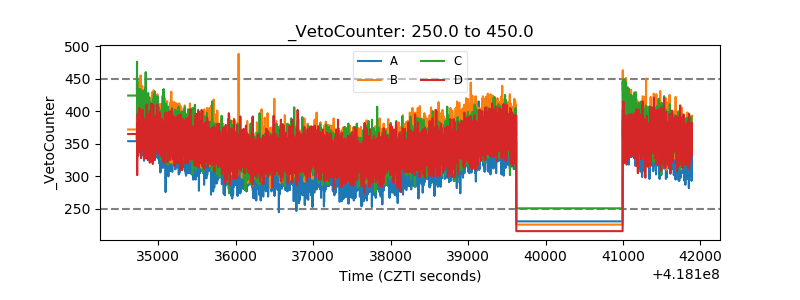 |