| Param | Original file | Final file |
|---|---|---|
| Filename | modeM0/AS1A12_054T02_9000005550_40611cztM0_level2.fits | modeM0/AS1A12_054T02_9000005550_40611cztM0_level2_quad_clean.evt |
| Size (bytes) | 403,758,720 | 94,613,760 |
| Size | 385.1 MB | 90.2 MB |
| Events in quadrant A | 3,350,869 | 652,902 |
| Events in quadrant B | 3,550,363 | 658,527 |
| Events in quadrant C | 3,210,471 | 627,079 |
| Events in quadrant D | 4,365,530 | 505,306 |
| Mode SS | |||
|---|---|---|---|
| Quadrant | BADHDUFLAG | Total packets | Discarded packets |
| A | 0 | 124 | 0 |
| B | 0 | 124 | 0 |
| C | 0 | 124 | 0 |
| D | 0 | 124 | 0 |
| Mode M0 | |||
|---|---|---|---|
| Quadrant | BADHDUFLAG | Total packets | Discarded packets |
| A | 0 | 13765 | 3 |
| B | 0 | 14442 | 2 |
| C | 0 | 13391 | 2 |
| D | 0 | 17038 | 2 |
| Mode M9 | |||
|---|---|---|---|
| Quadrant | BADHDUFLAG | Total packets | Discarded packets |
| A | 0 | 18 | 0 |
| B | 0 | 18 | 0 |
| C | 0 | 18 | 0 |
| D | 0 | 19 | 0 |
| Quadrant | Total seconds | Saturated seconds | Saturation percentage |
|---|---|---|---|
| A | 6016 | 17 | 0.282580% |
| B | 6016 | 91 | 1.512633% |
| C | 6016 | 57 | 0.947473% |
| D | 6016 | 1077 | 17.902261% |
Noise dominated data is calculated using 1-second bins in cleaned event files. If a bin has >2000 counts, and if more than 50% of those come from <1% of pixels, then it is considered to be noise-dominated and hence unusable.
| Quadrant | # 1 sec bins | Bins with >0 counts | Bins with >2000 counts | High rate bins dominated by noise | Noise dominated (total time) | Noise dominated (detector-on time) | Marked lightcurve |
|---|---|---|---|---|---|---|---|
| A | 7328 | 6017 | 6 | 6 | 0.08% | 0.10% | 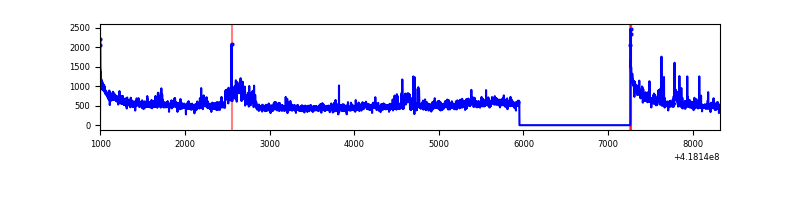 |
| B | 7328 | 6017 | 62 | 62 | 0.85% | 1.03% | 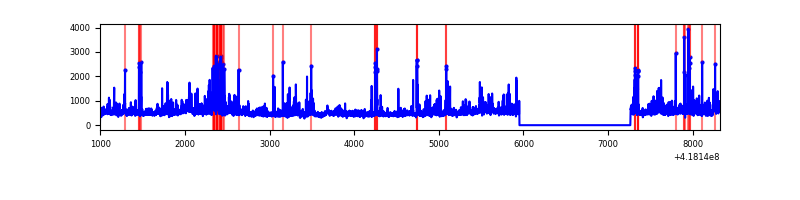 |
| C | 7328 | 6017 | 57 | 57 | 0.78% | 0.95% | 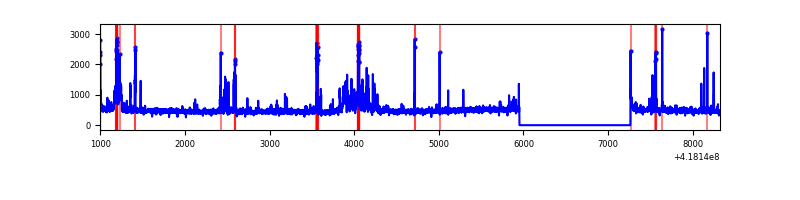 |
| D | 7328 | 6017 | 231 | 231 | 3.15% | 3.84% | 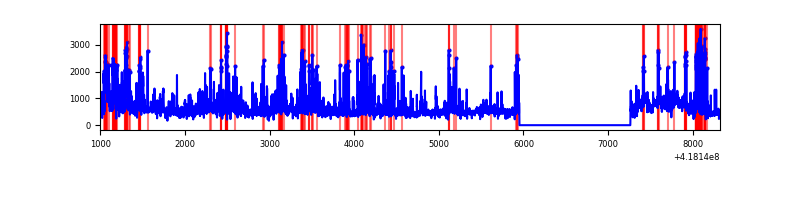 |
Top three noisy pixels from each quadrant. If the there are fewer than three noisy pixels in the level2.evt file, extra rows are filled as -1
| Pixel properties | Quadrant properties | ||||||
|---|---|---|---|---|---|---|---|
| Quadrant | DetID | PixID | Counts | Sigma | Mean | Median | Sigma |
| A | 10 | 83 | 562192 | 4217.36 | 648 | 634 | 133.2 |
| A | 15 | 237 | 143964 | 1076.42 | 648 | 634 | 133.2 |
| A | 6 | 10 | 113506 | 847.68 | 648 | 634 | 133.2 |
| B | 0 | 229 | 394152 | 3180.99 | 641 | 623 | 123.7 |
| B | 0 | 190 | 265972 | 2144.88 | 641 | 623 | 123.7 |
| B | 3 | 112 | 153683 | 1237.22 | 641 | 623 | 123.7 |
| C | 14 | 254 | 378520 | 2567.2 | 631 | 636 | 147.2 |
| C | 15 | 214 | 261376 | 1771.37 | 631 | 636 | 147.2 |
| C | 12 | 175 | 34821 | 232.24 | 631 | 636 | 147.2 |
| D | 12 | 227 | 817837 | 5608.47 | 586 | 569 | 145.7 |
| D | 2 | 249 | 429257 | 2941.85 | 586 | 569 | 145.7 |
| D | 12 | 191 | 253775 | 1737.62 | 586 | 569 | 145.7 |
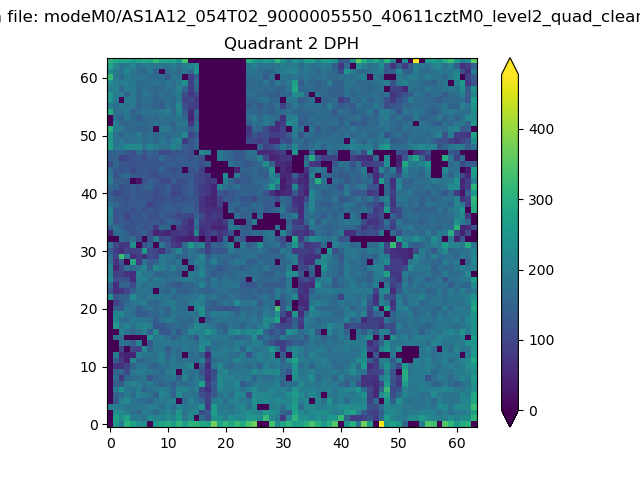
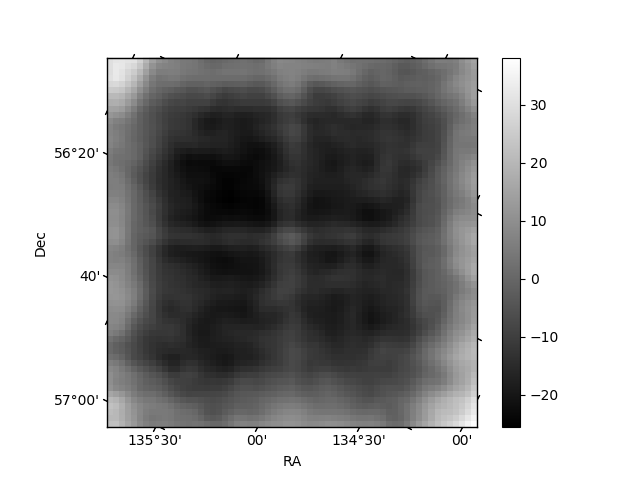
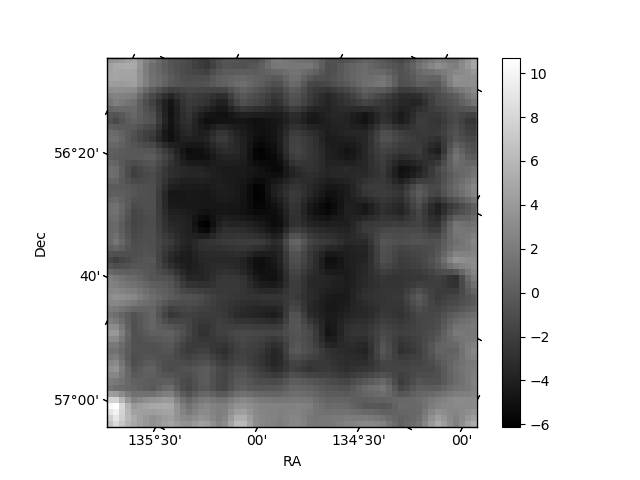
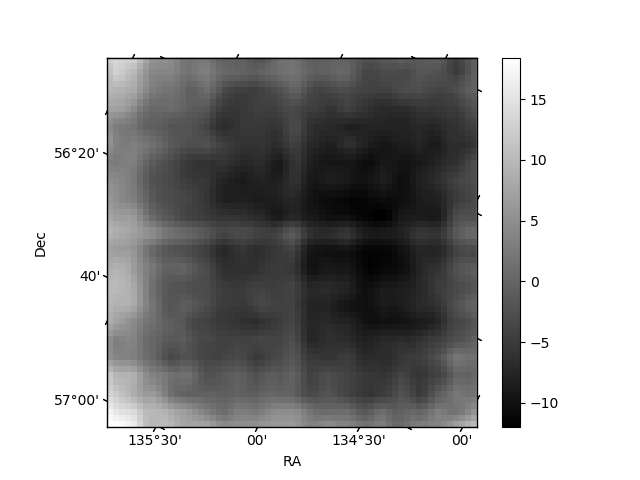
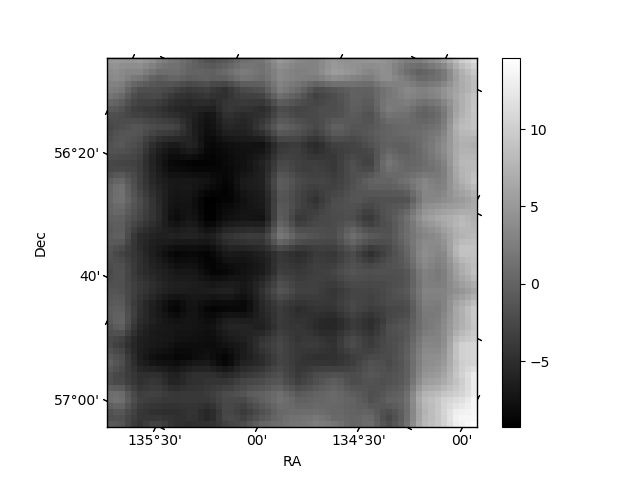
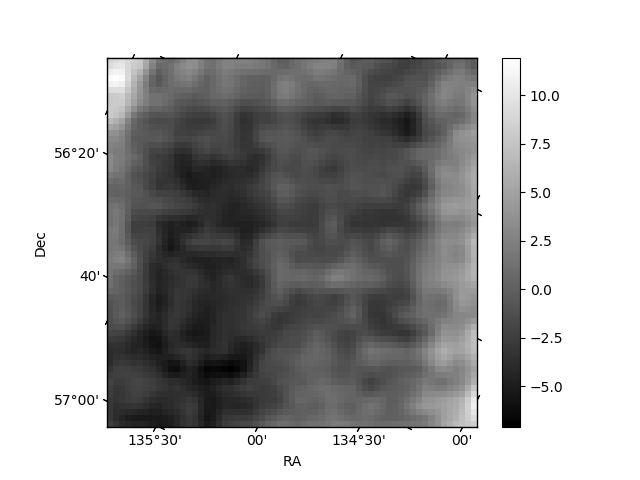
Histogram calculated using DETX and DETY for each event in the final _common_clean file
| Quadrant A | 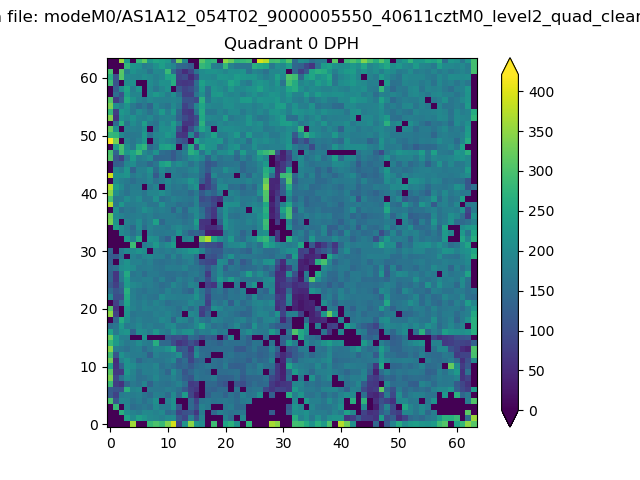 |
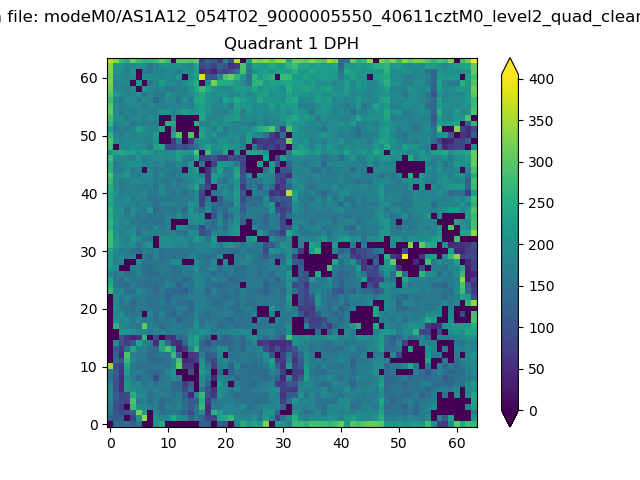 |
Quadrant B |
|---|---|---|---|
| Quadrant D | 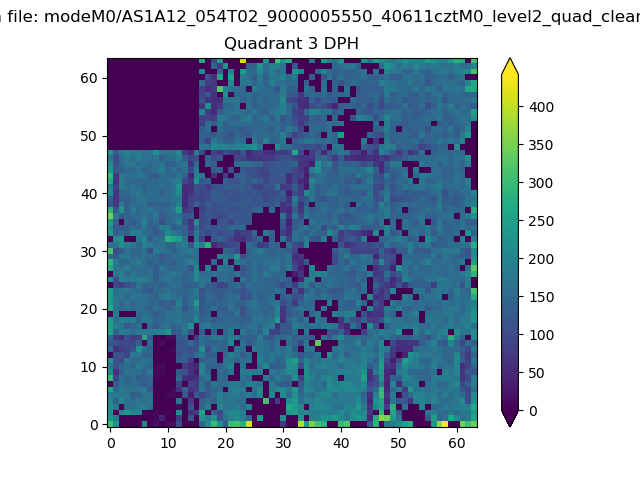 |
 |
Quadrant C |
| Plot type | Count rate plots | Images |
|---|---|---|
| Comparison with Poisson distribution Blue bars denote a histogram of data divided into 1 sec bins. Red curve is a Poisson curve with rate = median count rate of data. |
 |
 |
| Quadrant-wise count rates Data is divided into 100 sec bins |
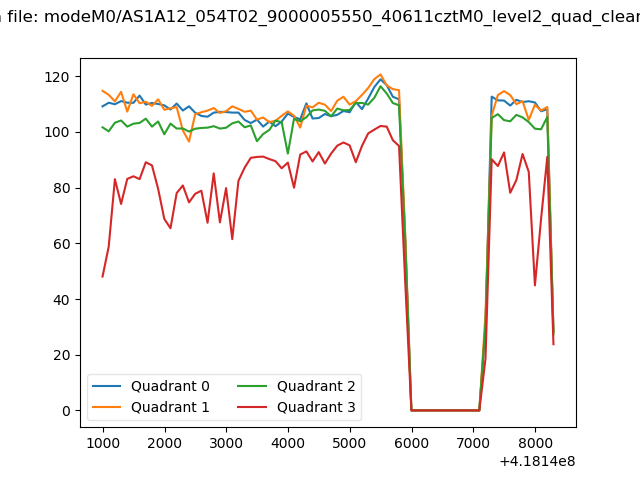 |
|
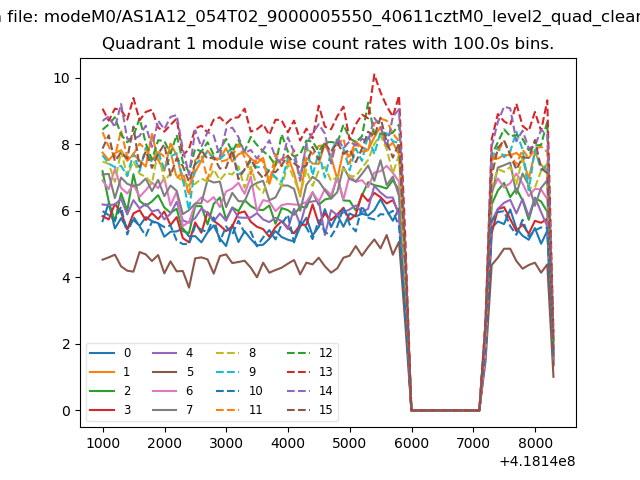
| Module-wise count rates for Quadrant A Data is divided into 100 sec bins |
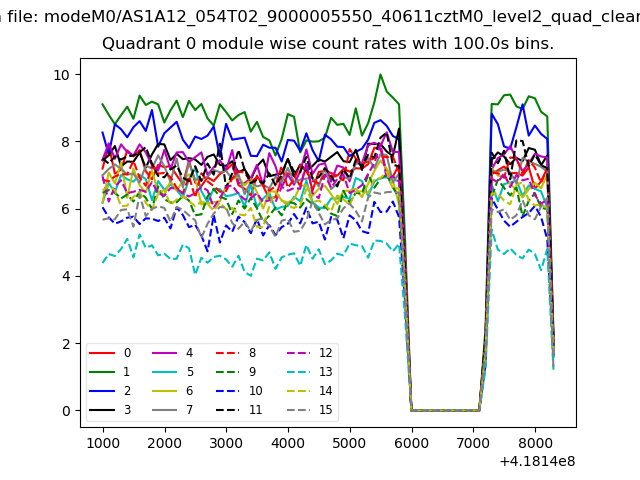 |
 |
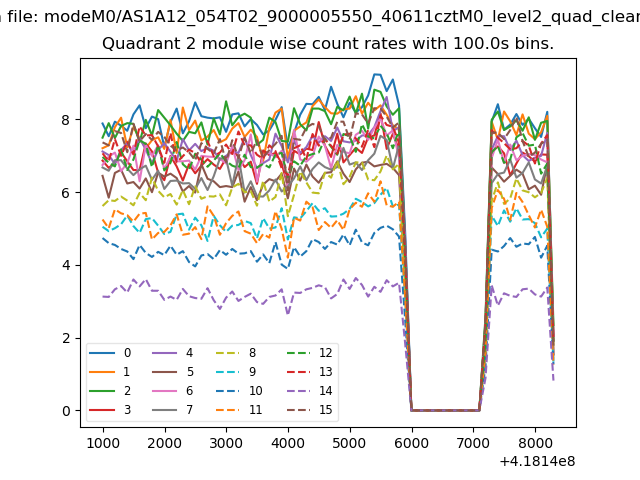
| Module-wise count rates for Quadrant B Data is divided into 100 sec bins |
 |
 |
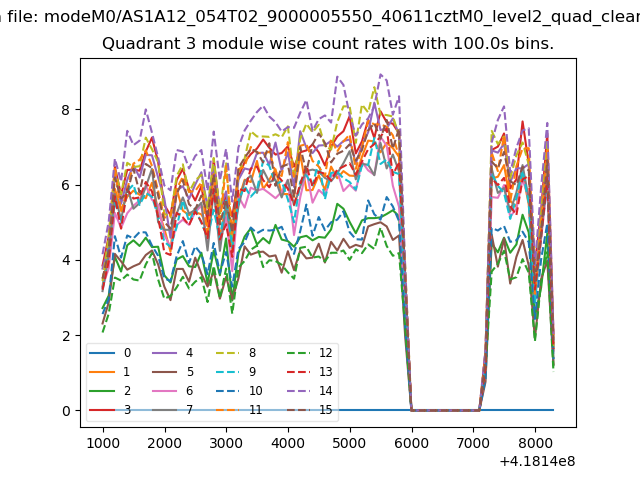
| Module-wise count rates for Quadrant C Data is divided into 100 sec bins |
 |
 |
| Module-wise count rates for Quadrant D Data is divided into 100 sec bins |
 |
 |
| Parameter | Plot |
|---|---|
| CZT HV Monitor | 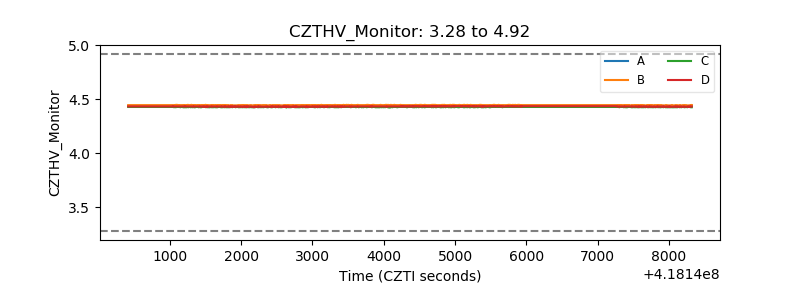 |
| D_VDD | 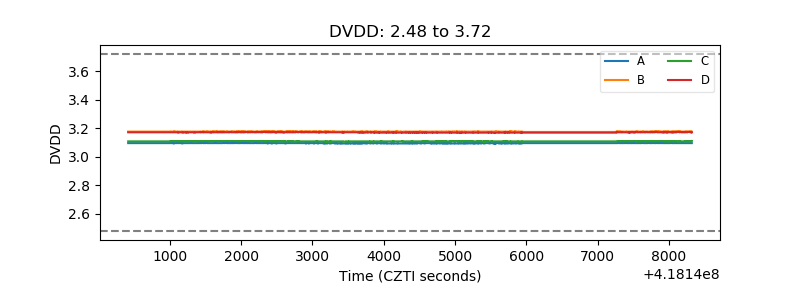 |
| Temperature 1 | 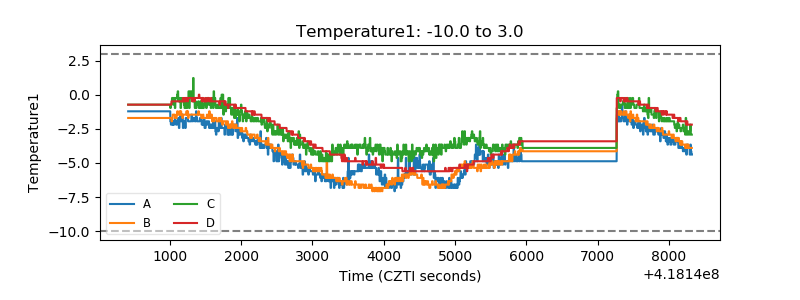 |
| Veto HV Monitor |  |
| Veto LLD | 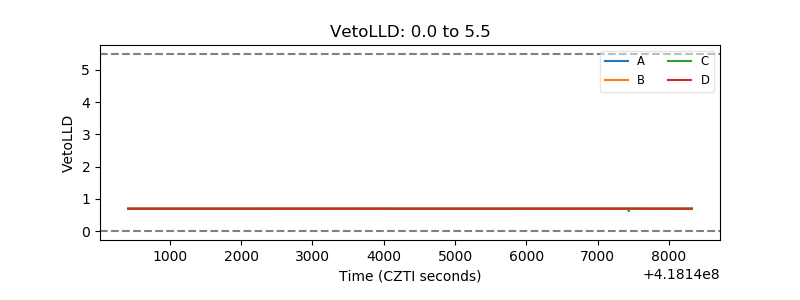 |
| Alpha Counter | 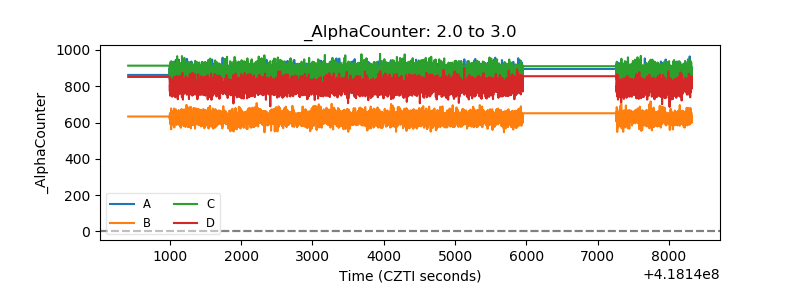 |
| _CPM_Rate | 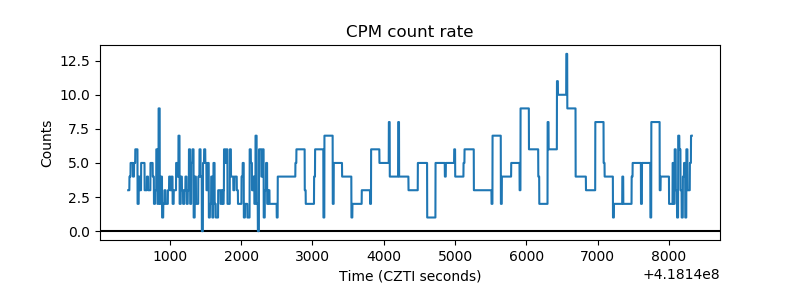 |
| CZT Counter | 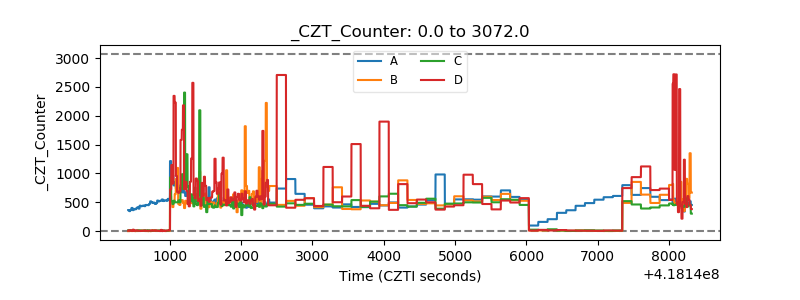 |
| +2.5 Volts monitor | 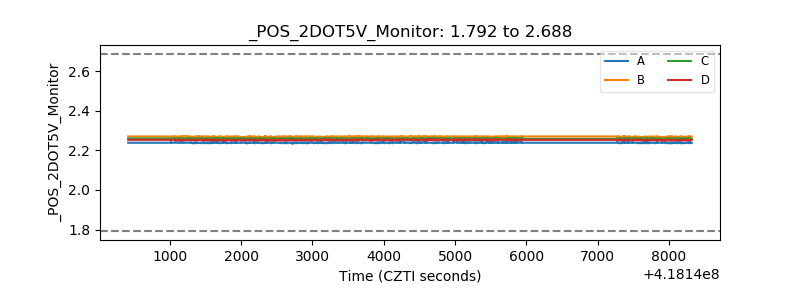 |
| +5 Volts monitor | 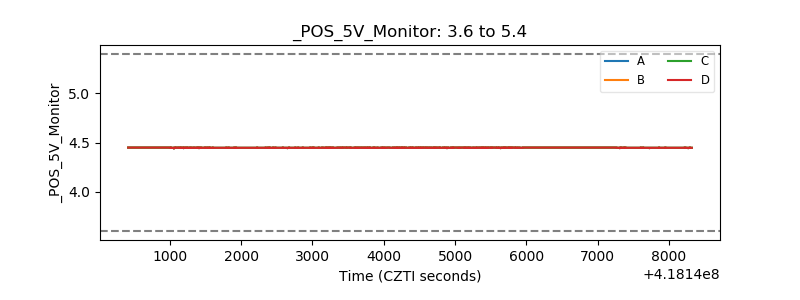 |
| _ROLL_ROT | 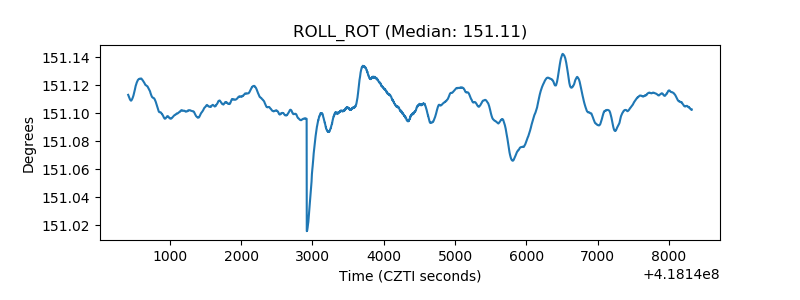 |
| _Roll_DEC | 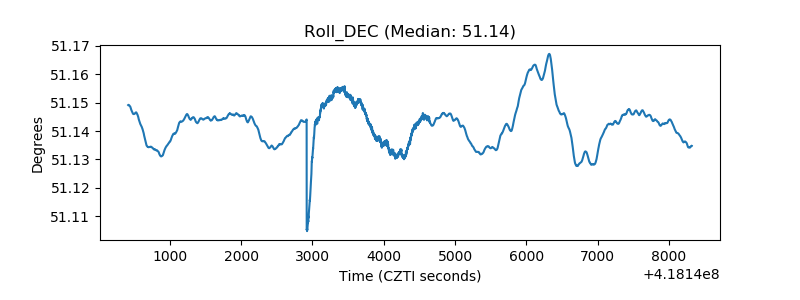 |
| _Roll_RA | 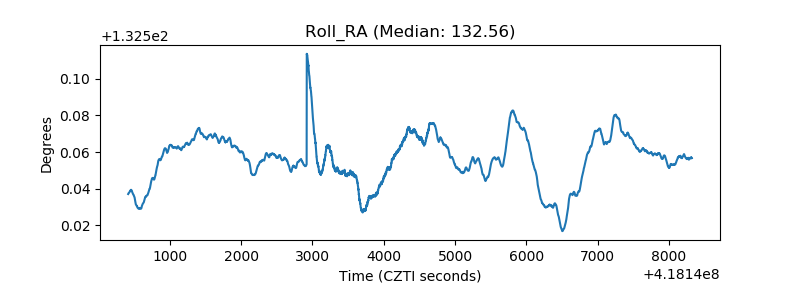 |
| Veto Counter | 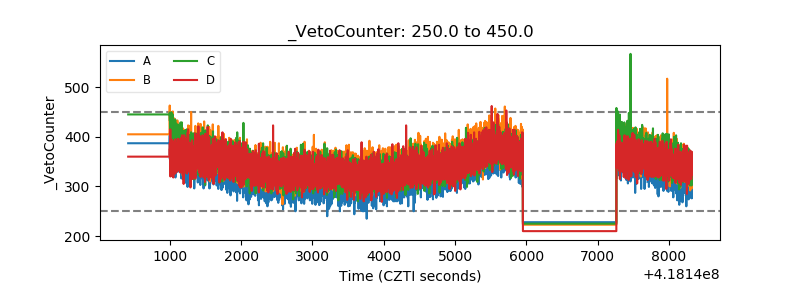 |