| Param | Original file | Final file |
|---|---|---|
| Filename | modeM0/AS1A12_054T02_9000005550_40614cztM0_level2.fits | modeM0/AS1A12_054T02_9000005550_40614cztM0_level2_quad_clean.evt |
| Size (bytes) | 982,195,200 | 240,871,680 |
| Size | 936.7 MB | 229.7 MB |
| Events in quadrant A | 8,354,493 | 1,663,254 |
| Events in quadrant B | 8,351,986 | 1,683,273 |
| Events in quadrant C | 8,226,192 | 1,597,963 |
| Events in quadrant D | 10,220,511 | 1,276,165 |
| Mode SS | |||
|---|---|---|---|
| Quadrant | BADHDUFLAG | Total packets | Discarded packets |
| A | 0 | 318 | 0 |
| B | 0 | 318 | 0 |
| C | 0 | 318 | 0 |
| D | 0 | 318 | 0 |
| Mode M0 | |||
|---|---|---|---|
| Quadrant | BADHDUFLAG | Total packets | Discarded packets |
| A | 0 | 34834 | 5 |
| B | 0 | 35296 | 4 |
| C | 0 | 34553 | 4 |
| D | 0 | 41212 | 4 |
| Mode M9 | |||
|---|---|---|---|
| Quadrant | BADHDUFLAG | Total packets | Discarded packets |
| A | 0 | 43 | 0 |
| B | 0 | 43 | 0 |
| C | 0 | 43 | 0 |
| D | 0 | 43 | 0 |
| Quadrant | Total seconds | Saturated seconds | Saturation percentage |
|---|---|---|---|
| A | 15526 | 29 | 0.186783% |
| B | 15526 | 162 | 1.043411% |
| C | 15526 | 304 | 1.958006% |
| D | 15526 | 2427 | 15.631843% |
Noise dominated data is calculated using 1-second bins in cleaned event files. If a bin has >2000 counts, and if more than 50% of those come from <1% of pixels, then it is considered to be noise-dominated and hence unusable.
| Quadrant | # 1 sec bins | Bins with >0 counts | Bins with >2000 counts | High rate bins dominated by noise | Noise dominated (total time) | Noise dominated (detector-on time) | Marked lightcurve |
|---|---|---|---|---|---|---|---|
| A | 19856 | 15529 | 7 | 7 | 0.04% | 0.05% | 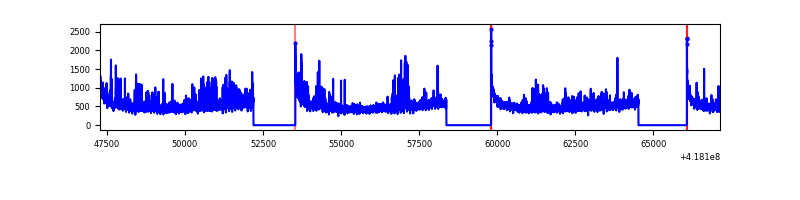 |
| B | 19856 | 15529 | 110 | 110 | 0.55% | 0.71% | 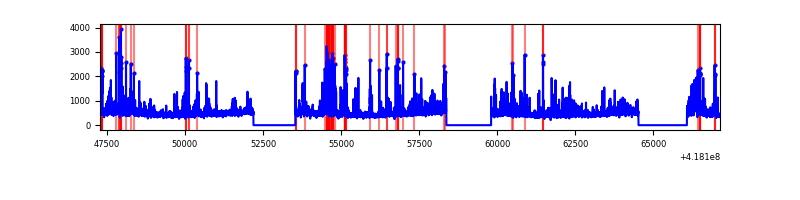 |
| C | 19856 | 15529 | 297 | 297 | 1.50% | 1.91% | 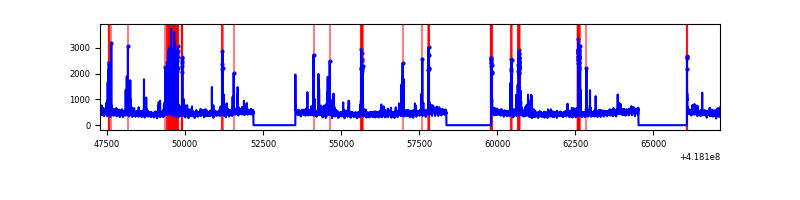 |
| D | 19856 | 15528 | 656 | 656 | 3.30% | 4.22% | 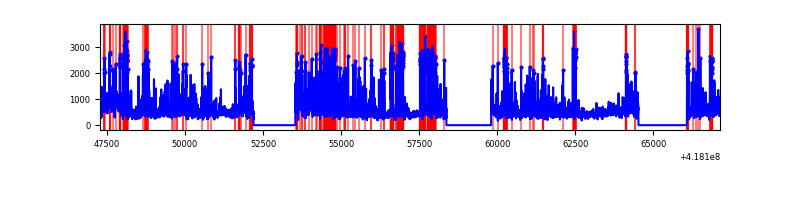 |
Top three noisy pixels from each quadrant. If the there are fewer than three noisy pixels in the level2.evt file, extra rows are filled as -1
| Pixel properties | Quadrant properties | ||||||
|---|---|---|---|---|---|---|---|
| Quadrant | DetID | PixID | Counts | Sigma | Mean | Median | Sigma |
| A | 10 | 83 | 1272080 | 3758.83 | 1662 | 1625 | 338.0 |
| A | 2 | 79 | 432602 | 1275.11 | 1662 | 1625 | 338.0 |
| A | 6 | 10 | 99699 | 290.17 | 1662 | 1625 | 338.0 |
| B | 0 | 190 | 654182 | 2074.11 | 1649 | 1601 | 314.6 |
| B | 5 | 255 | 553242 | 1753.29 | 1649 | 1601 | 314.6 |
| B | 0 | 229 | 274117 | 866.14 | 1649 | 1601 | 314.6 |
| C | 14 | 254 | 1049185 | 2791.77 | 1614 | 1623 | 375.2 |
| C | 15 | 214 | 658846 | 1751.51 | 1614 | 1623 | 375.2 |
| C | 9 | 187 | 88452 | 231.4 | 1614 | 1623 | 375.2 |
| D | 12 | 227 | 2175753 | 5909.95 | 1497 | 1459 | 367.9 |
| D | 12 | 191 | 547474 | 1484.12 | 1497 | 1459 | 367.9 |
| D | 2 | 249 | 448182 | 1214.24 | 1497 | 1459 | 367.9 |
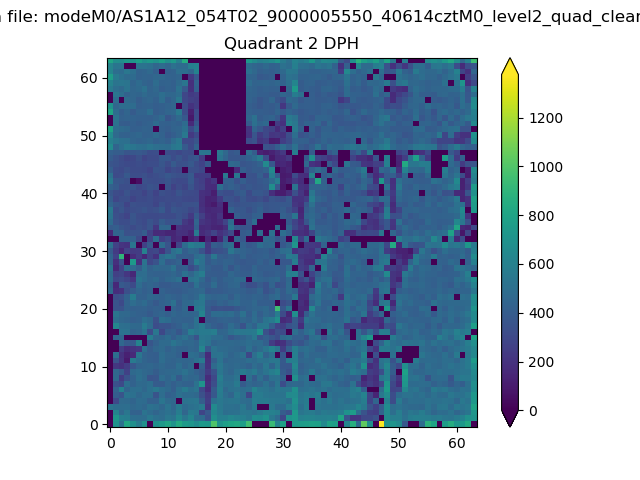
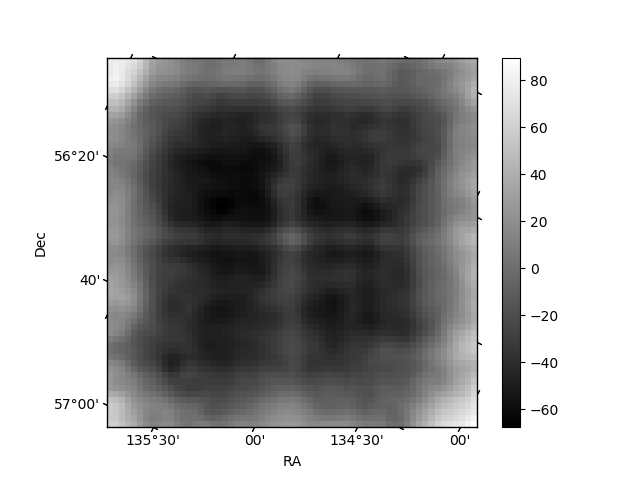
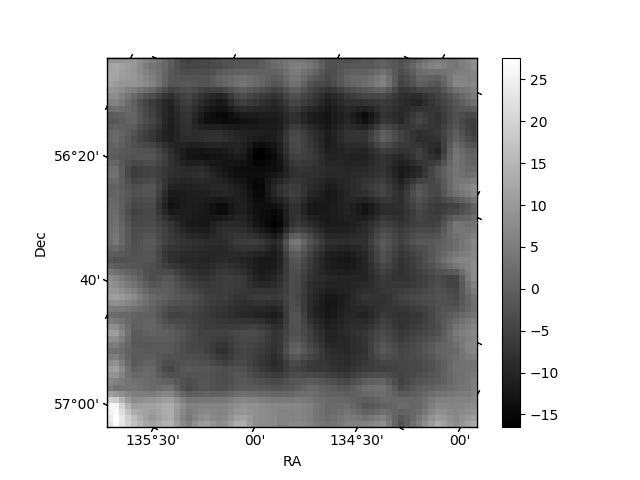
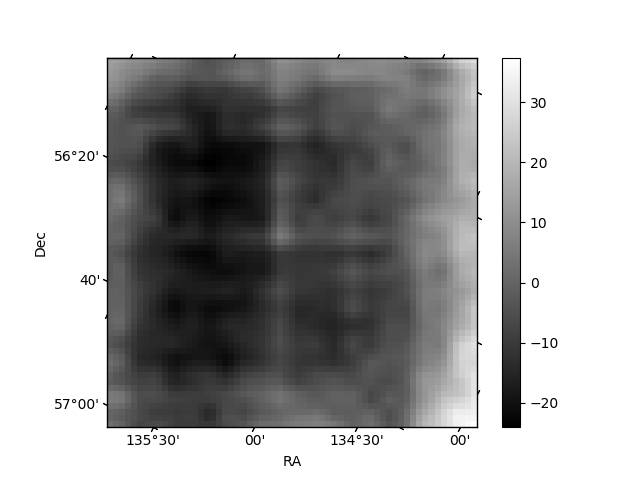
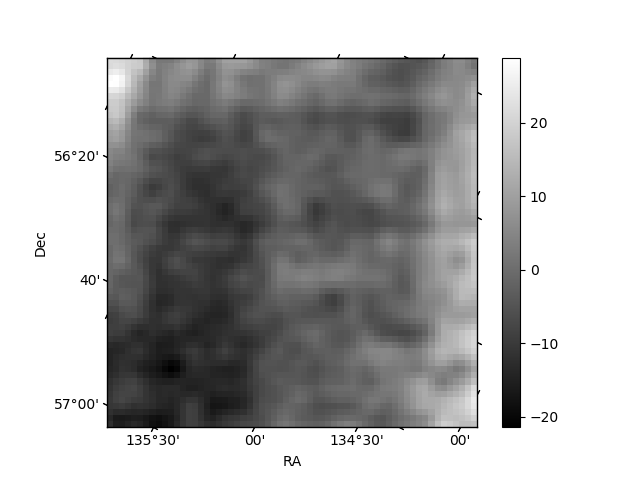
Histogram calculated using DETX and DETY for each event in the final _common_clean file
| Quadrant A | 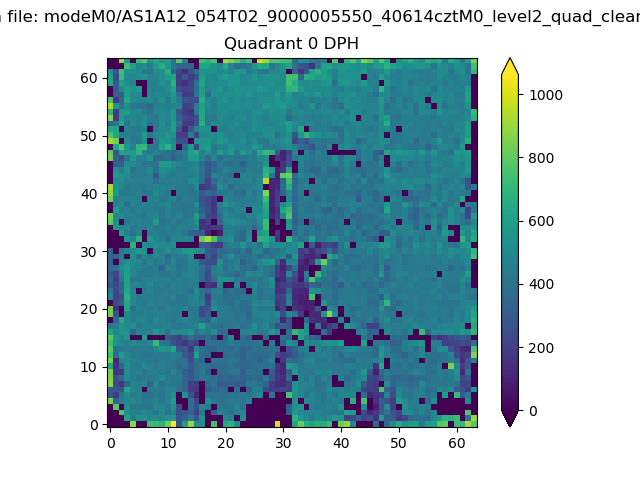 |
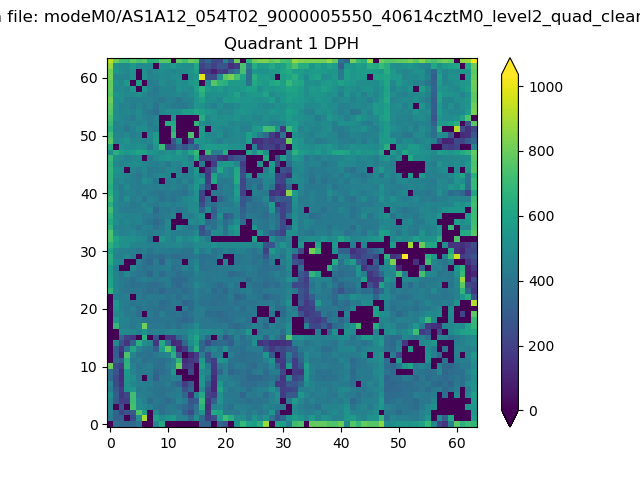 |
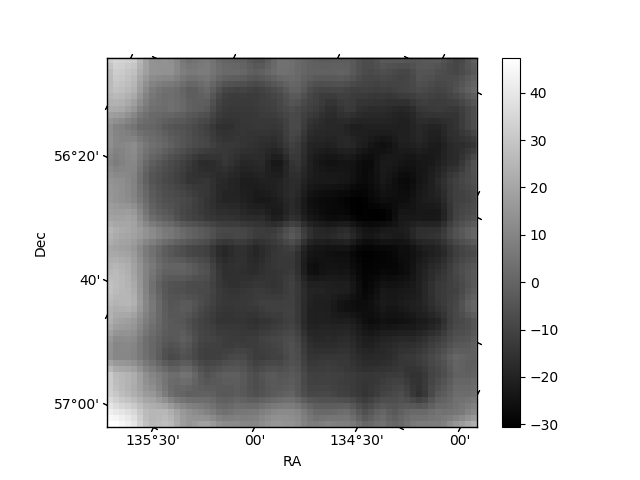
Quadrant B |
|---|---|---|---|
| Quadrant D | 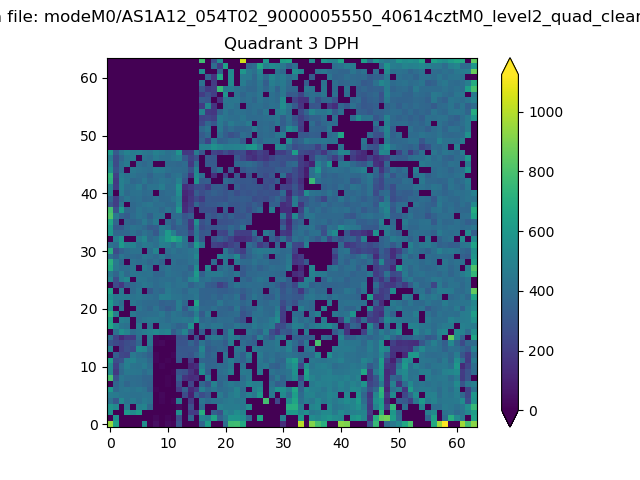 |
 |
Quadrant C |
| Plot type | Count rate plots | Images |
|---|---|---|
| Comparison with Poisson distribution Blue bars denote a histogram of data divided into 1 sec bins. Red curve is a Poisson curve with rate = median count rate of data. |
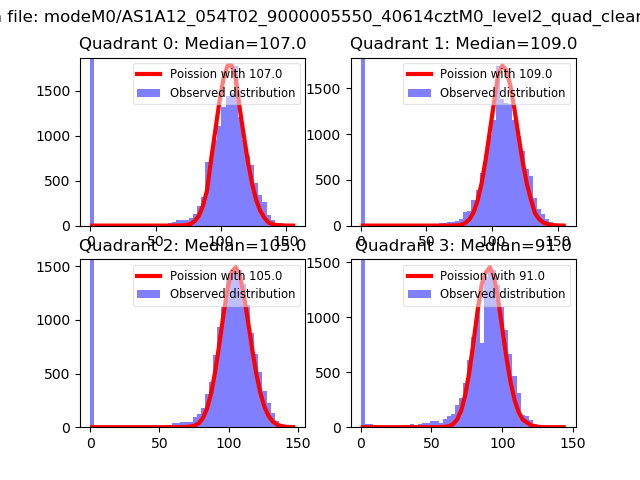 |
 |
| Quadrant-wise count rates Data is divided into 100 sec bins |
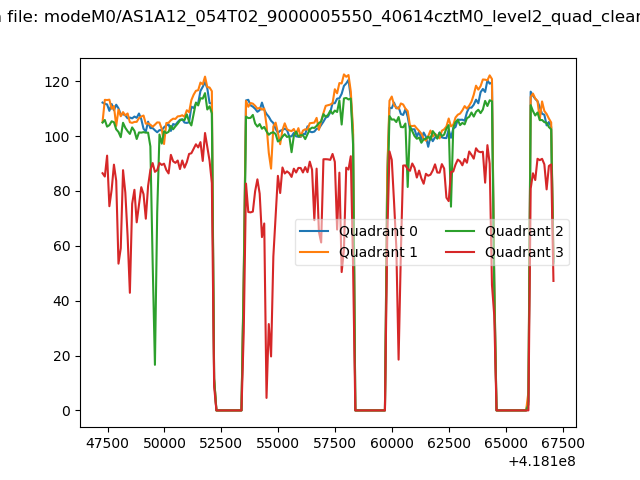 |
|
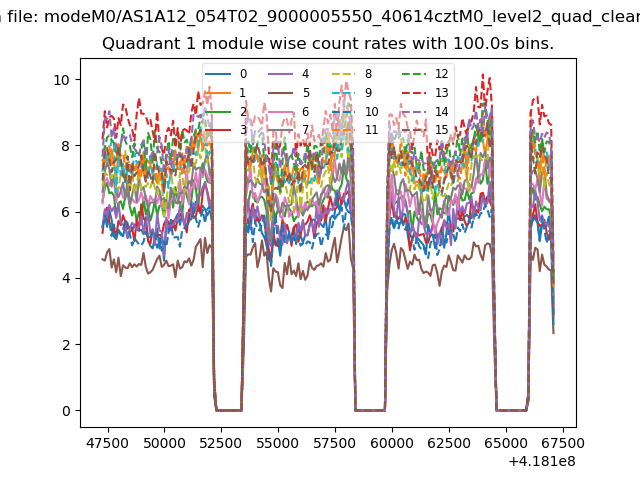
| Module-wise count rates for Quadrant A Data is divided into 100 sec bins |
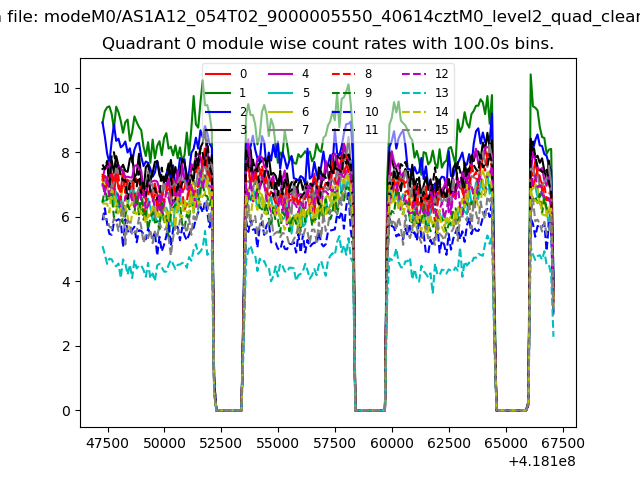 |
 |
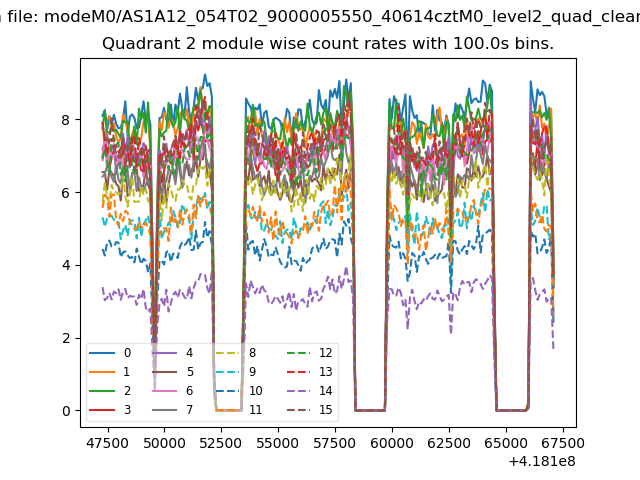
| Module-wise count rates for Quadrant B Data is divided into 100 sec bins |
 |
 |
| Module-wise count rates for Quadrant C Data is divided into 100 sec bins |
 |
 |
| Module-wise count rates for Quadrant D Data is divided into 100 sec bins |
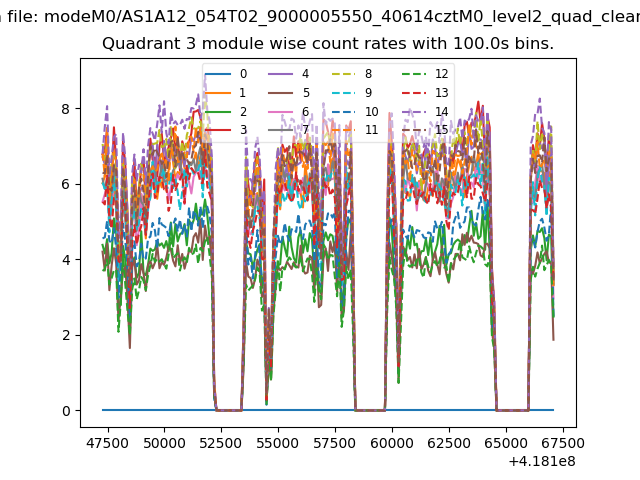 |
 |
| Parameter | Plot |
|---|---|
| CZT HV Monitor | 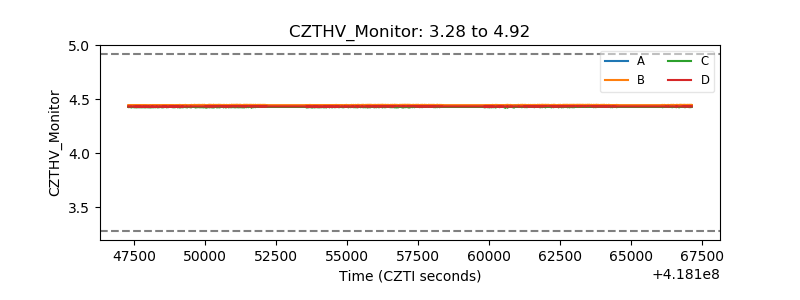 |
| D_VDD | 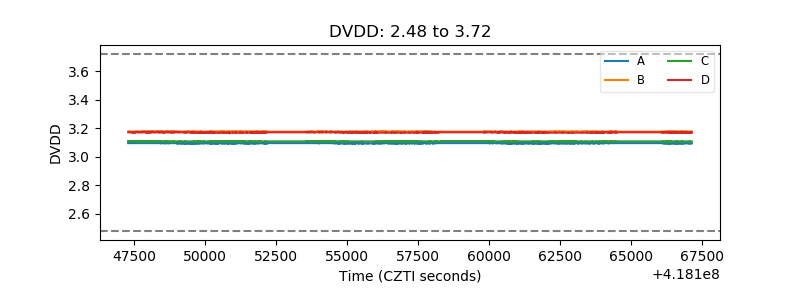 |
| Temperature 1 | 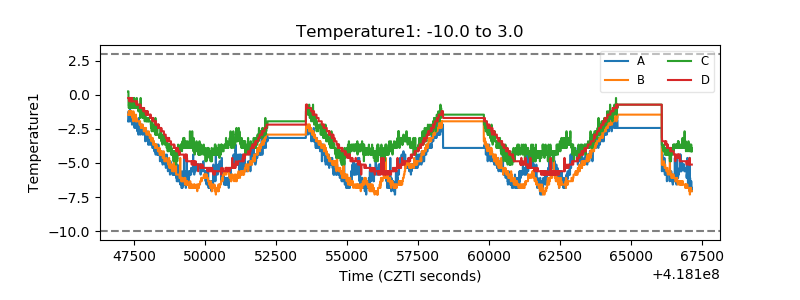 |
| Veto HV Monitor | 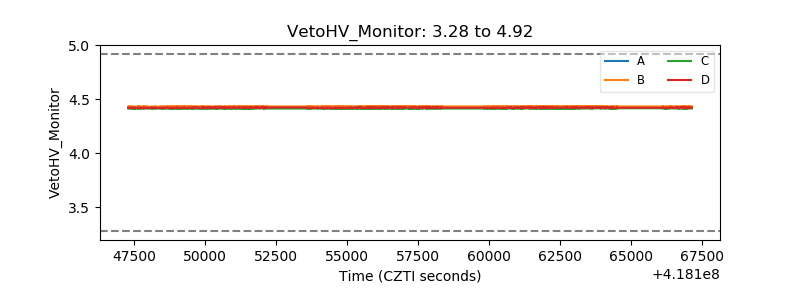 |
| Veto LLD | 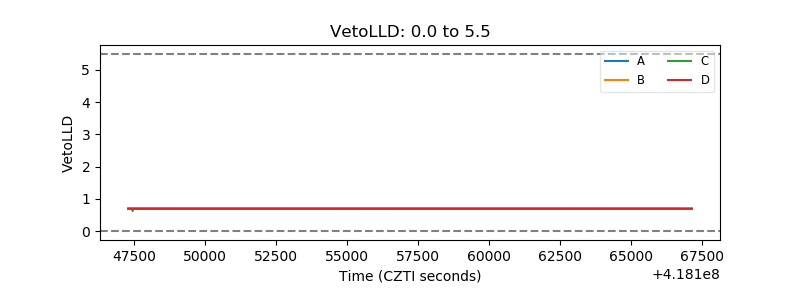 |
| Alpha Counter | 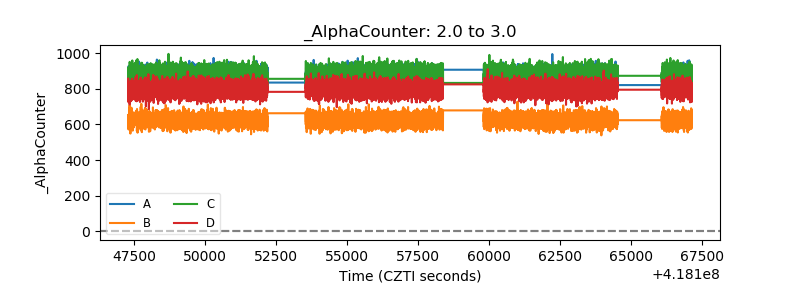 |
| _CPM_Rate | 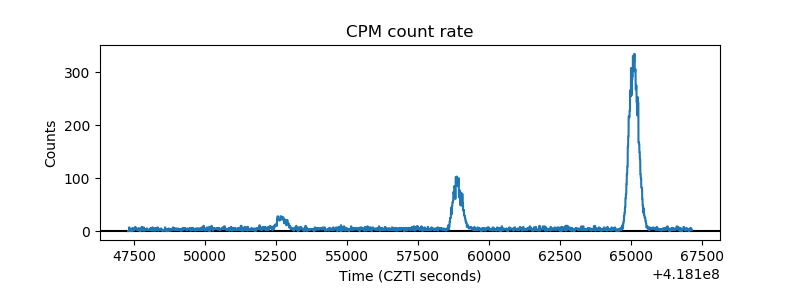 |
| CZT Counter | 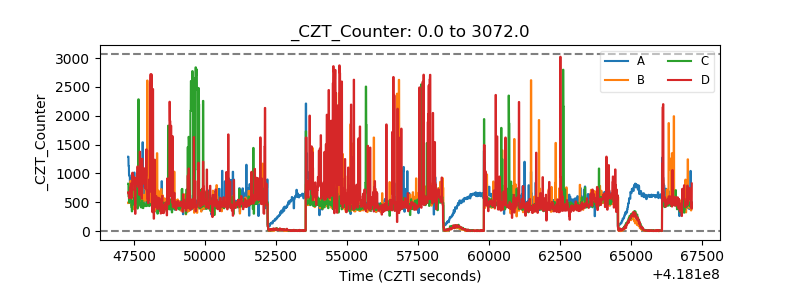 |
| +2.5 Volts monitor | 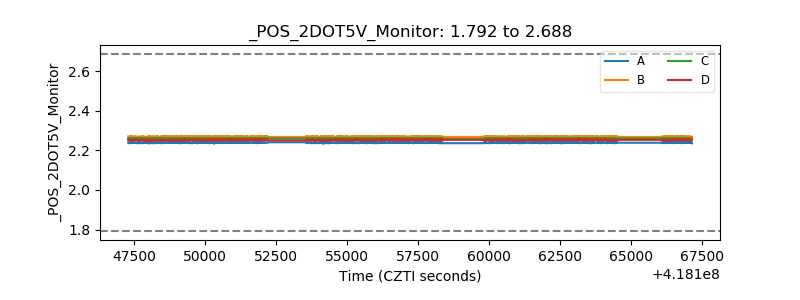 |
| +5 Volts monitor | 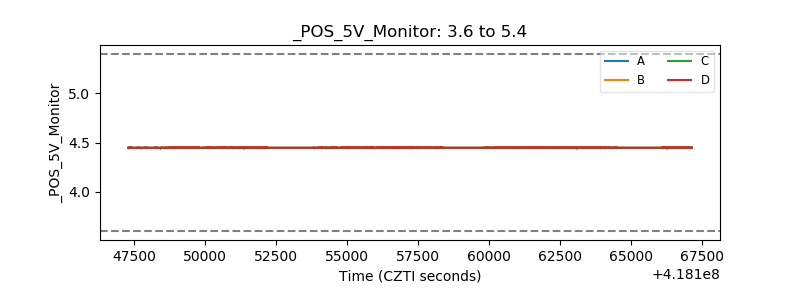 |
| _ROLL_ROT | 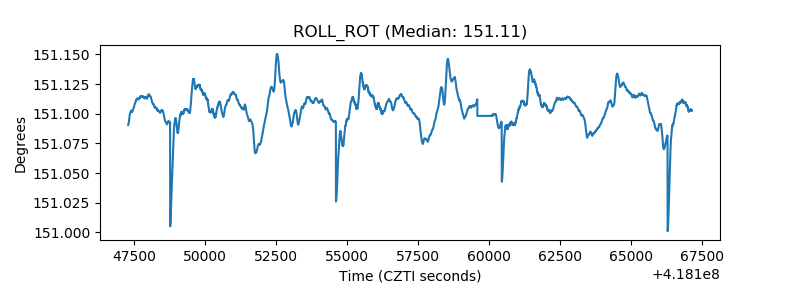 |
| _Roll_DEC | 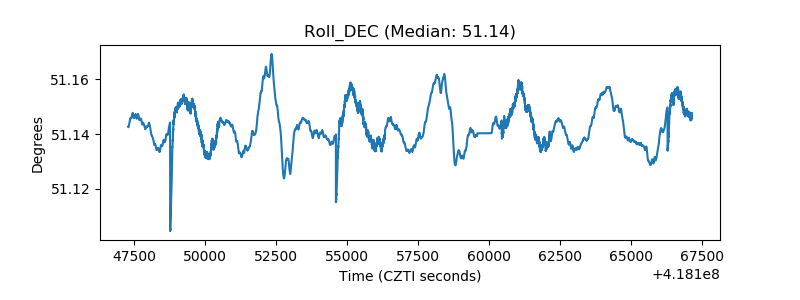 |
| _Roll_RA | 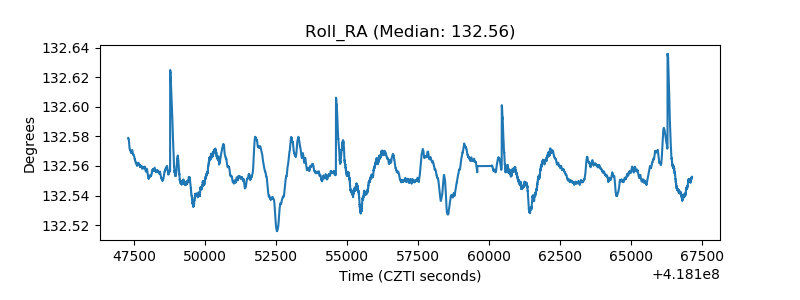 |
| Veto Counter | 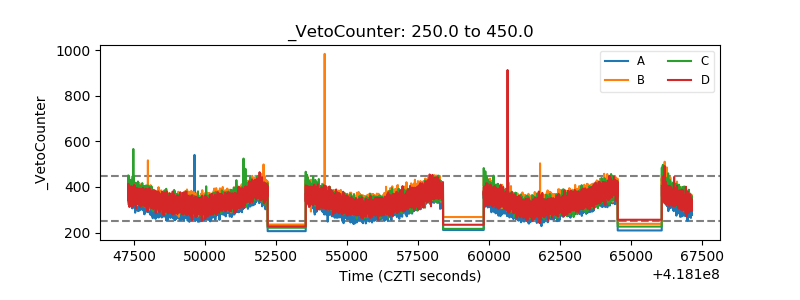 |