| Param | Original file | Final file |
|---|---|---|
| Filename | modeM0/AS1A12_054T02_9000005550cztM0_level2.fits | modeM0/AS1A12_054T02_9000005550cztM0_level2_quad_clean.evt |
| Size (bytes) | 10,604,160 | 17,389,440 |
| Size | 10.1 MB | 16.6 MB |
| Events in quadrant A | 61,122 | 115,496 |
| Events in quadrant B | 59,008 | 114,400 |
| Events in quadrant C | 61,510 | 111,003 |
| Events in quadrant D | 48,338 | 93,633 |
| Mode SS | |||
|---|---|---|---|
| Quadrant | BADHDUFLAG | Total packets | Discarded packets |
| A | 0 | 24 | 0 |
| B | 0 | 24 | 0 |
| C | 0 | 24 | 0 |
| D | 0 | 24 | 0 |
| Mode M0 | |||
|---|---|---|---|
| Quadrant | BADHDUFLAG | Total packets | Discarded packets |
| A | 0 | 2815 | 0 |
| B | 0 | 2915 | 0 |
| C | 0 | 2511 | 0 |
| D | 0 | 3008 | 0 |
| Mode M9 | |||
|---|---|---|---|
| Quadrant | BADHDUFLAG | Total packets | Discarded packets |
| A | 0 | 9 | 0 |
| B | 0 | 10 | 0 |
| C | 0 | 10 | 0 |
| D | 0 | 10 | 0 |
| Quadrant | Total seconds | Saturated seconds | Saturation percentage |
|---|---|---|---|
| A | 1210 | 6 | 0.495868% |
| B | 1210 | 21 | 1.735537% |
| C | 1210 | 6 | 0.495868% |
| D | 1210 | 127 | 10.495868% |
Noise dominated data is calculated using 1-second bins in cleaned event files. If a bin has >2000 counts, and if more than 50% of those come from <1% of pixels, then it is considered to be noise-dominated and hence unusable.
| Quadrant | # 1 sec bins | Bins with >0 counts | Bins with >2000 counts | High rate bins dominated by noise | Noise dominated (total time) | Noise dominated (detector-on time) | Marked lightcurve |
|---|---|---|---|---|---|---|---|
| A | 1209 | 1209 | 0 | 0 | 0.00% | 0.00% | 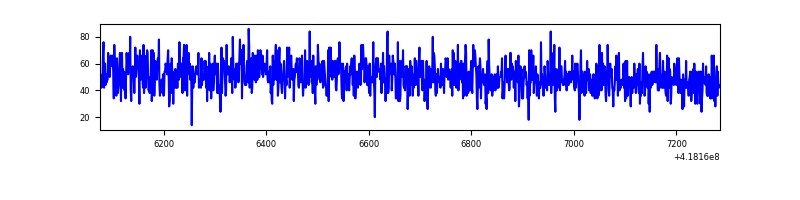 |
| B | 1209 | 1209 | 0 | 0 | 0.00% | 0.00% | 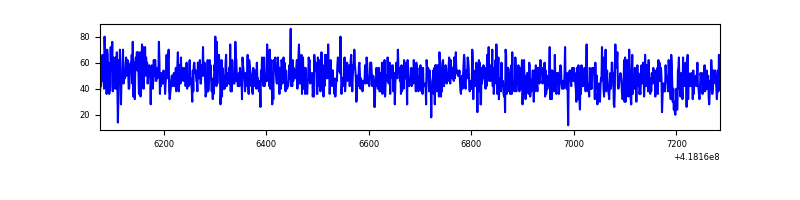 |
| C | 1209 | 1209 | 0 | 0 | 0.00% | 0.00% | 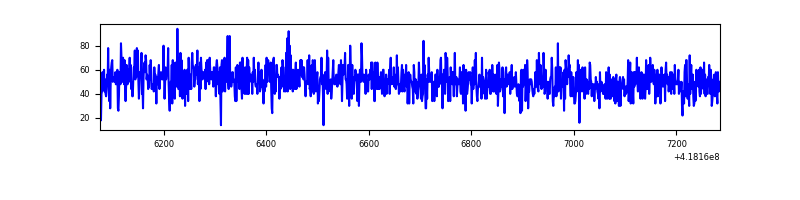 |
| D | 1209 | 1207 | 0 | 0 | 0.00% | 0.00% | 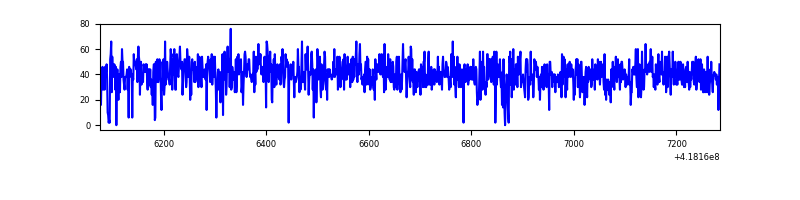 |
Top three noisy pixels from each quadrant. If the there are fewer than three noisy pixels in the level2.evt file, extra rows are filled as -1
| Pixel properties | Quadrant properties | ||||||
|---|---|---|---|---|---|---|---|
| Quadrant | DetID | PixID | Counts | Sigma | Mean | Median | Sigma |
| A | 0 | 29 | 51 | 6.29 | 16 | 15 | 5.7 |
| A | 9 | 19 | 50 | 6.11 | 16 | 15 | 5.7 |
| A | 9 | 191 | 47 | 5.59 | 16 | 15 | 5.7 |
| B | 2 | 9 | 50 | 6.91 | 15 | 15 | 5.1 |
| B | 3 | 80 | 47 | 6.32 | 15 | 15 | 5.1 |
| B | 5 | 232 | 44 | 5.73 | 15 | 15 | 5.1 |
| C | 1 | 81 | 50 | 5.97 | 16 | 15 | 5.9 |
| C | 1 | 65 | 48 | 5.63 | 16 | 15 | 5.9 |
| C | 15 | 65 | 47 | 5.46 | 16 | 15 | 5.9 |
| D | 11 | 66 | 47 | 6.65 | 13 | 12 | 5.3 |
| D | 7 | 3 | 44 | 6.08 | 13 | 12 | 5.3 |
| D | 6 | 43 | 44 | 6.08 | 13 | 12 | 5.3 |
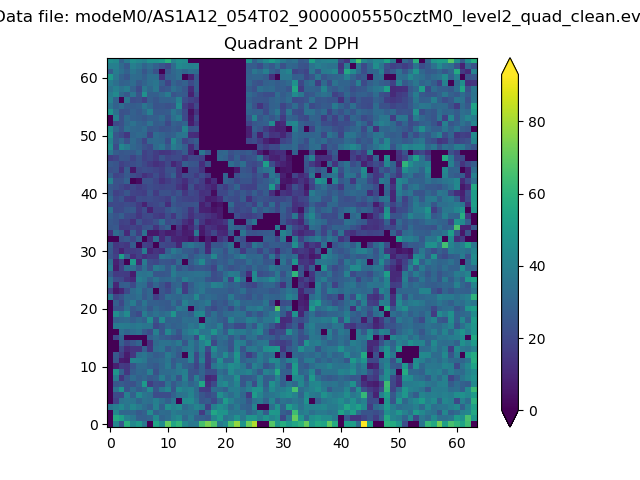
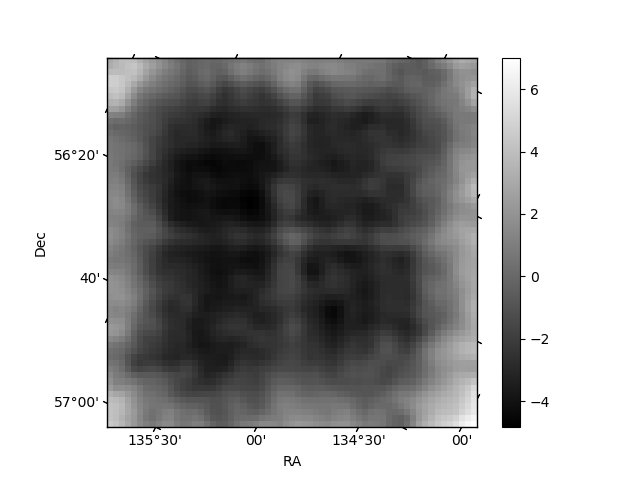
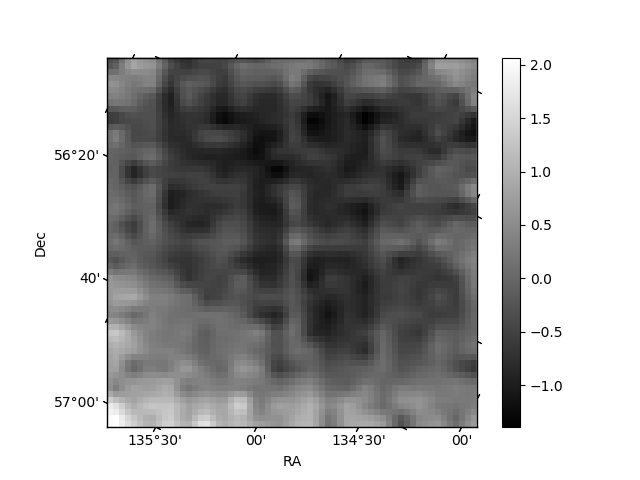
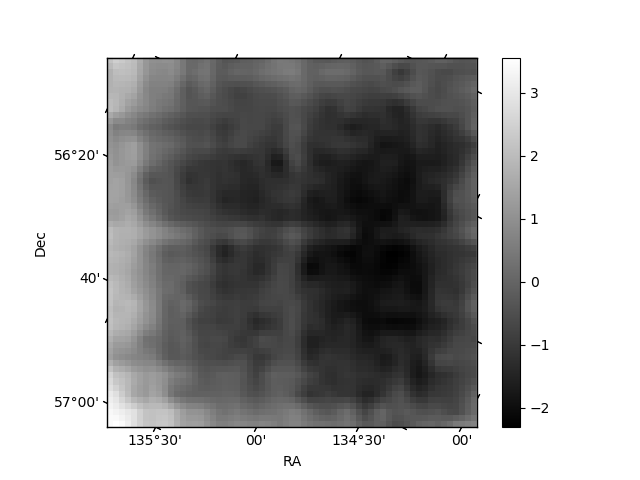
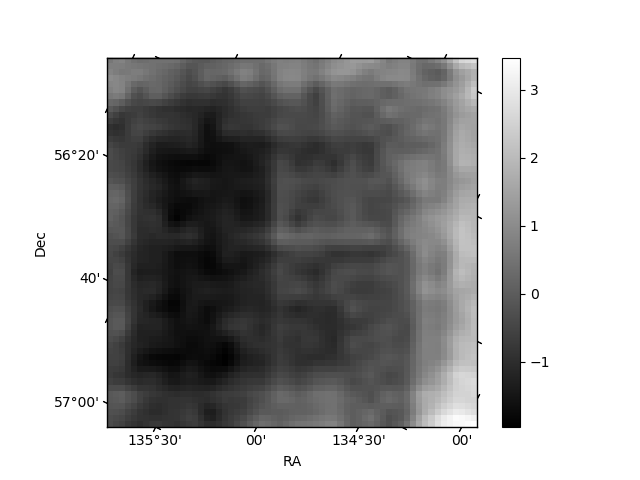
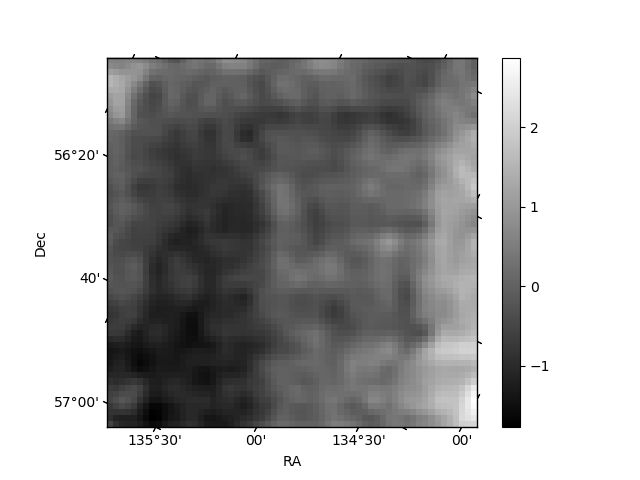
Histogram calculated using DETX and DETY for each event in the final _common_clean file
| Quadrant A | 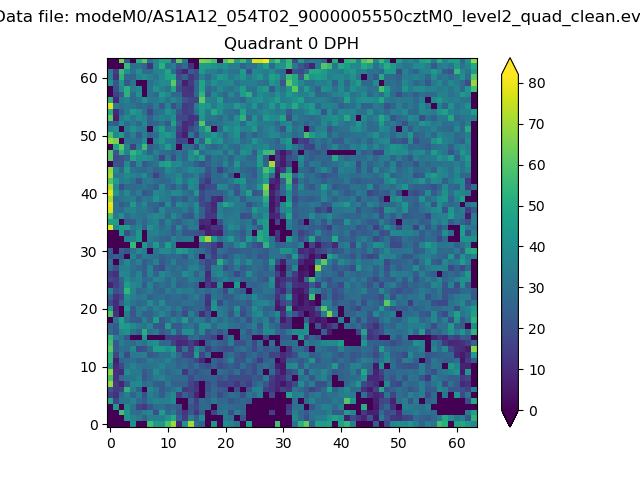 |
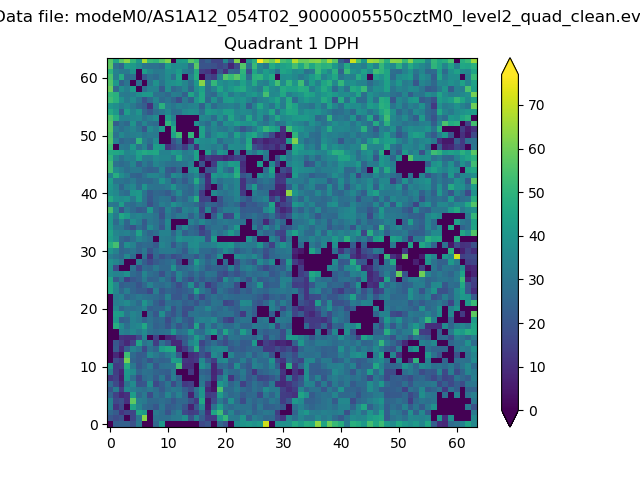 |
Quadrant B |
|---|---|---|---|
| Quadrant D | 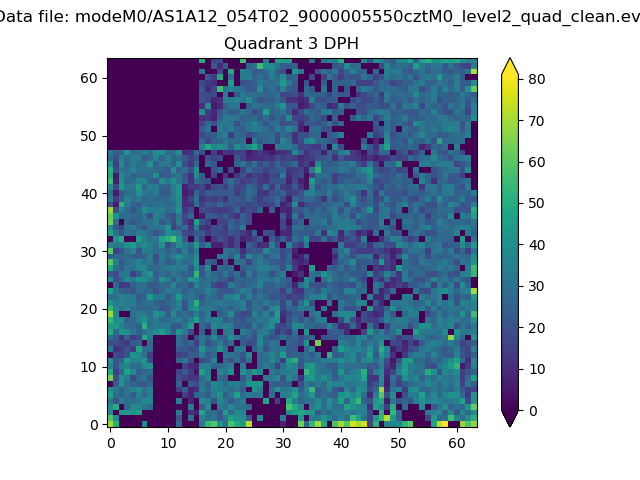 |
 |
Quadrant C |
| Plot type | Count rate plots | Images |
|---|---|---|
| Comparison with Poisson distribution Blue bars denote a histogram of data divided into 1 sec bins. Red curve is a Poisson curve with rate = median count rate of data. |
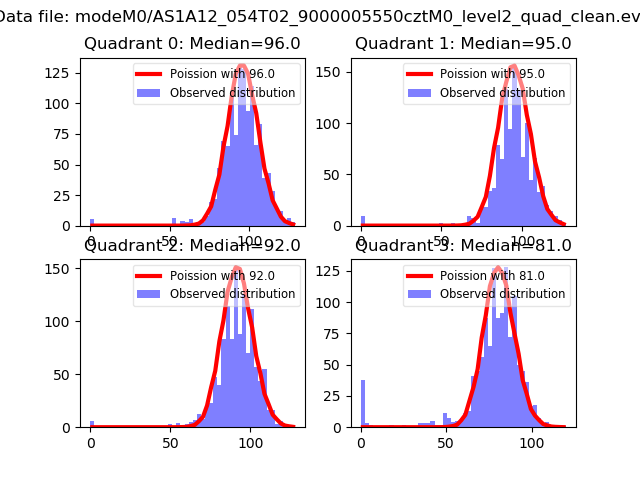 |
 |
| Quadrant-wise count rates Data is divided into 100 sec bins |
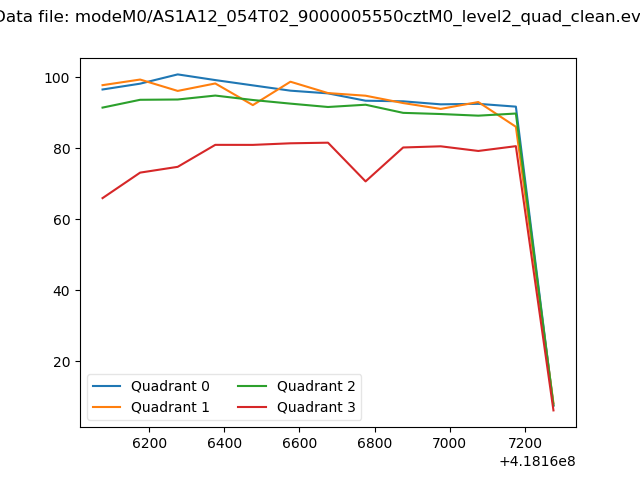 |
|
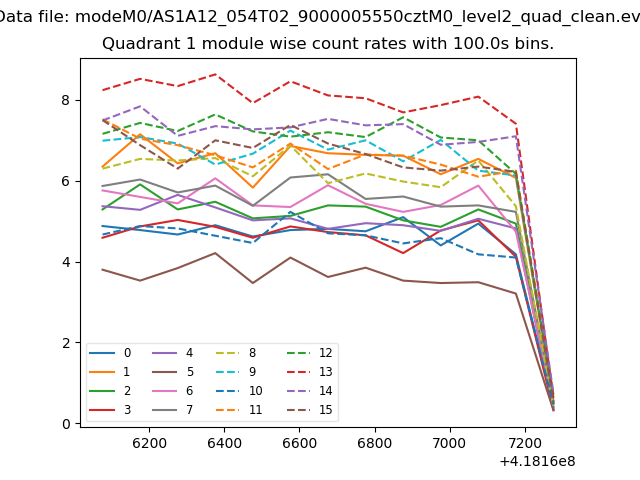
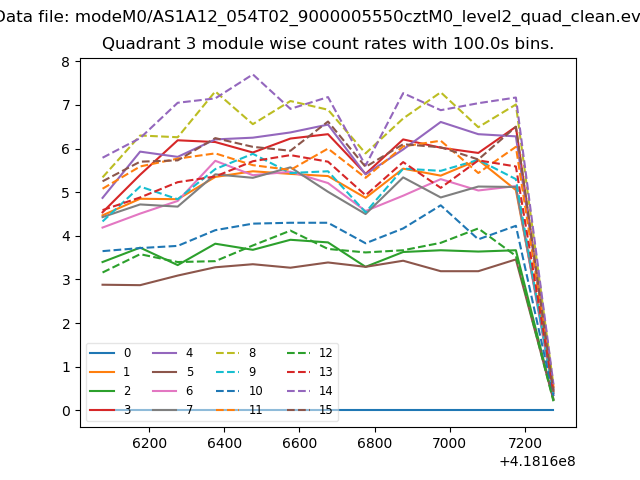
| Module-wise count rates for Quadrant A Data is divided into 100 sec bins |
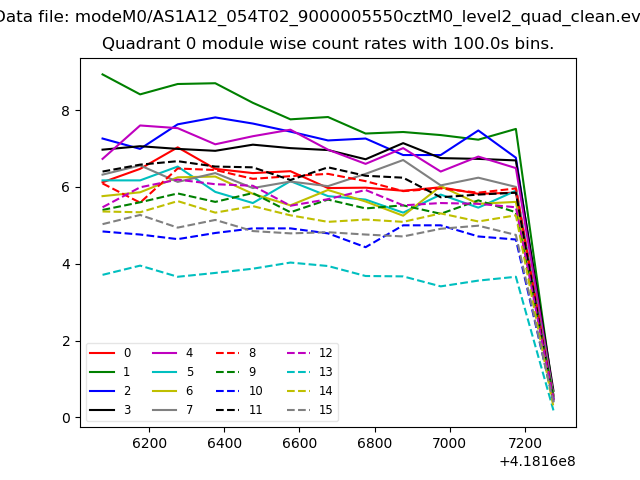 |
 |
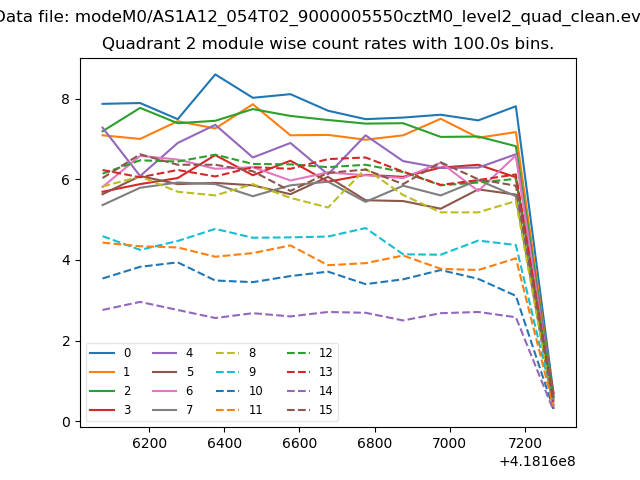
| Module-wise count rates for Quadrant B Data is divided into 100 sec bins |
 |
 |
| Module-wise count rates for Quadrant C Data is divided into 100 sec bins |
 |
 |
| Module-wise count rates for Quadrant D Data is divided into 100 sec bins |
 |
 |
| Parameter | Plot |
|---|---|
| CZT HV Monitor | 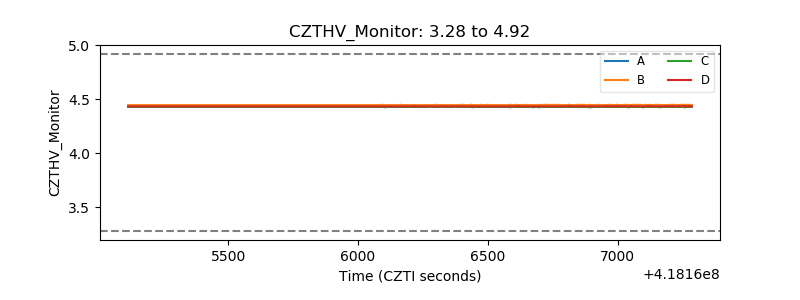 |
| D_VDD | 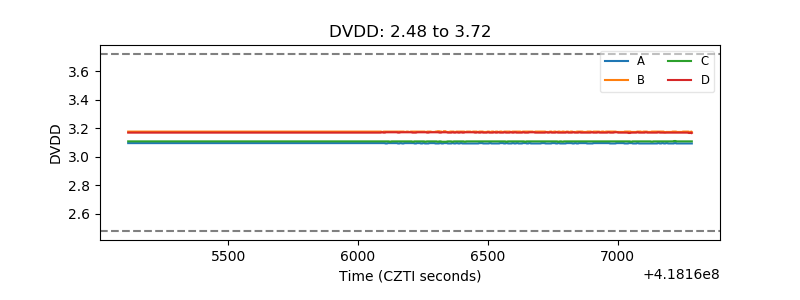 |
| Temperature 1 | 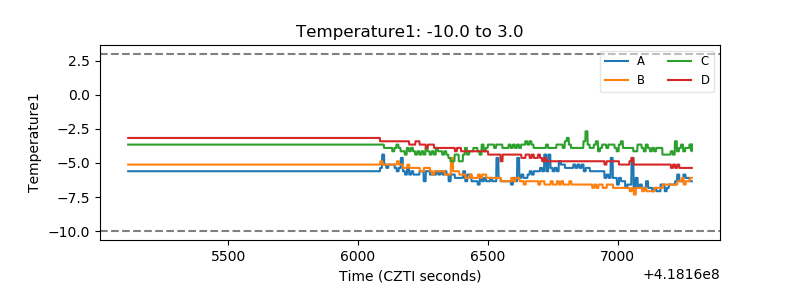 |
| Veto HV Monitor |  |
| Veto LLD | 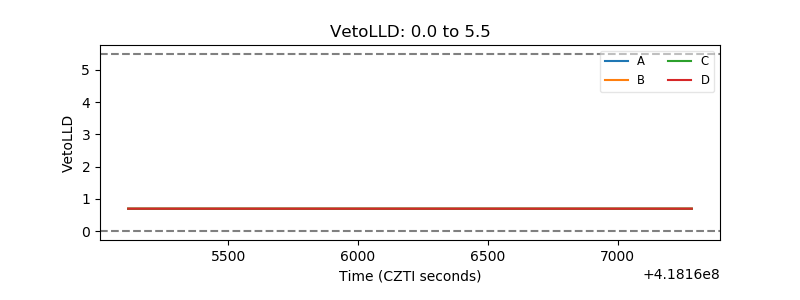 |
| Alpha Counter | 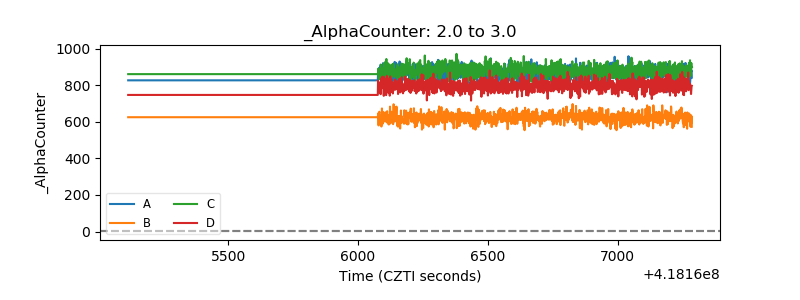 |
| _CPM_Rate | 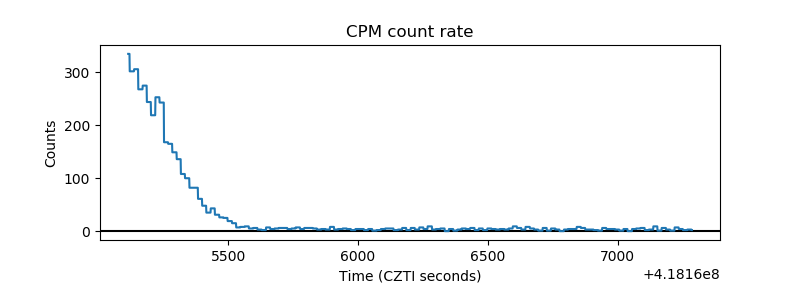 |
| CZT Counter | 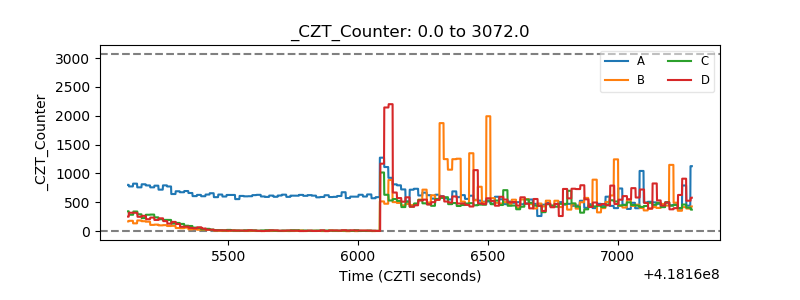 |
| +2.5 Volts monitor | 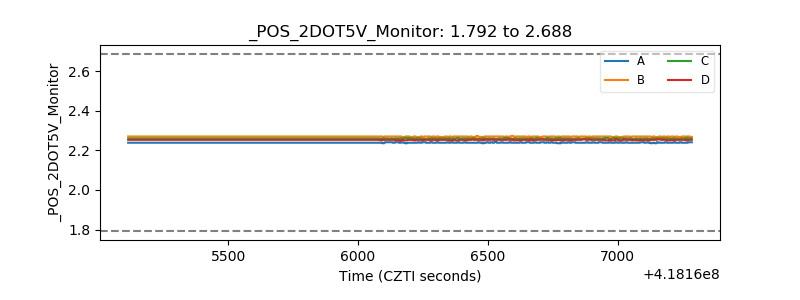 |
| +5 Volts monitor | 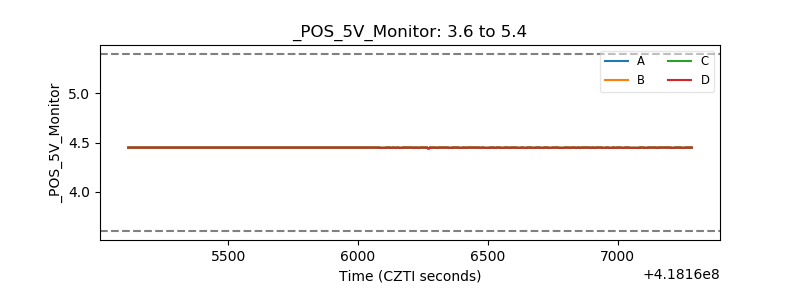 |
| _ROLL_ROT | 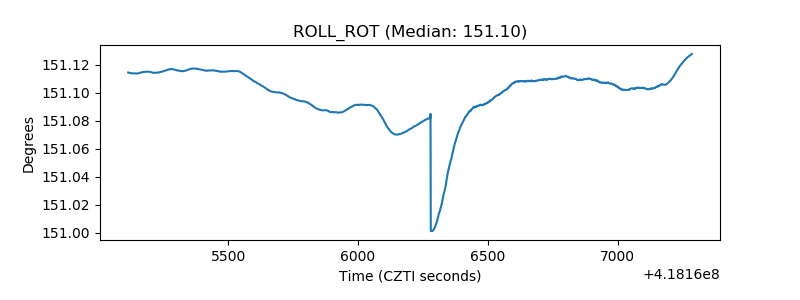 |
| _Roll_DEC | 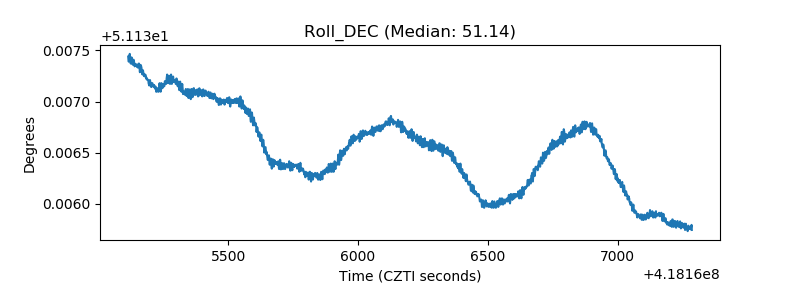 |
| _Roll_RA | 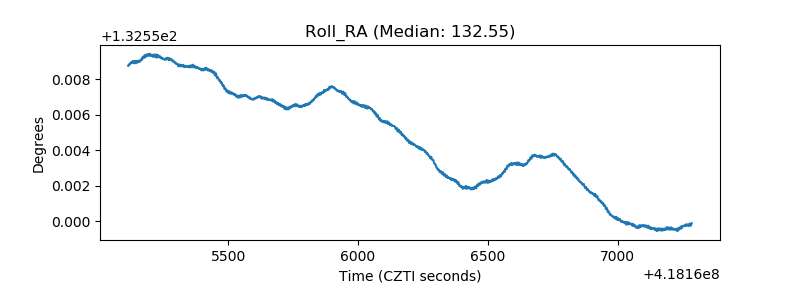 |
| Veto Counter | 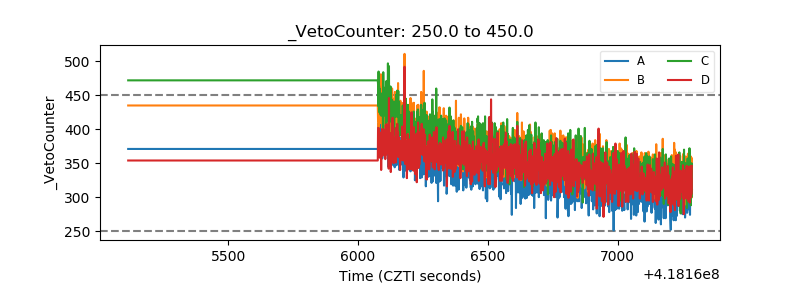 |