| Param | Original file | Final file |
|---|---|---|
| Filename | modeM0/AS1A12_054T02_9000005550_40615cztM0_level2.fits | modeM0/AS1A12_054T02_9000005550_40615cztM0_level2_quad_clean.evt |
| Size (bytes) | 75,899,520 | 19,598,400 |
| Size | 72.4 MB | 18.7 MB |
| Events in quadrant A | 682,116 | 132,176 |
| Events in quadrant B | 707,613 | 132,970 |
| Events in quadrant C | 584,049 | 128,323 |
| Events in quadrant D | 738,510 | 108,675 |
| Mode SS | |||
|---|---|---|---|
| Quadrant | BADHDUFLAG | Total packets | Discarded packets |
| A | 0 | 24 | 0 |
| B | 0 | 24 | 0 |
| C | 0 | 24 | 0 |
| D | 0 | 24 | 0 |
| Mode M0 | |||
|---|---|---|---|
| Quadrant | BADHDUFLAG | Total packets | Discarded packets |
| A | 0 | 2816 | 1 |
| B | 0 | 2916 | 1 |
| C | 0 | 2512 | 1 |
| D | 0 | 3009 | 1 |
| Mode M9 | |||
|---|---|---|---|
| Quadrant | BADHDUFLAG | Total packets | Discarded packets |
| A | 0 | 9 | 0 |
| B | 0 | 10 | 0 |
| C | 0 | 10 | 0 |
| D | 0 | 10 | 0 |
| Quadrant | Total seconds | Saturated seconds | Saturation percentage |
|---|---|---|---|
| A | 1210 | 6 | 0.495868% |
| B | 1210 | 21 | 1.735537% |
| C | 1210 | 6 | 0.495868% |
| D | 1210 | 127 | 10.495868% |
Noise dominated data is calculated using 1-second bins in cleaned event files. If a bin has >2000 counts, and if more than 50% of those come from <1% of pixels, then it is considered to be noise-dominated and hence unusable.
| Quadrant | # 1 sec bins | Bins with >0 counts | Bins with >2000 counts | High rate bins dominated by noise | Noise dominated (total time) | Noise dominated (detector-on time) | Marked lightcurve |
|---|---|---|---|---|---|---|---|
| A | 1210 | 1210 | 4 | 4 | 0.33% | 0.33% | 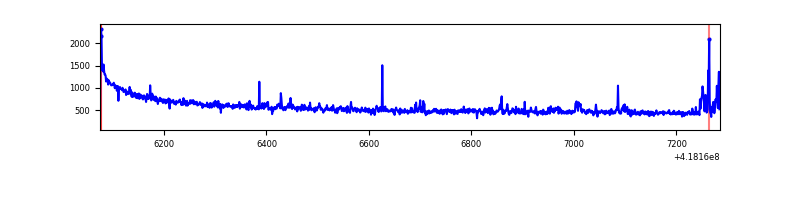 |
| B | 1210 | 1210 | 12 | 12 | 0.99% | 0.99% | 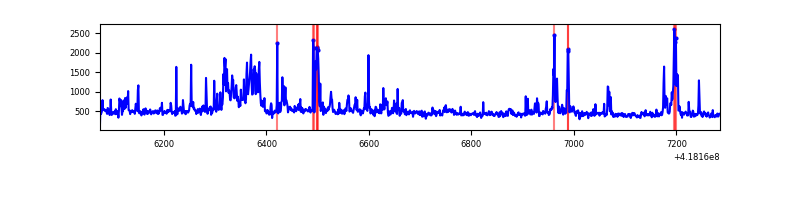 |
| C | 1210 | 1210 | 4 | 4 | 0.33% | 0.33% | 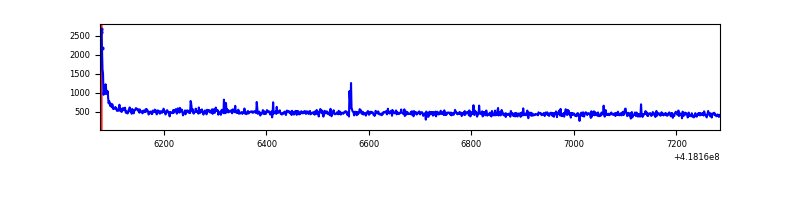 |
| D | 1210 | 1210 | 28 | 28 | 2.31% | 2.31% | 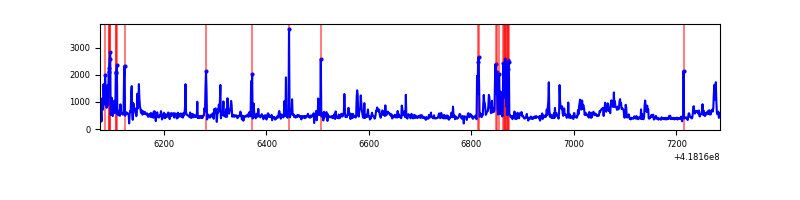 |
Top three noisy pixels from each quadrant. If the there are fewer than three noisy pixels in the level2.evt file, extra rows are filled as -1
| Pixel properties | Quadrant properties | ||||||
|---|---|---|---|---|---|---|---|
| Quadrant | DetID | PixID | Counts | Sigma | Mean | Median | Sigma |
| A | 10 | 83 | 163162 | 5846.27 | 126 | 123 | 27.9 |
| A | 6 | 10 | 25620 | 914.27 | 126 | 123 | 27.9 |
| A | 10 | 67 | 1923 | 64.54 | 126 | 123 | 27.9 |
| B | 5 | 255 | 101729 | 3785.17 | 126 | 123 | 26.8 |
| B | 0 | 229 | 51921 | 1929.65 | 126 | 123 | 26.8 |
| B | 0 | 190 | 27061 | 1003.53 | 126 | 123 | 26.8 |
| C | 15 | 214 | 56369 | 1764.84 | 127 | 128 | 31.9 |
| C | 0 | 10 | 19473 | 607.05 | 127 | 128 | 31.9 |
| C | 9 | 187 | 7087 | 218.37 | 127 | 128 | 31.9 |
| D | 12 | 227 | 75090 | 2415.4 | 119 | 115 | 31.0 |
| D | 13 | 249 | 68739 | 2210.8 | 119 | 115 | 31.0 |
| D | 12 | 191 | 39996 | 1284.81 | 119 | 115 | 31.0 |
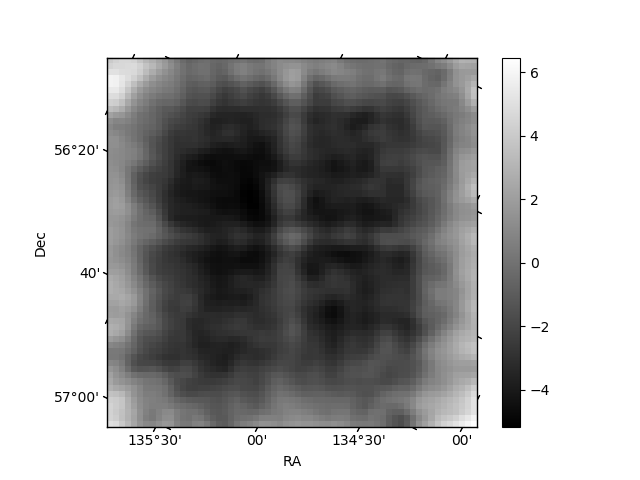
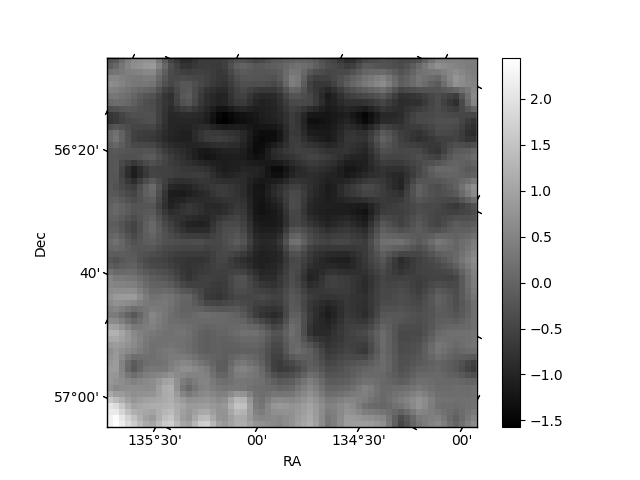
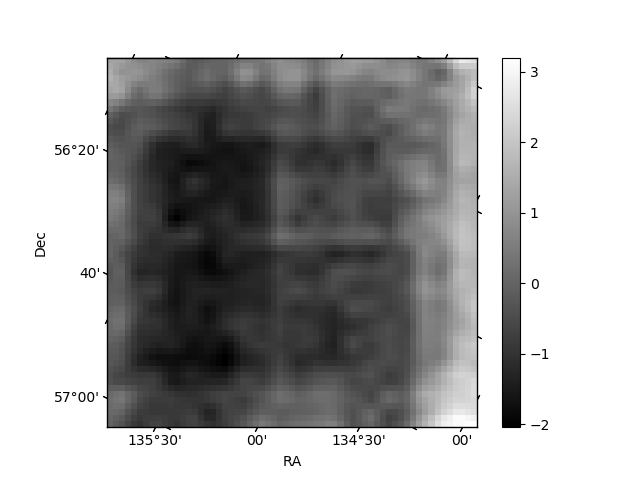
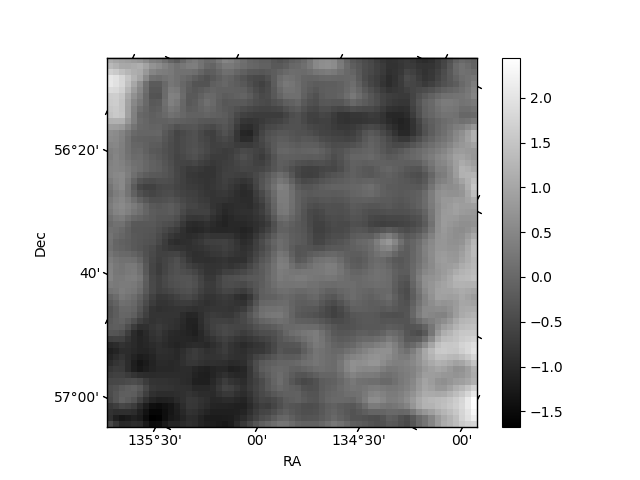
Histogram calculated using DETX and DETY for each event in the final _common_clean file
| Quadrant A | 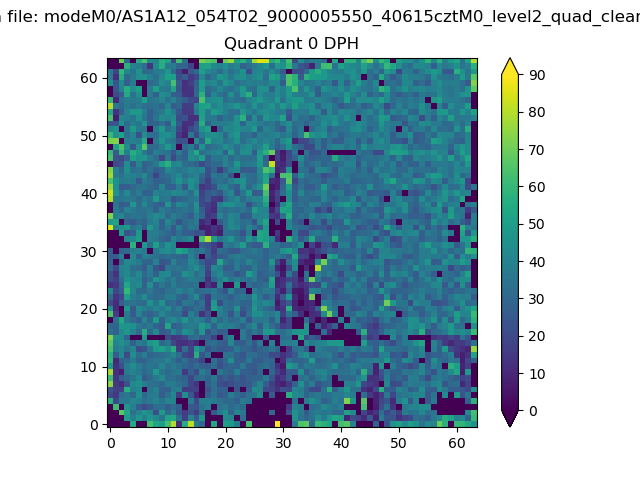 |
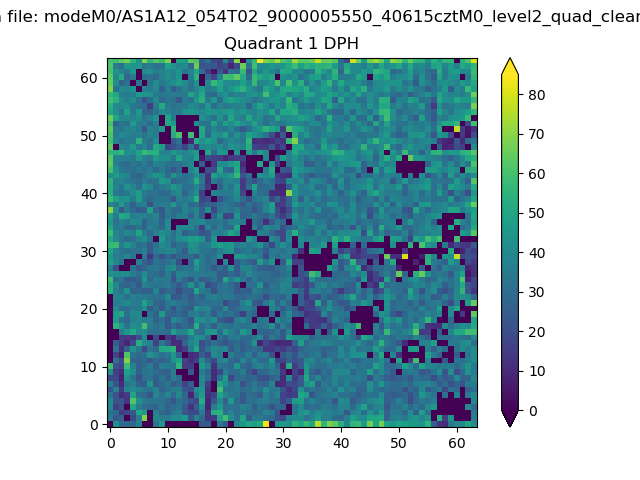 |
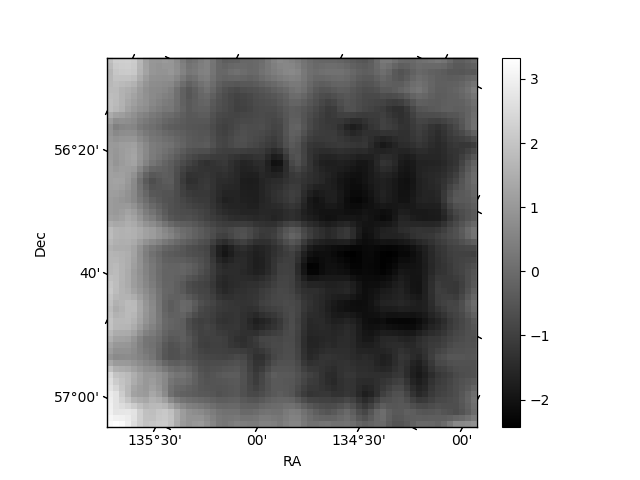
Quadrant B |
|---|---|---|---|
| Quadrant D | 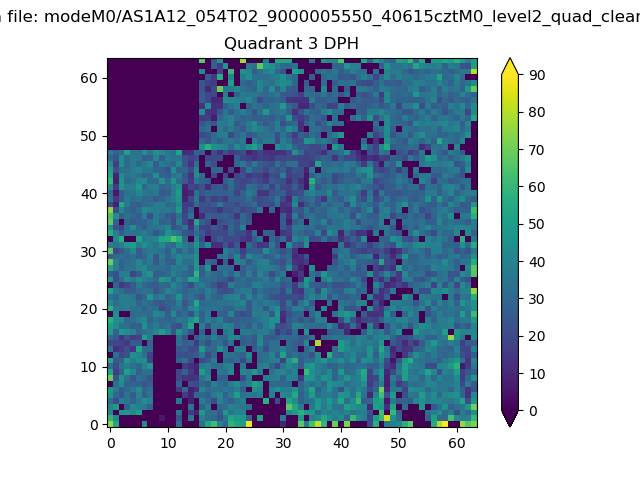 |
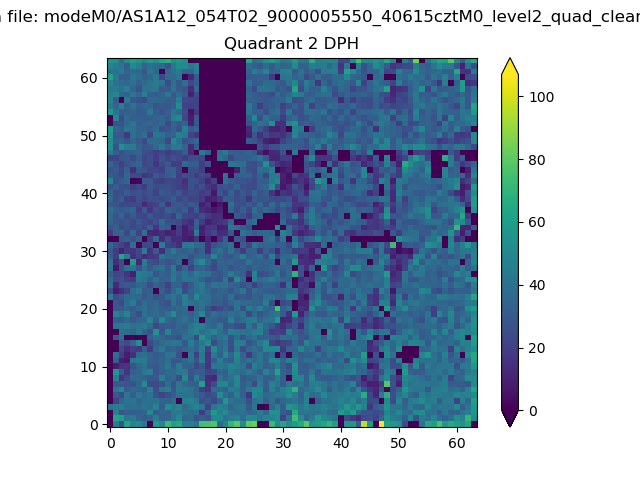 |
Quadrant C |
| Plot type | Count rate plots | Images |
|---|---|---|
| Comparison with Poisson distribution Blue bars denote a histogram of data divided into 1 sec bins. Red curve is a Poisson curve with rate = median count rate of data. |
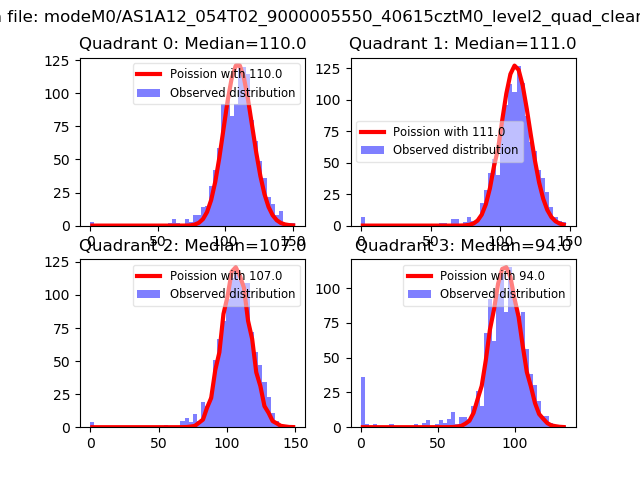 |
 |
| Quadrant-wise count rates Data is divided into 100 sec bins |
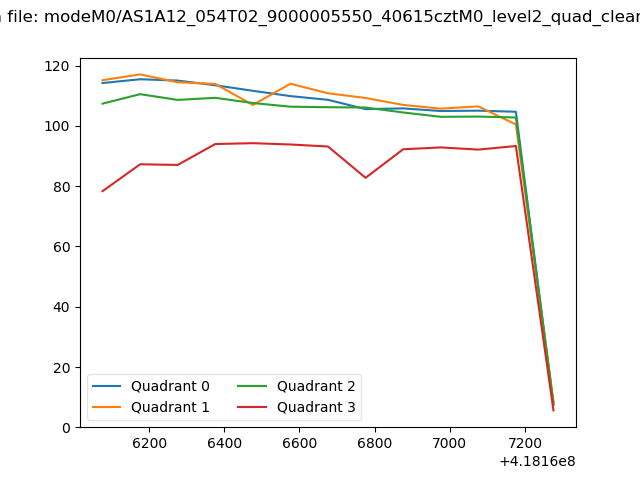 |
|
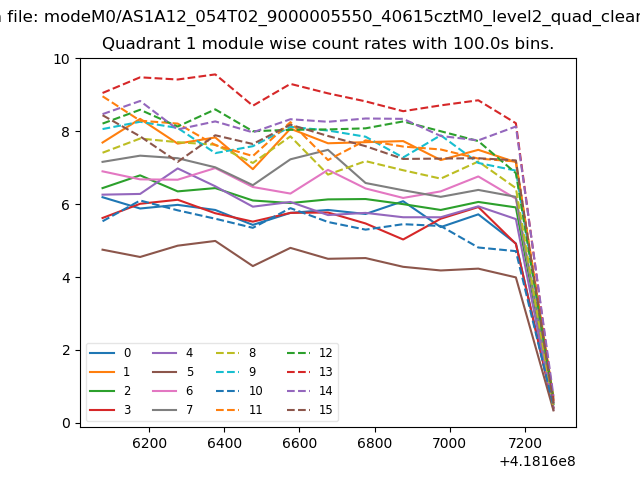
| Module-wise count rates for Quadrant A Data is divided into 100 sec bins |
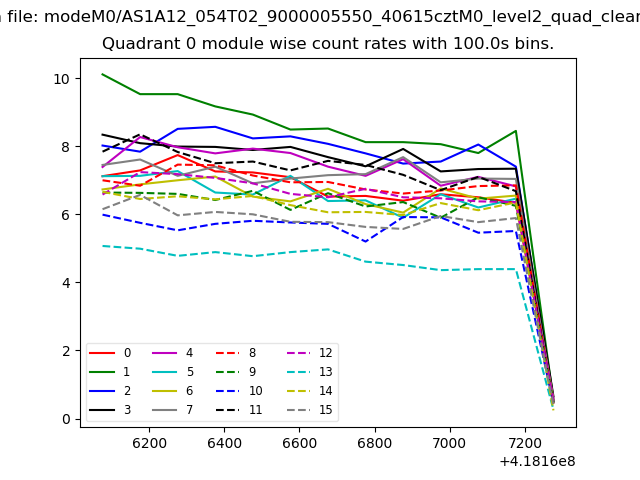 |
 |
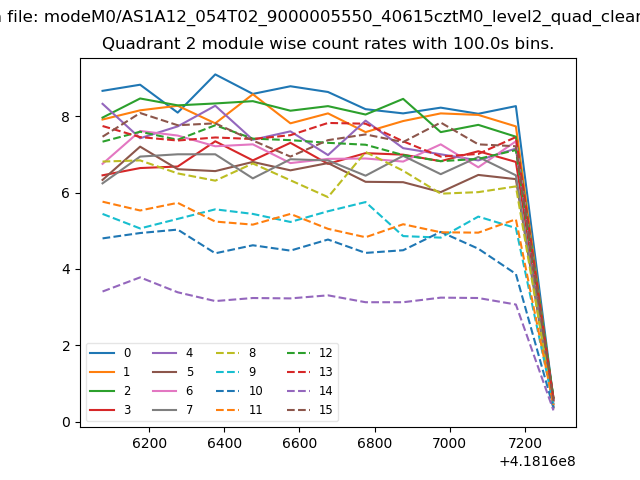
| Module-wise count rates for Quadrant B Data is divided into 100 sec bins |
 |
 |
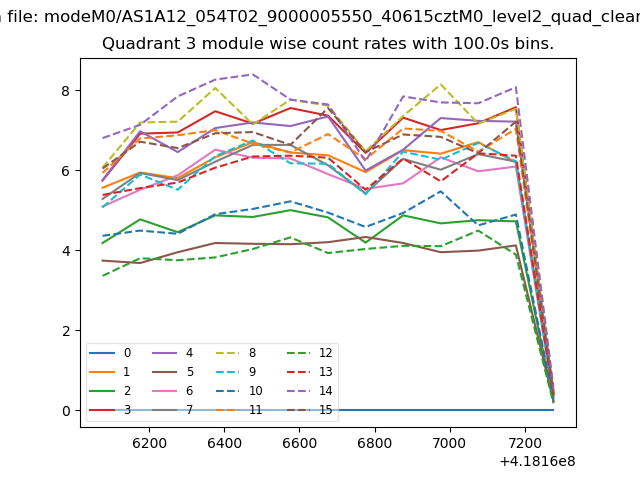
| Module-wise count rates for Quadrant C Data is divided into 100 sec bins |
 |
 |
| Module-wise count rates for Quadrant D Data is divided into 100 sec bins |
 |
 |
| Parameter | Plot |
|---|---|
| CZT HV Monitor | 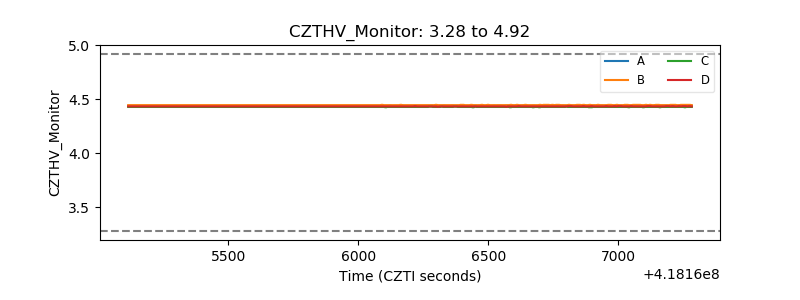 |
| D_VDD | 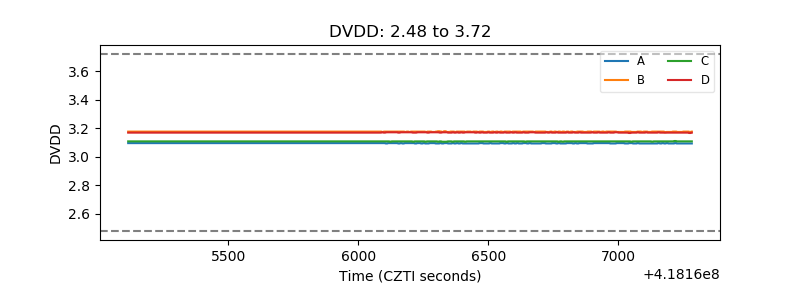 |
| Temperature 1 | 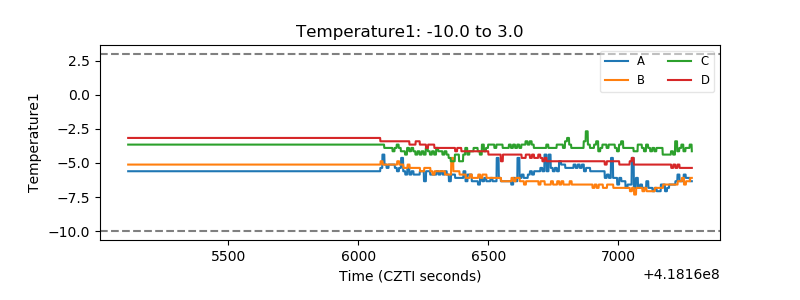 |
| Veto HV Monitor |  |
| Veto LLD | 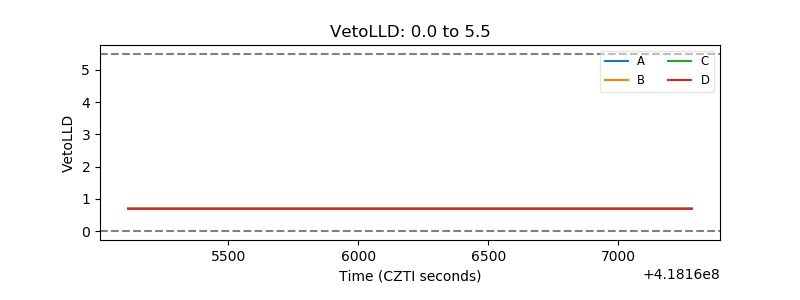 |
| Alpha Counter | 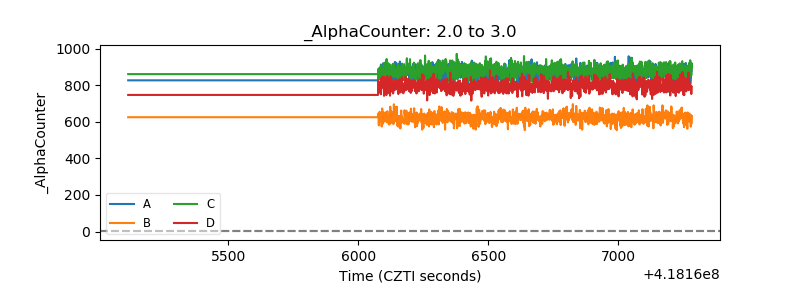 |
| _CPM_Rate | 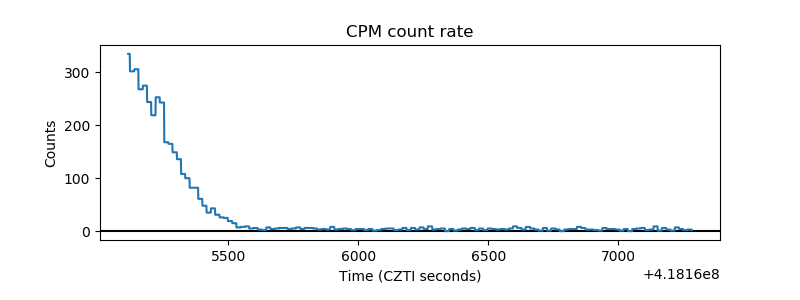 |
| CZT Counter | 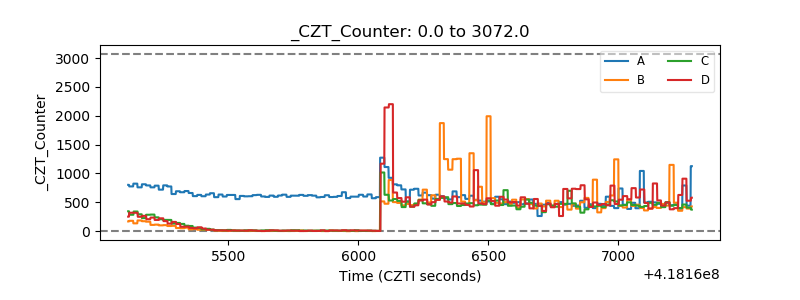 |
| +2.5 Volts monitor | 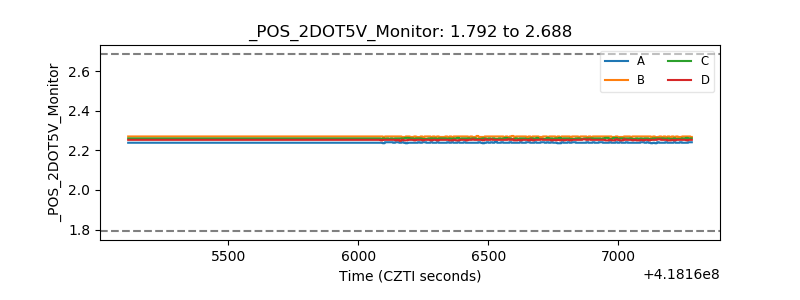 |
| +5 Volts monitor | 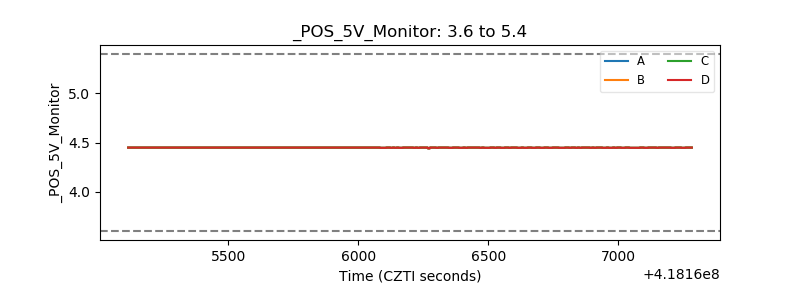 |
| _ROLL_ROT | 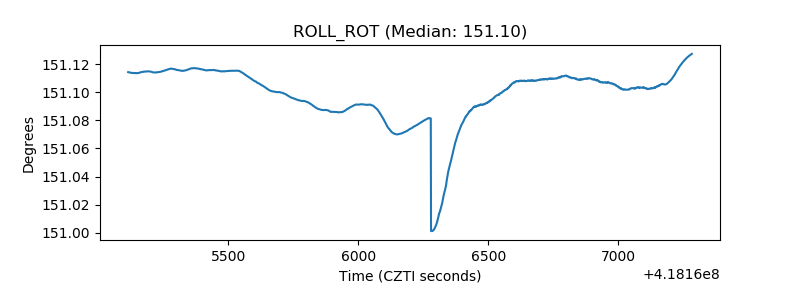 |
| _Roll_DEC | 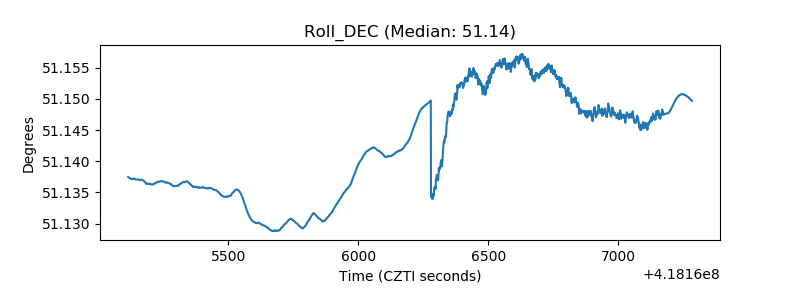 |
| _Roll_RA | 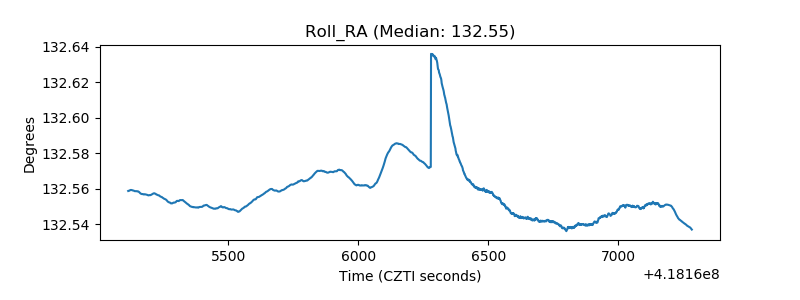 |
| Veto Counter | 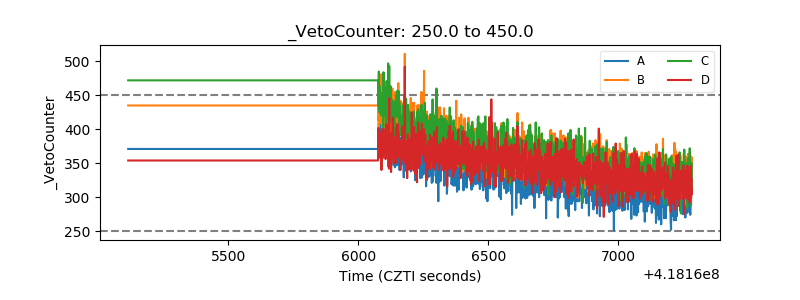 |