| Param | Original file | Final file |
|---|---|---|
| Filename | modeM0/AS1A12_011T59_9000005552_40615cztM0_level2.fits | modeM0/AS1A12_011T59_9000005552_40615cztM0_level2_quad_clean.evt |
| Size (bytes) | 221,371,200 | 59,054,400 |
| Size | 211.1 MB | 56.3 MB |
| Events in quadrant A | 1,898,121 | 395,707 |
| Events in quadrant B | 1,901,686 | 409,889 |
| Events in quadrant C | 1,730,225 | 397,076 |
| Events in quadrant D | 2,379,322 | 328,014 |
| Mode M0 | |||
|---|---|---|---|
| Quadrant | BADHDUFLAG | Total packets | Discarded packets |
| A | 0 | 7990 | 1 |
| B | 0 | 8116 | 1 |
| C | 0 | 7461 | 1 |
| D | 0 | 9673 | 4 |
| Mode M9 | |||
|---|---|---|---|
| Quadrant | BADHDUFLAG | Total packets | Discarded packets |
| A | 0 | 17 | 0 |
| B | 0 | 17 | 0 |
| C | 0 | 17 | 0 |
| D | 0 | 17 | 0 |
| Mode SS | |||
|---|---|---|---|
| Quadrant | BADHDUFLAG | Total packets | Discarded packets |
| A | 0 | 74 | 0 |
| B | 0 | 74 | 0 |
| C | 0 | 74 | 0 |
| D | 0 | 74 | 0 |
| Quadrant | Total seconds | Saturated seconds | Saturation percentage |
|---|---|---|---|
| A | 3639 | 10 | 0.274801% |
| B | 3639 | 21 | 0.577082% |
| C | 3639 | 9 | 0.247321% |
| D | 3638 | 435 | 11.957119% |
Noise dominated data is calculated using 1-second bins in cleaned event files. If a bin has >2000 counts, and if more than 50% of those come from <1% of pixels, then it is considered to be noise-dominated and hence unusable.
| Quadrant | # 1 sec bins | Bins with >0 counts | Bins with >2000 counts | High rate bins dominated by noise | Noise dominated (total time) | Noise dominated (detector-on time) | Marked lightcurve |
|---|---|---|---|---|---|---|---|
| A | 5282 | 3640 | 2 | 2 | 0.04% | 0.05% |  |
| B | 5282 | 3640 | 14 | 14 | 0.27% | 0.38% |  |
| C | 5282 | 3640 | 9 | 9 | 0.17% | 0.25% | 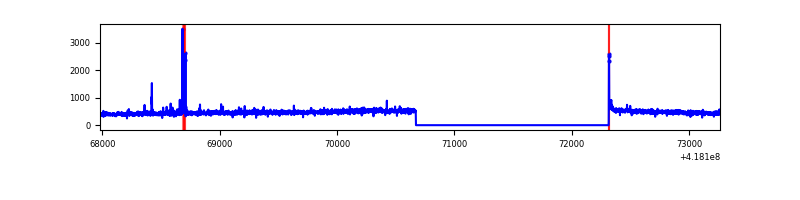 |
| D | 5281 | 3639 | 141 | 141 | 2.67% | 3.87% | 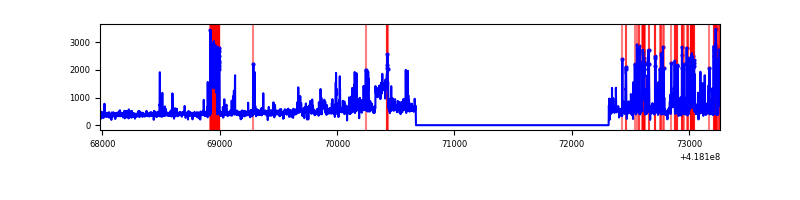 |
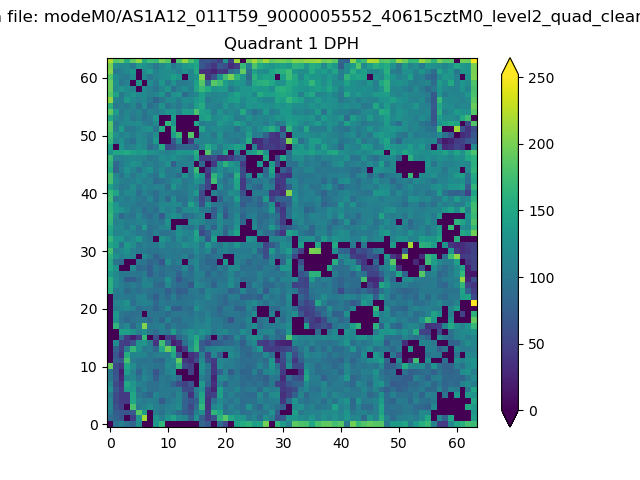
Top three noisy pixels from each quadrant. If the there are fewer than three noisy pixels in the level2.evt file, extra rows are filled as -1
| Pixel properties | Quadrant properties | ||||||
|---|---|---|---|---|---|---|---|
| Quadrant | DetID | PixID | Counts | Sigma | Mean | Median | Sigma |
| A | 10 | 83 | 293920 | 3529.37 | 395 | 387 | 83.2 |
| A | 13 | 252 | 35449 | 421.58 | 395 | 387 | 83.2 |
| A | 2 | 79 | 24272 | 287.19 | 395 | 387 | 83.2 |
| B | 0 | 229 | 125996 | 1624.38 | 392 | 381 | 77.3 |
| B | 3 | 112 | 95395 | 1228.66 | 392 | 381 | 77.3 |
| B | 0 | 190 | 70382 | 905.21 | 392 | 381 | 77.3 |
| C | 15 | 214 | 154656 | 1704.86 | 385 | 387 | 90.5 |
| C | 14 | 254 | 35481 | 387.83 | 385 | 387 | 90.5 |
| C | 0 | 10 | 13904 | 149.38 | 385 | 387 | 90.5 |
| D | 12 | 227 | 664938 | 7377.63 | 362 | 352 | 90.1 |
| D | 12 | 191 | 107055 | 1184.52 | 362 | 352 | 90.1 |
| D | 13 | 249 | 73701 | 814.25 | 362 | 352 | 90.1 |
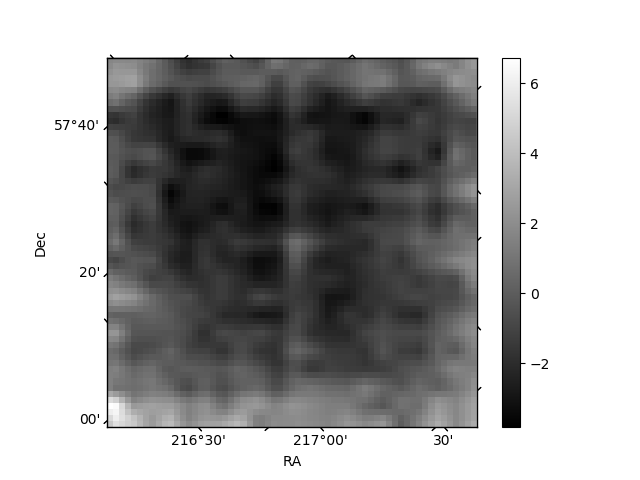
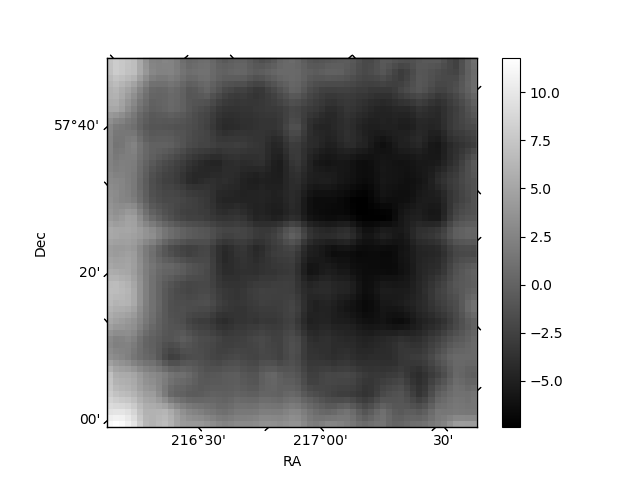
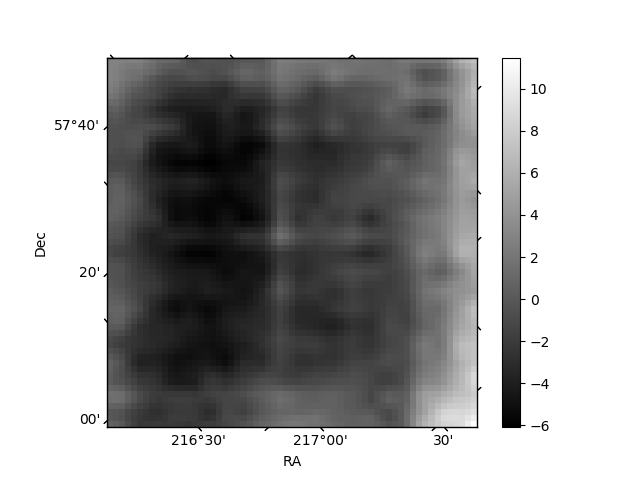
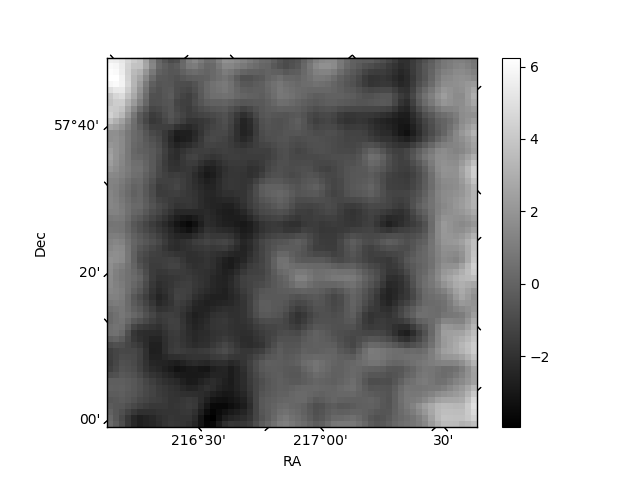
Histogram calculated using DETX and DETY for each event in the final _common_clean file
| Quadrant A | 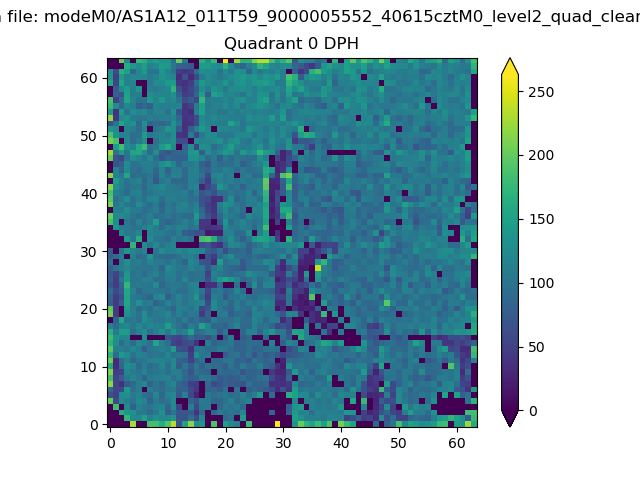 |
 |
Quadrant B |
|---|---|---|---|
| Quadrant D | 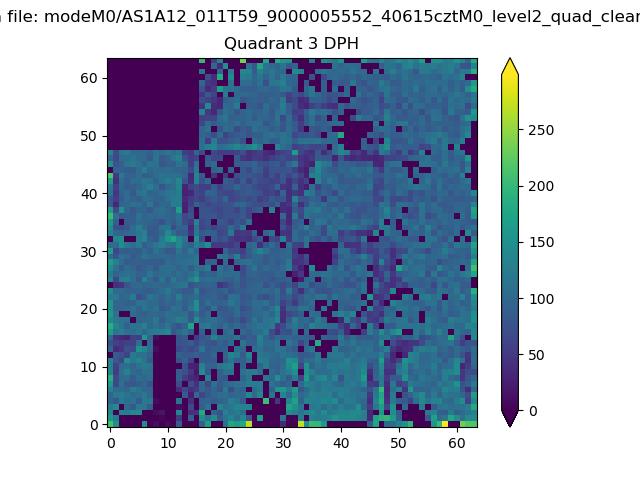 |
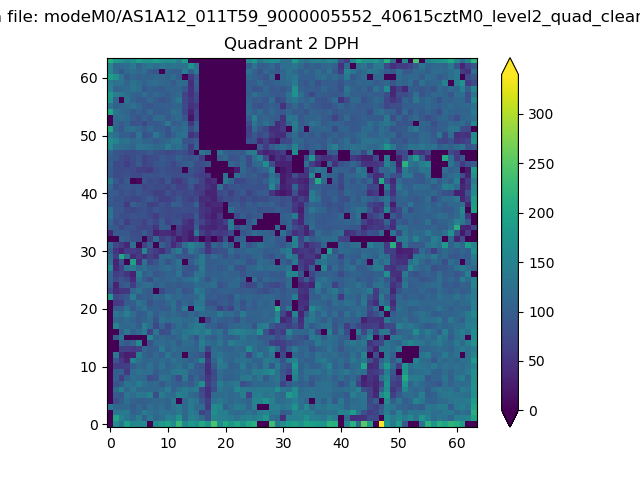 |
Quadrant C |
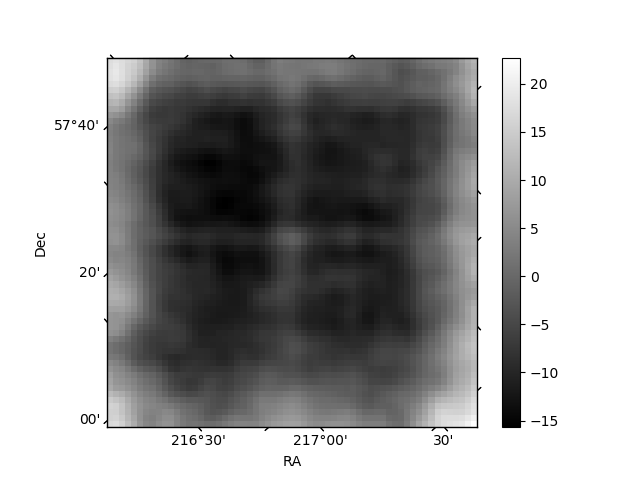
| Plot type | Count rate plots | Images |
|---|---|---|
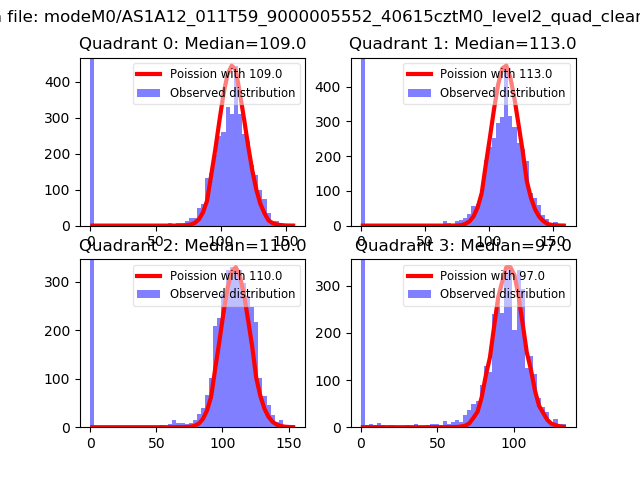
| Comparison with Poisson distribution Blue bars denote a histogram of data divided into 1 sec bins. Red curve is a Poisson curve with rate = median count rate of data. |
 |
 |
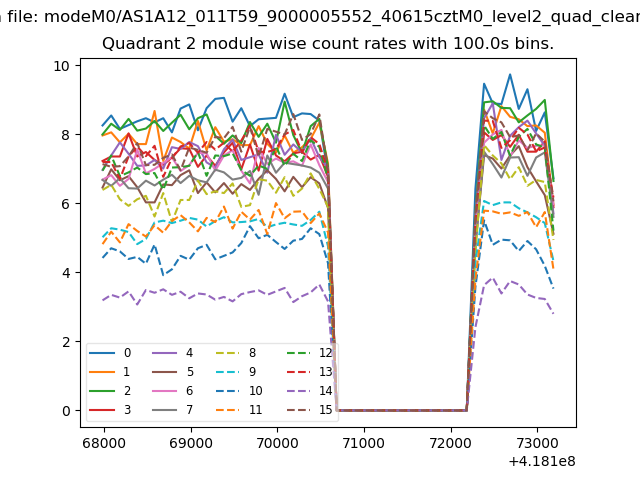
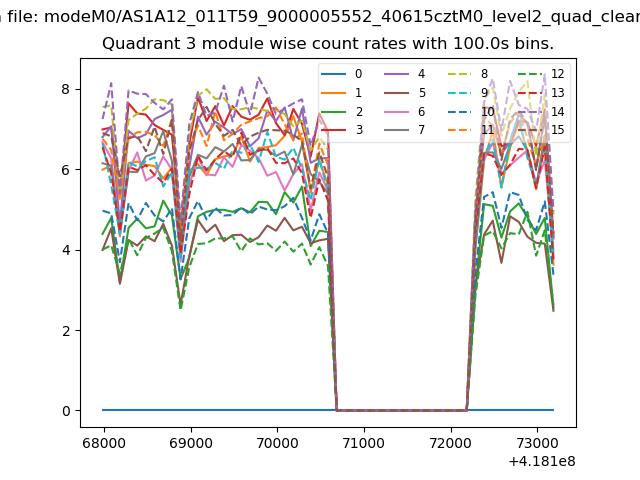
| Quadrant-wise count rates Data is divided into 100 sec bins |
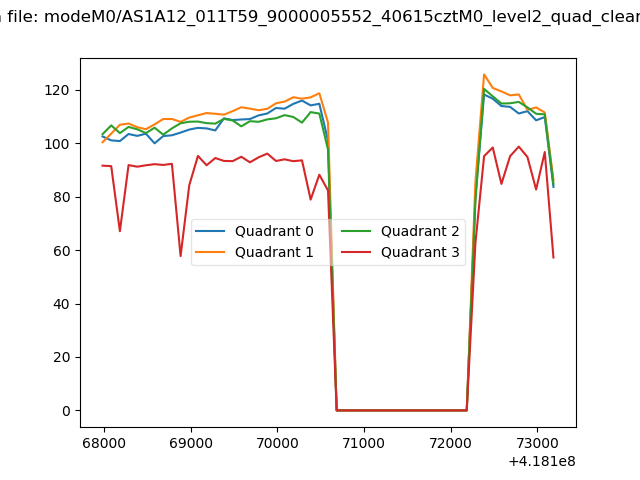 |
|
| Module-wise count rates for Quadrant A Data is divided into 100 sec bins |
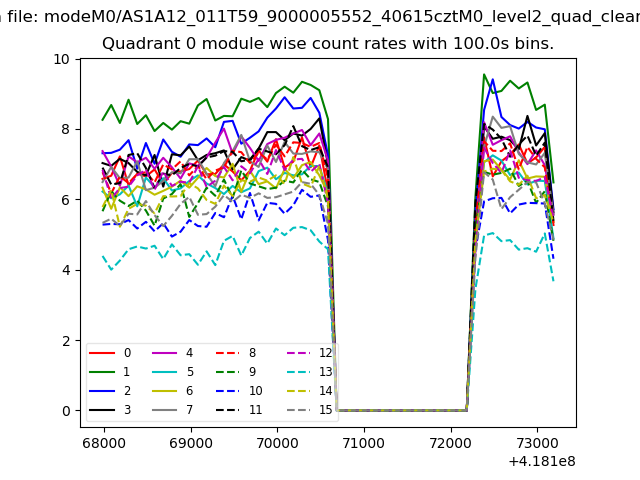 |
 |
| Module-wise count rates for Quadrant B Data is divided into 100 sec bins |
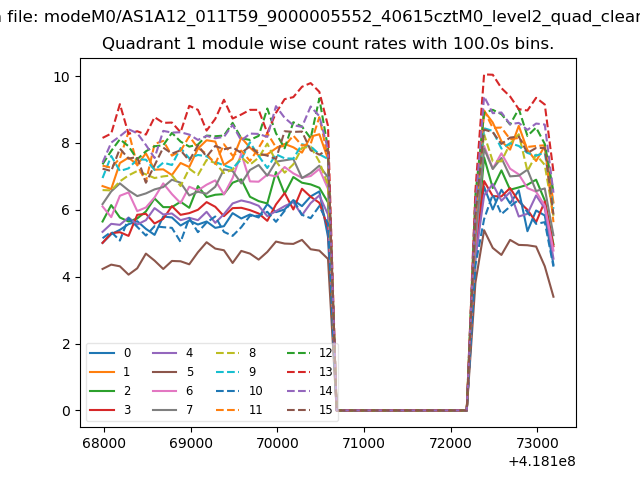 |
 |
| Module-wise count rates for Quadrant C Data is divided into 100 sec bins |
 |
 |
| Module-wise count rates for Quadrant D Data is divided into 100 sec bins |
 |
 |
| Parameter | Plot |
|---|---|
| CZT HV Monitor | 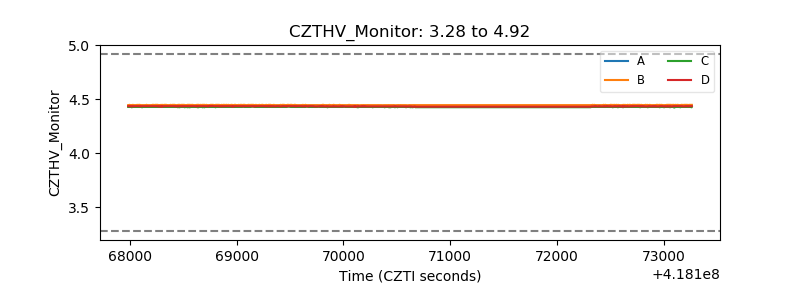 |
| D_VDD | 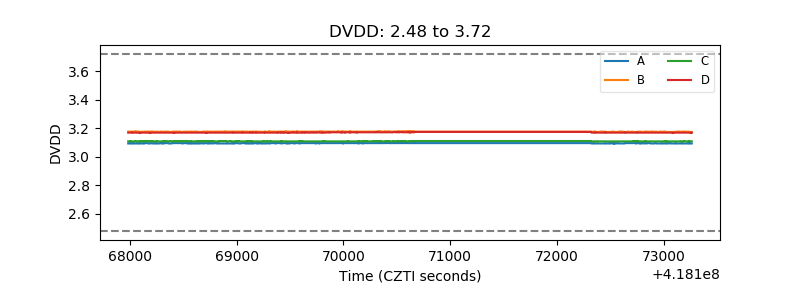 |
| Temperature 1 | 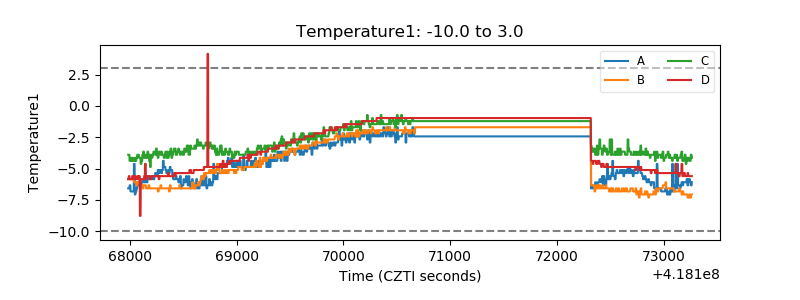 |
| Veto HV Monitor | 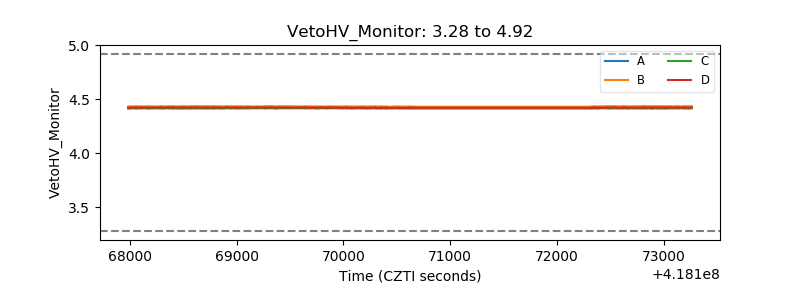 |
| Veto LLD | 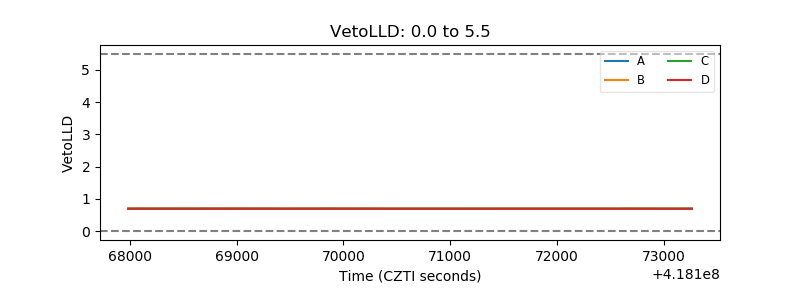 |
| Alpha Counter | 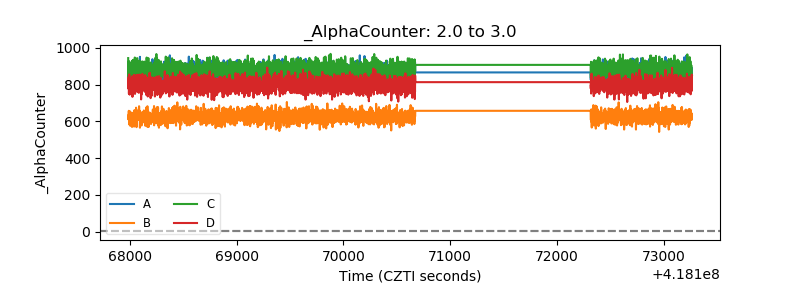 |
| _CPM_Rate | 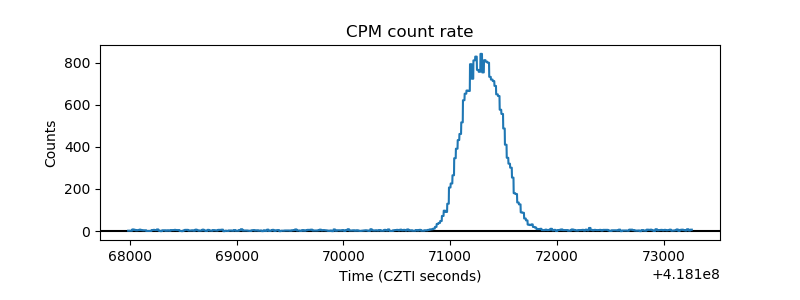 |
| CZT Counter | 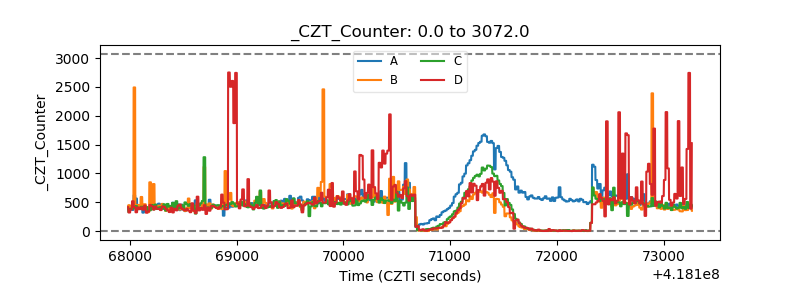 |
| +2.5 Volts monitor | 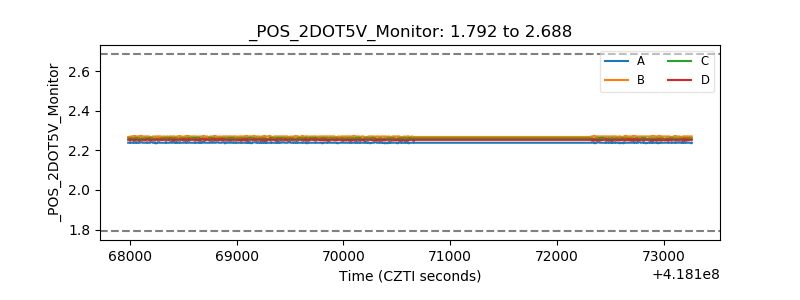 |
| +5 Volts monitor | 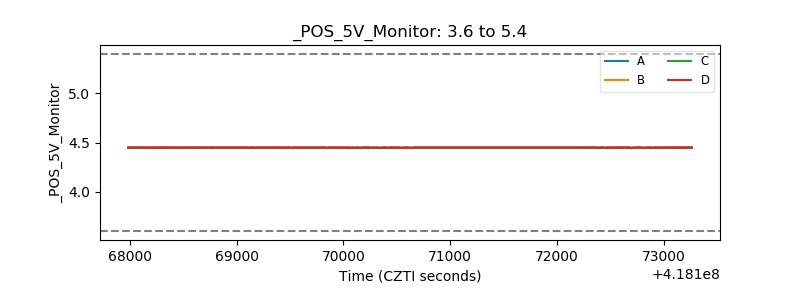 |
| _ROLL_ROT | 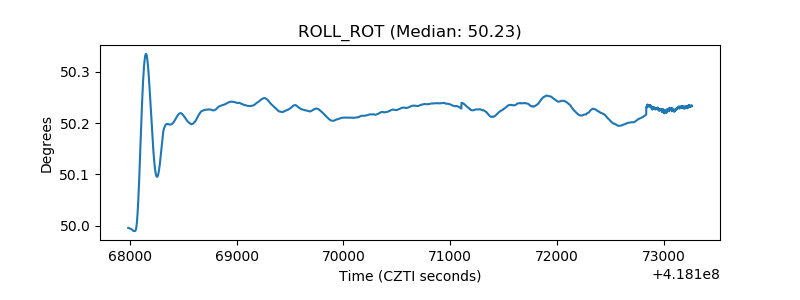 |
| _Roll_DEC | 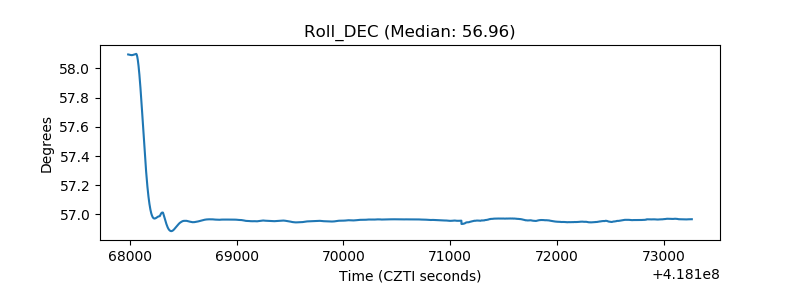 |
| _Roll_RA | 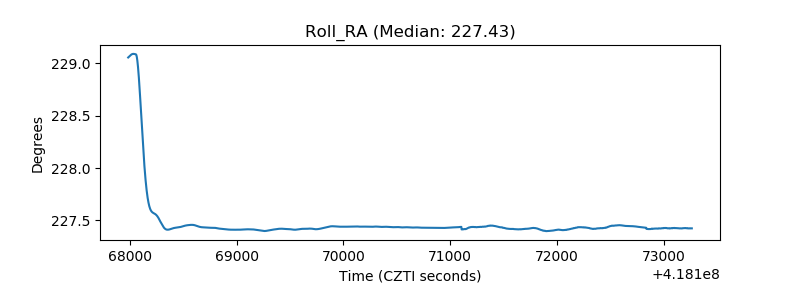 |
| Veto Counter | 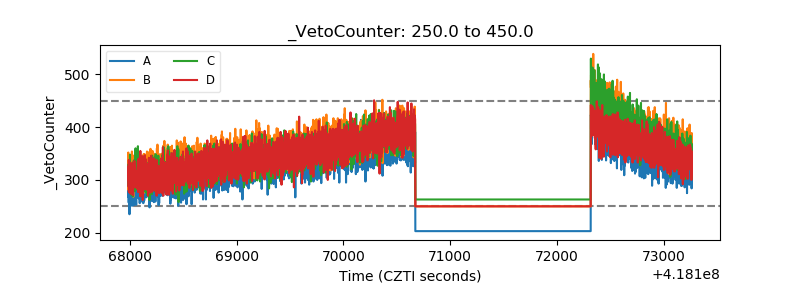 |