| Param | Original file | Final file |
|---|---|---|
| Filename | modeM0/AS1A12_011T59_9000005552_40617cztM0_level2.fits | modeM0/AS1A12_011T59_9000005552_40617cztM0_level2_quad_clean.evt |
| Size (bytes) | 320,025,600 | 85,250,880 |
| Size | 305.2 MB | 81.3 MB |
| Events in quadrant A | 2,686,320 | 573,070 |
| Events in quadrant B | 2,624,834 | 593,424 |
| Events in quadrant C | 2,441,506 | 575,617 |
| Events in quadrant D | 3,686,894 | 473,928 |
| Mode M0 | |||
|---|---|---|---|
| Quadrant | BADHDUFLAG | Total packets | Discarded packets |
| A | 0 | 11316 | 3 |
| B | 0 | 11258 | 2 |
| C | 0 | 10680 | 2 |
| D | 0 | 14609 | 2 |
| Mode M9 | |||
|---|---|---|---|
| Quadrant | BADHDUFLAG | Total packets | Discarded packets |
| A | 0 | 28 | 0 |
| B | 0 | 28 | 0 |
| C | 0 | 28 | 0 |
| D | 0 | 29 | 0 |
| Mode SS | |||
|---|---|---|---|
| Quadrant | BADHDUFLAG | Total packets | Discarded packets |
| A | 0 | 106 | 0 |
| B | 0 | 106 | 0 |
| C | 0 | 106 | 0 |
| D | 0 | 106 | 0 |
| Quadrant | Total seconds | Saturated seconds | Saturation percentage |
|---|---|---|---|
| A | 5213 | 12 | 0.230194% |
| B | 5213 | 22 | 0.422022% |
| C | 5213 | 18 | 0.345291% |
| D | 5213 | 623 | 11.950892% |
Noise dominated data is calculated using 1-second bins in cleaned event files. If a bin has >2000 counts, and if more than 50% of those come from <1% of pixels, then it is considered to be noise-dominated and hence unusable.
| Quadrant | # 1 sec bins | Bins with >0 counts | Bins with >2000 counts | High rate bins dominated by noise | Noise dominated (total time) | Noise dominated (detector-on time) | Marked lightcurve |
|---|---|---|---|---|---|---|---|
| A | 7005 | 5214 | 4 | 4 | 0.06% | 0.08% | 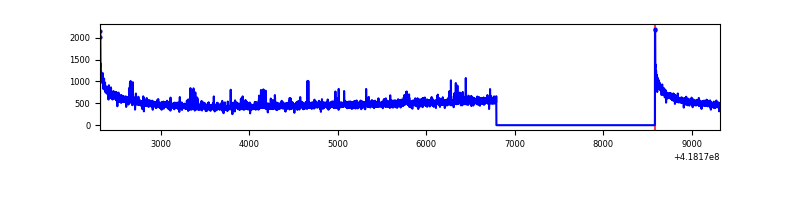 |
| B | 7005 | 5214 | 15 | 15 | 0.21% | 0.29% | 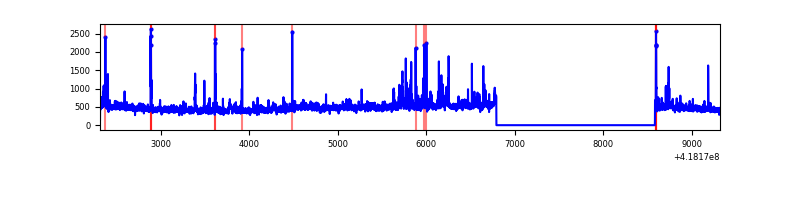 |
| C | 7005 | 5214 | 17 | 17 | 0.24% | 0.33% | 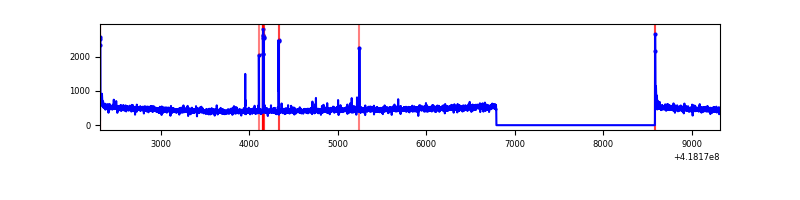 |
| D | 7005 | 5213 | 284 | 284 | 4.05% | 5.45% | 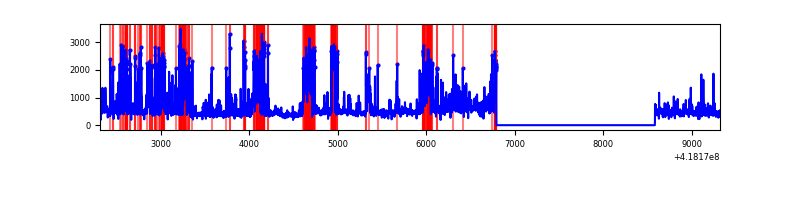 |
Top three noisy pixels from each quadrant. If the there are fewer than three noisy pixels in the level2.evt file, extra rows are filled as -1
| Pixel properties | Quadrant properties | ||||||
|---|---|---|---|---|---|---|---|
| Quadrant | DetID | PixID | Counts | Sigma | Mean | Median | Sigma |
| A | 10 | 83 | 474816 | 4123.94 | 554 | 542 | 115.0 |
| A | 2 | 79 | 53055 | 456.61 | 554 | 542 | 115.0 |
| A | 12 | 189 | 14448 | 120.92 | 554 | 542 | 115.0 |
| B | 0 | 229 | 162706 | 1523.64 | 554 | 538 | 106.4 |
| B | 3 | 112 | 107661 | 1006.47 | 554 | 538 | 106.4 |
| B | 0 | 190 | 78974 | 736.94 | 554 | 538 | 106.4 |
| C | 15 | 214 | 225786 | 1779.9 | 544 | 548 | 126.5 |
| C | 14 | 254 | 37911 | 295.25 | 544 | 548 | 126.5 |
| C | 0 | 10 | 29699 | 230.36 | 544 | 548 | 126.5 |
| D | 12 | 227 | 1130586 | 8966.17 | 508 | 493 | 126.0 |
| D | 2 | 153 | 183102 | 1448.82 | 508 | 493 | 126.0 |
| D | 12 | 191 | 150239 | 1188.09 | 508 | 493 | 126.0 |
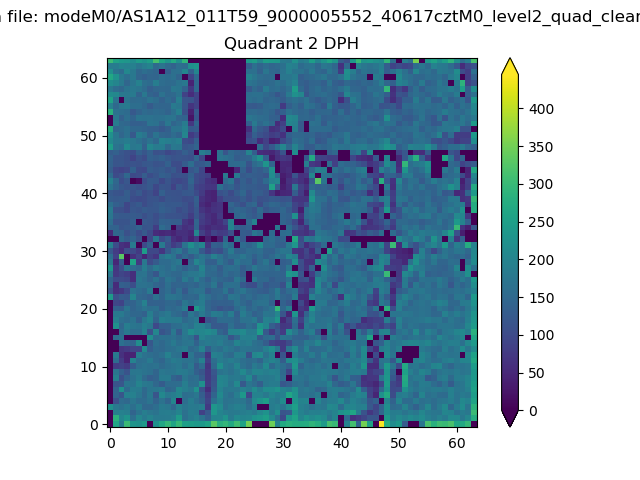
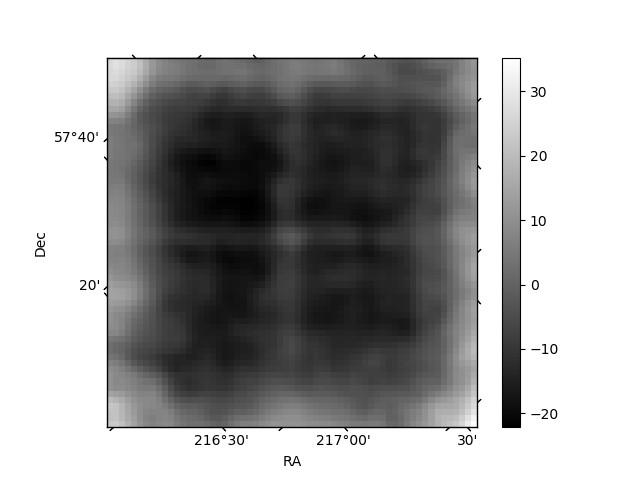
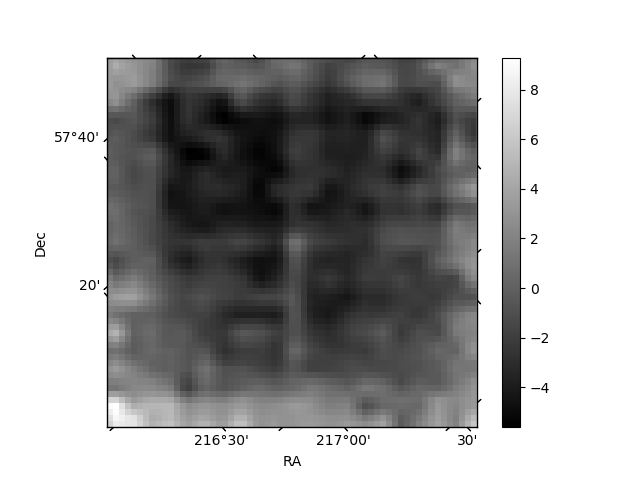
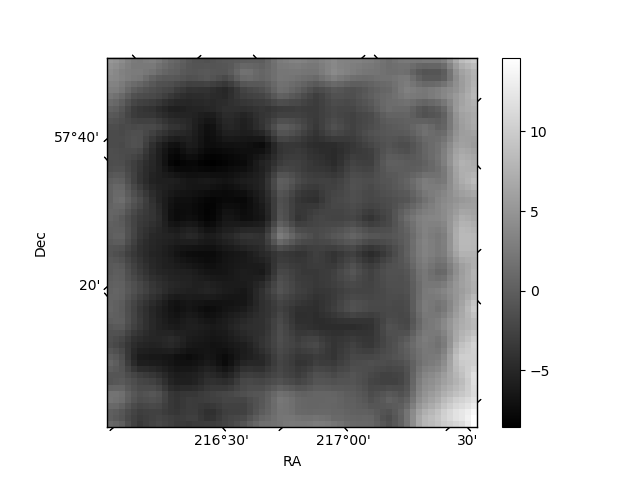
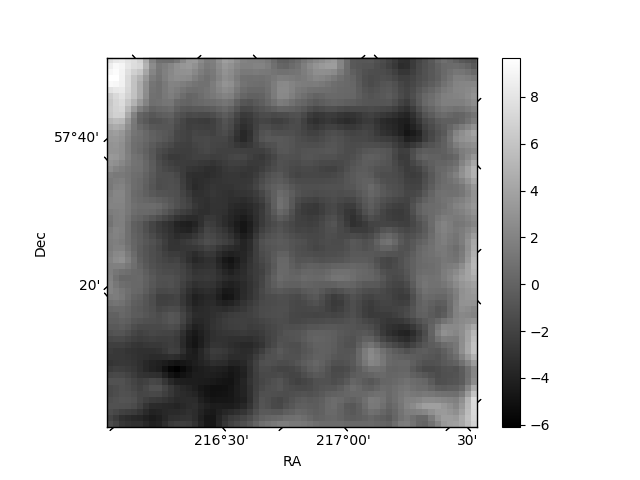
Histogram calculated using DETX and DETY for each event in the final _common_clean file
| Quadrant A | 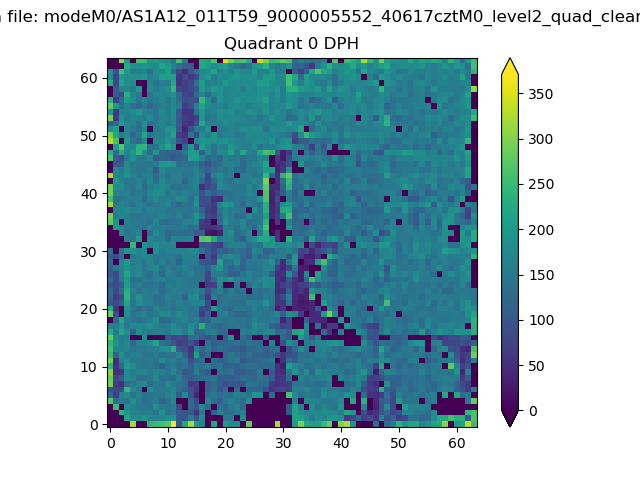 |
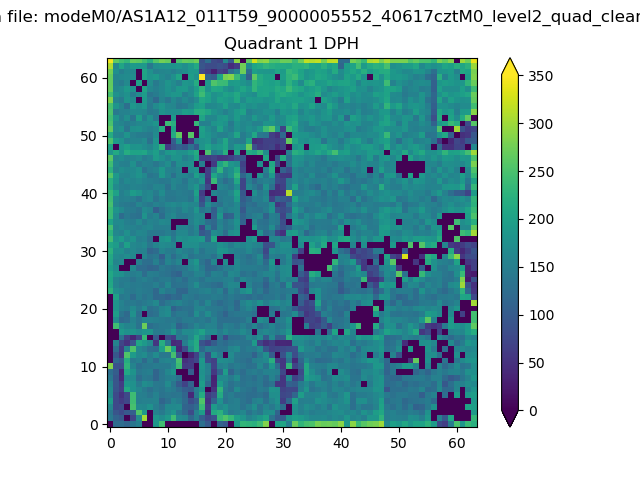 |
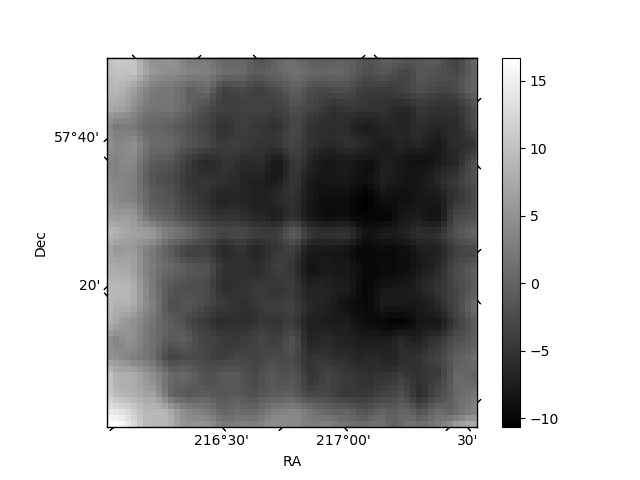
Quadrant B |
|---|---|---|---|
| Quadrant D | 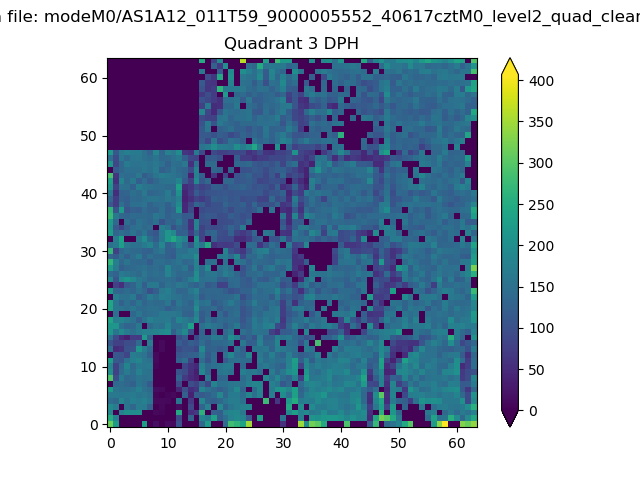 |
 |
Quadrant C |
| Plot type | Count rate plots | Images |
|---|---|---|
| Comparison with Poisson distribution Blue bars denote a histogram of data divided into 1 sec bins. Red curve is a Poisson curve with rate = median count rate of data. |
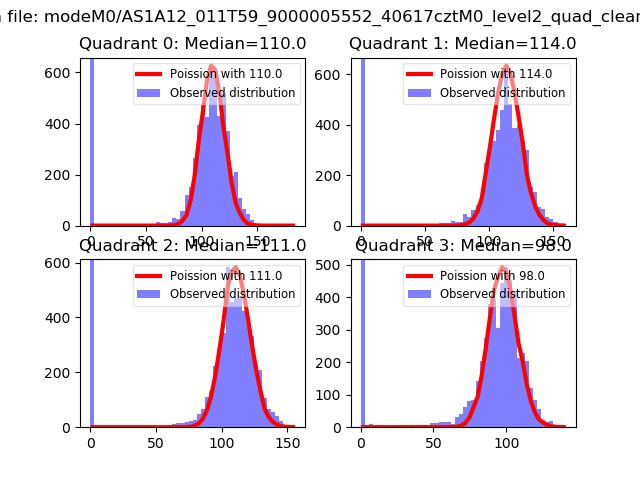 |
 |
| Quadrant-wise count rates Data is divided into 100 sec bins |
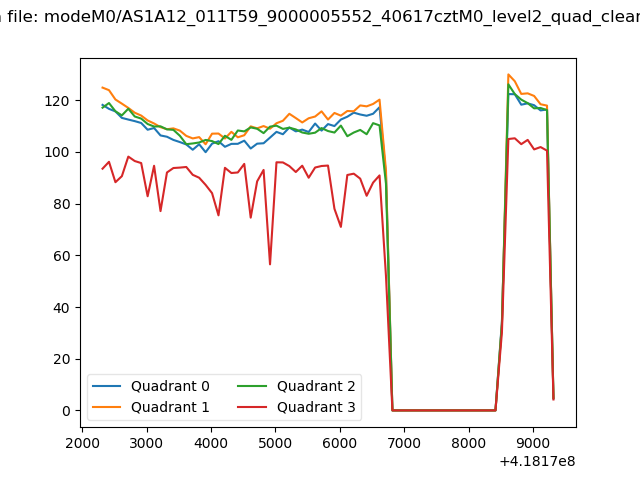 |
|
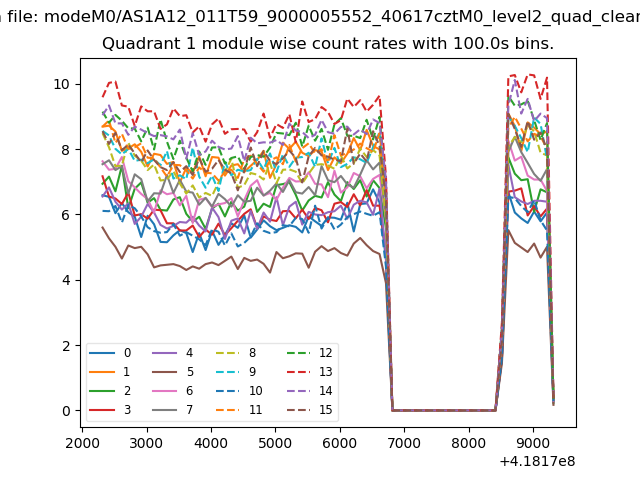
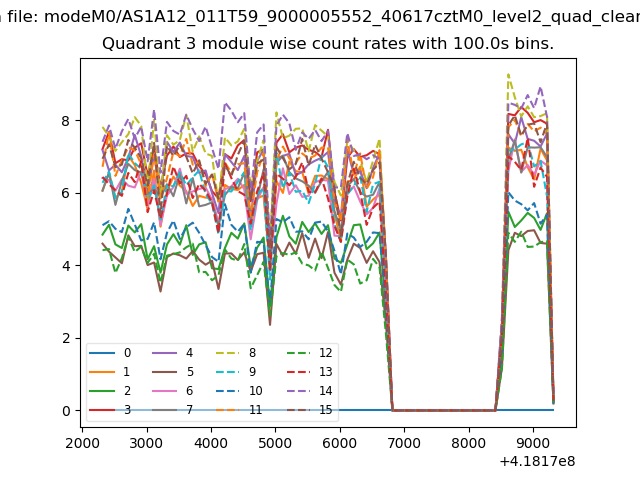
| Module-wise count rates for Quadrant A Data is divided into 100 sec bins |
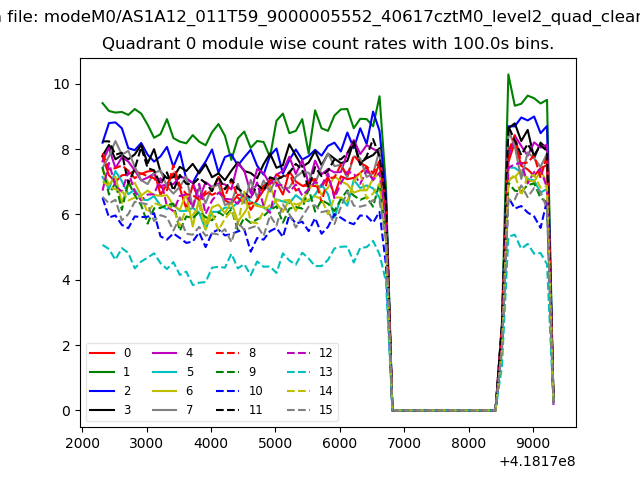 |
 |
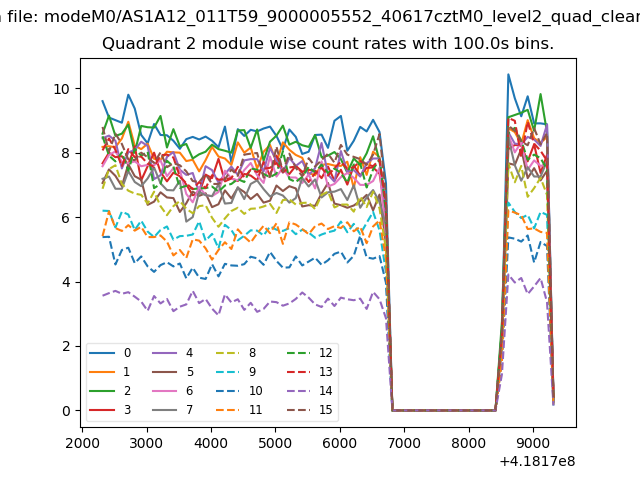
| Module-wise count rates for Quadrant B Data is divided into 100 sec bins |
 |
 |
| Module-wise count rates for Quadrant C Data is divided into 100 sec bins |
 |
 |
| Module-wise count rates for Quadrant D Data is divided into 100 sec bins |
 |
 |
| Parameter | Plot |
|---|---|
| CZT HV Monitor | 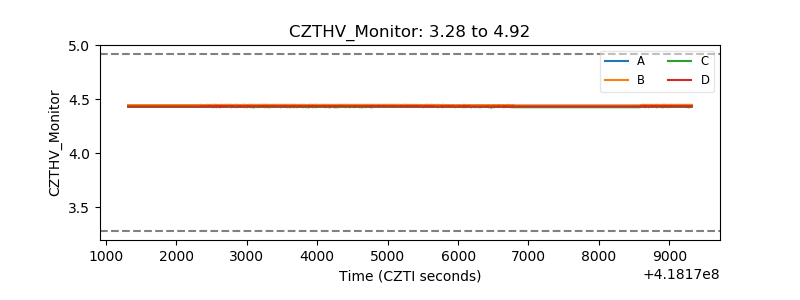 |
| D_VDD | 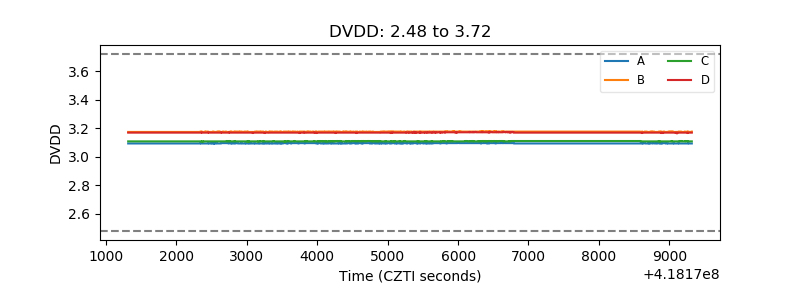 |
| Temperature 1 | 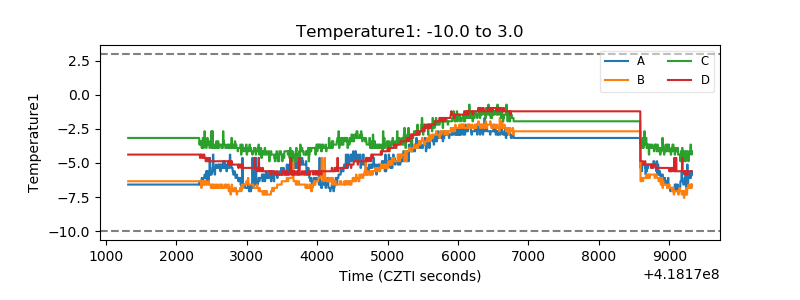 |
| Veto HV Monitor | 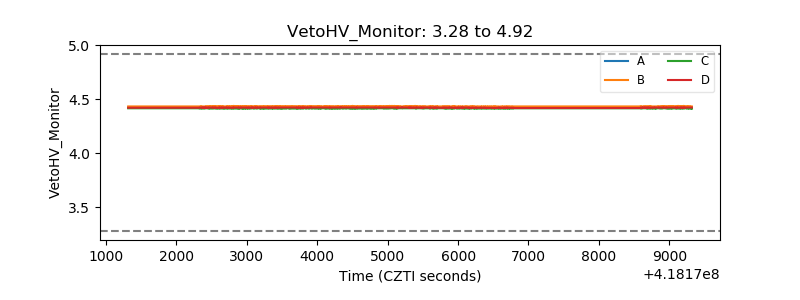 |
| Veto LLD | 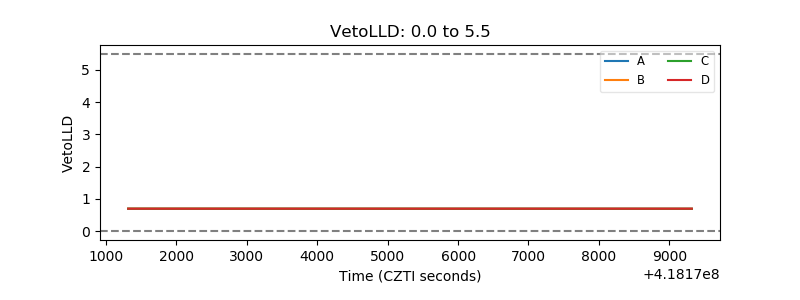 |
| Alpha Counter | 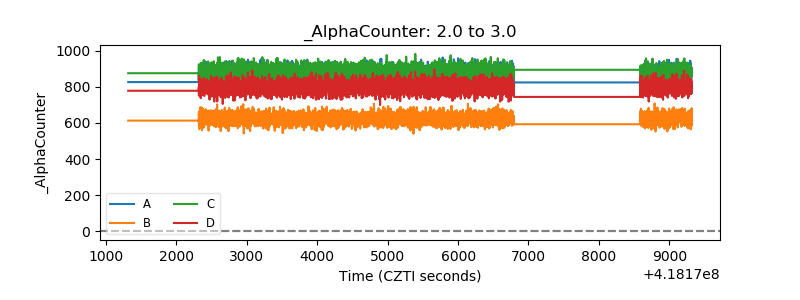 |
| _CPM_Rate | 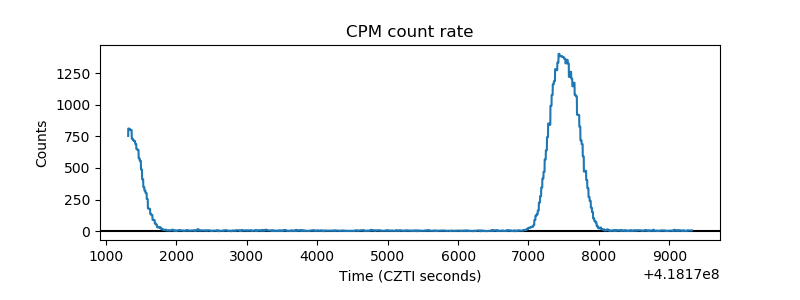 |
| CZT Counter | 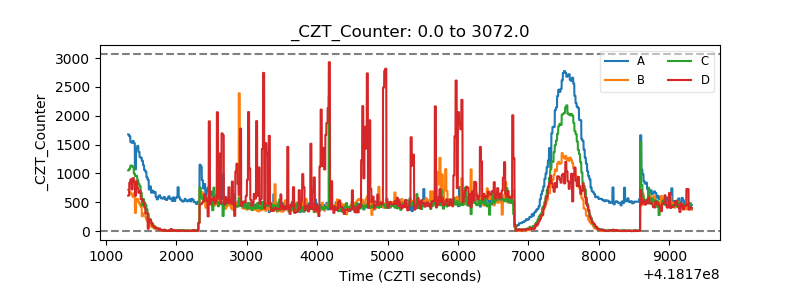 |
| +2.5 Volts monitor | 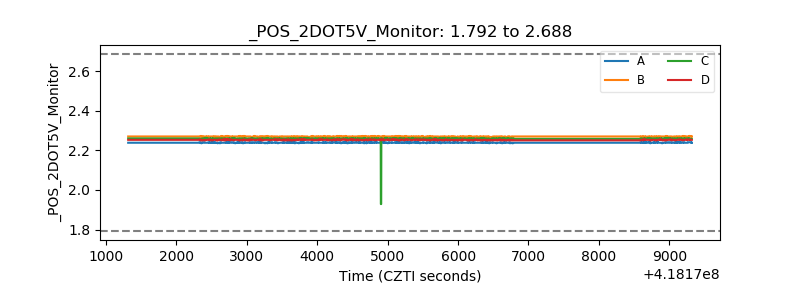 |
| +5 Volts monitor | 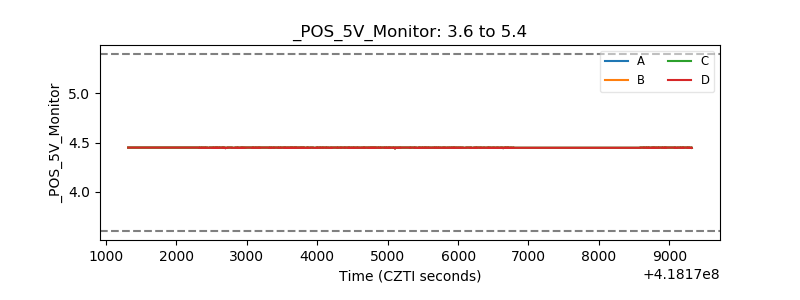 |
| _ROLL_ROT | 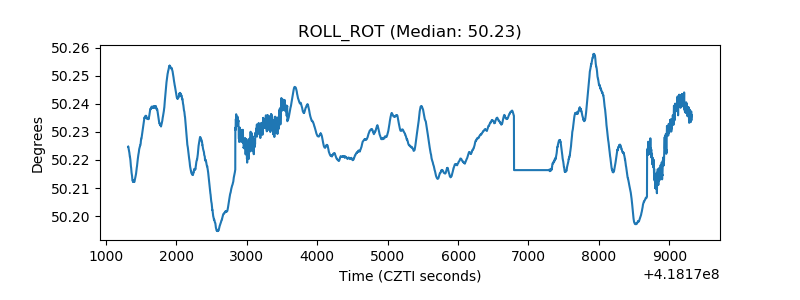 |
| _Roll_DEC | 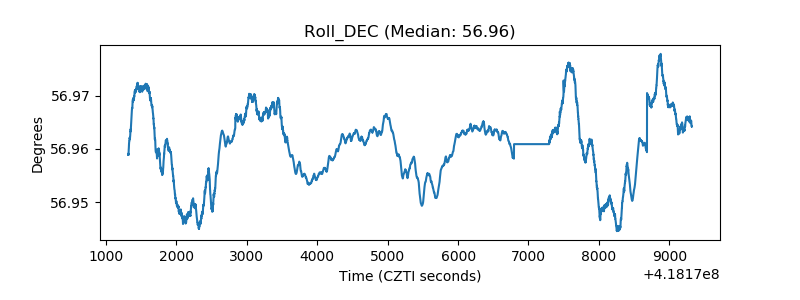 |
| _Roll_RA | 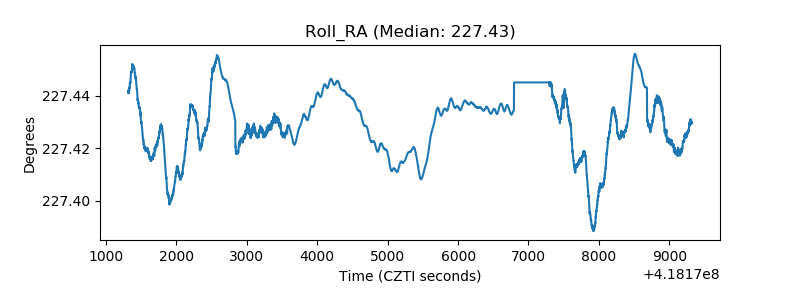 |
| Veto Counter | 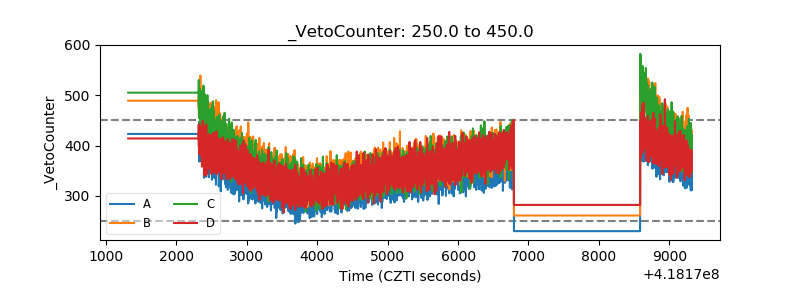 |