| Param | Original file | Final file |
|---|---|---|
| Filename | modeM0/AS1A12_011T59_9000005552_40618cztM0_level2.fits | modeM0/AS1A12_011T59_9000005552_40618cztM0_level2_quad_clean.evt |
| Size (bytes) | 316,025,280 | 91,869,120 |
| Size | 301.4 MB | 87.6 MB |
| Events in quadrant A | 2,860,806 | 624,317 |
| Events in quadrant B | 2,711,455 | 648,137 |
| Events in quadrant C | 2,653,716 | 621,484 |
| Events in quadrant D | 3,045,775 | 505,256 |
| Mode M0 | |||
|---|---|---|---|
| Quadrant | BADHDUFLAG | Total packets | Discarded packets |
| A | 0 | 11830 | 3 |
| B | 0 | 11747 | 2 |
| C | 0 | 11398 | 2 |
| D | 0 | 12884 | 2 |
| Mode M9 | |||
|---|---|---|---|
| Quadrant | BADHDUFLAG | Total packets | Discarded packets |
| A | 0 | 31 | 0 |
| B | 0 | 31 | 0 |
| C | 0 | 31 | 0 |
| D | 0 | 32 | 0 |
| Mode SS | |||
|---|---|---|---|
| Quadrant | BADHDUFLAG | Total packets | Discarded packets |
| A | 0 | 112 | 0 |
| B | 0 | 112 | 0 |
| C | 0 | 112 | 0 |
| D | 0 | 112 | 0 |
| Quadrant | Total seconds | Saturated seconds | Saturation percentage |
|---|---|---|---|
| A | 5463 | 11 | 0.201355% |
| B | 5463 | 32 | 0.585759% |
| C | 5463 | 18 | 0.329489% |
| D | 5463 | 664 | 12.154494% |
Noise dominated data is calculated using 1-second bins in cleaned event files. If a bin has >2000 counts, and if more than 50% of those come from <1% of pixels, then it is considered to be noise-dominated and hence unusable.
| Quadrant | # 1 sec bins | Bins with >0 counts | Bins with >2000 counts | High rate bins dominated by noise | Noise dominated (total time) | Noise dominated (detector-on time) | Marked lightcurve |
|---|---|---|---|---|---|---|---|
| A | 7375 | 5464 | 4 | 4 | 0.05% | 0.07% | 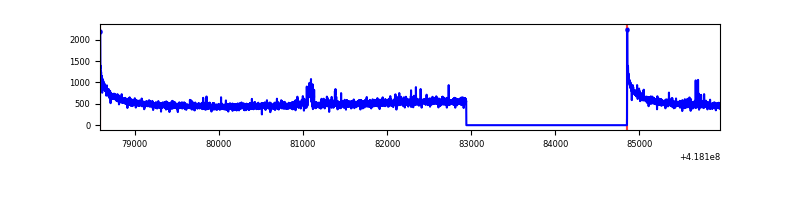 |
| B | 7375 | 5464 | 18 | 18 | 0.24% | 0.33% | 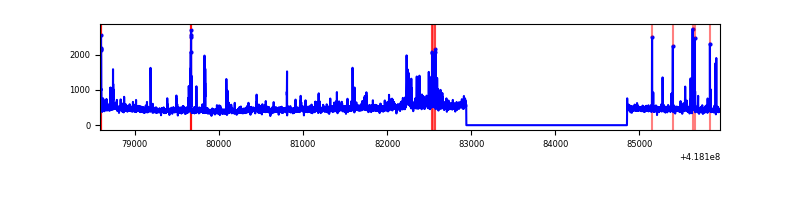 |
| C | 7375 | 5464 | 14 | 14 | 0.19% | 0.26% | 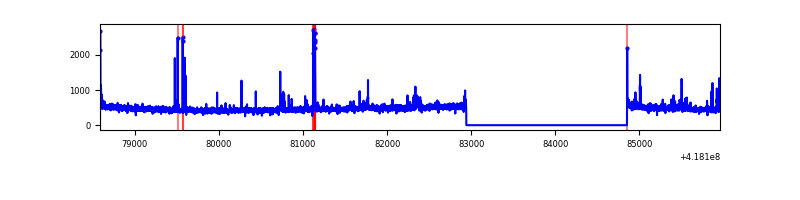 |
| D | 7375 | 5464 | 139 | 139 | 1.88% | 2.54% | 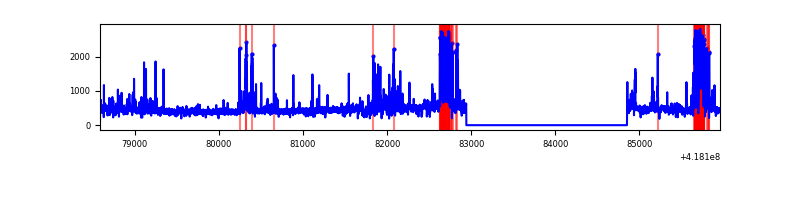 |
Top three noisy pixels from each quadrant. If the there are fewer than three noisy pixels in the level2.evt file, extra rows are filled as -1
| Pixel properties | Quadrant properties | ||||||
|---|---|---|---|---|---|---|---|
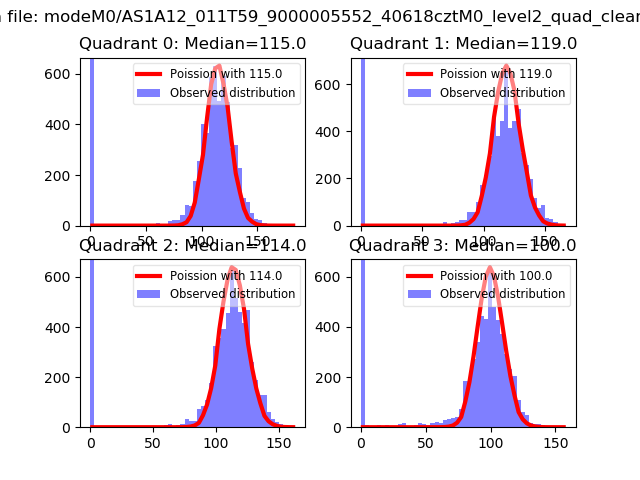
| Quadrant | DetID | PixID | Counts | Sigma | Mean | Median | Sigma |
| A | 10 | 83 | 500816 | 4132.84 | 592 | 581 | 121.0 |
| A | 12 | 189 | 45629 | 372.18 | 592 | 581 | 121.0 |
| A | 2 | 79 | 13799 | 109.2 | 592 | 581 | 121.0 |
| B | 0 | 229 | 160398 | 1425.73 | 591 | 577 | 112.1 |
| B | 3 | 112 | 81939 | 725.82 | 591 | 577 | 112.1 |
| B | 5 | 255 | 79447 | 703.59 | 591 | 577 | 112.1 |
| C | 15 | 214 | 239768 | 1807.76 | 577 | 581 | 132.3 |
| C | 14 | 254 | 73869 | 553.91 | 577 | 581 | 132.3 |
| C | 9 | 187 | 34795 | 258.59 | 577 | 581 | 132.3 |
| D | 9 | 19 | 222465 | 1701.41 | 531 | 515 | 130.5 |
| D | 12 | 191 | 203018 | 1552.34 | 531 | 515 | 130.5 |
| D | 12 | 128 | 196782 | 1504.53 | 531 | 515 | 130.5 |
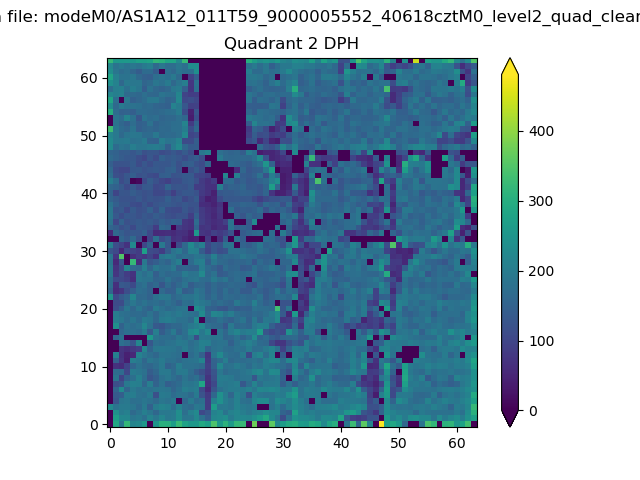
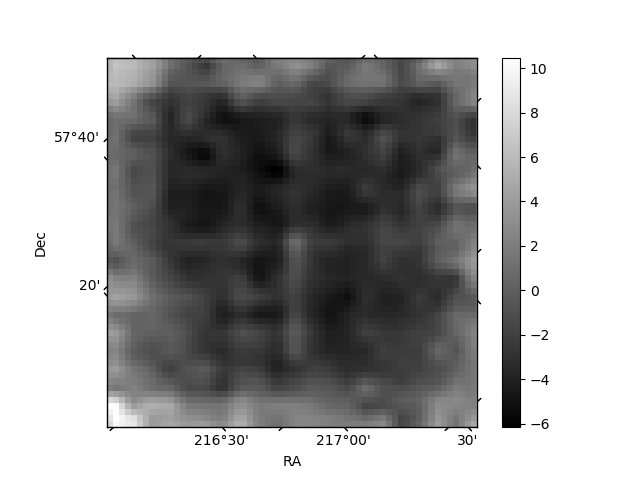
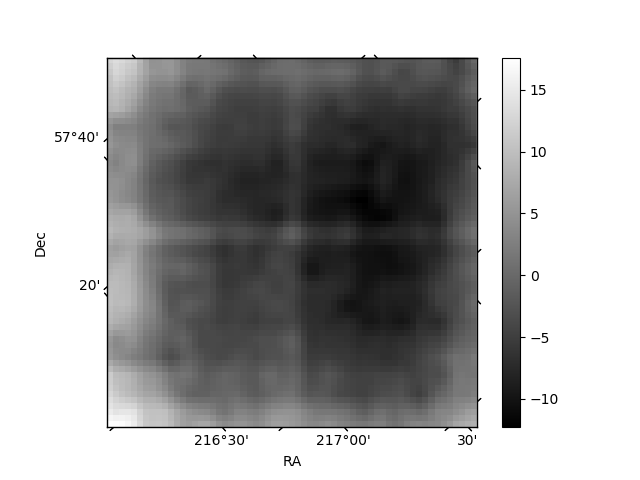
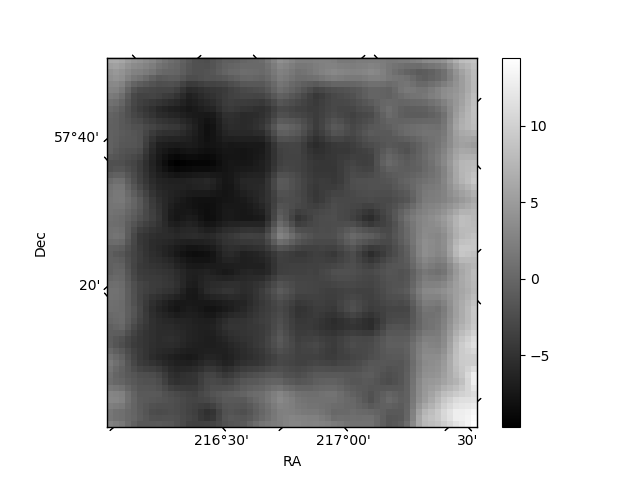
Histogram calculated using DETX and DETY for each event in the final _common_clean file
| Quadrant A | 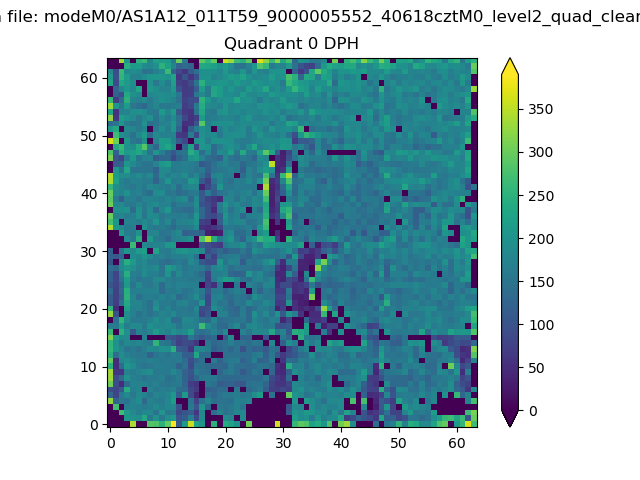 |
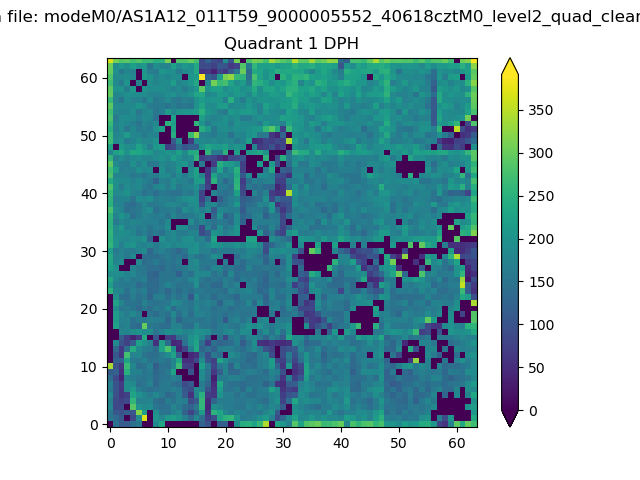 |
Quadrant B |
|---|---|---|---|
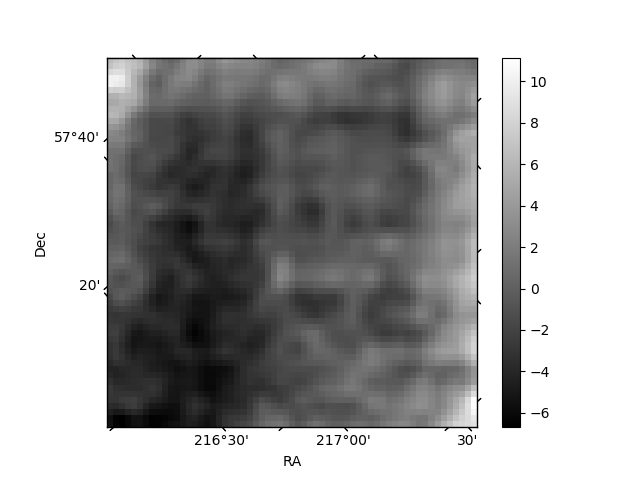
| Quadrant D | 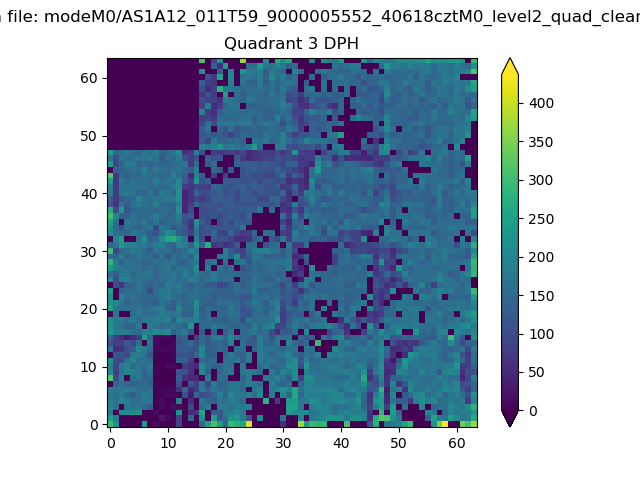 |
 |
Quadrant C |
| Plot type | Count rate plots | Images |
|---|---|---|
| Comparison with Poisson distribution Blue bars denote a histogram of data divided into 1 sec bins. Red curve is a Poisson curve with rate = median count rate of data. |
 |
 |
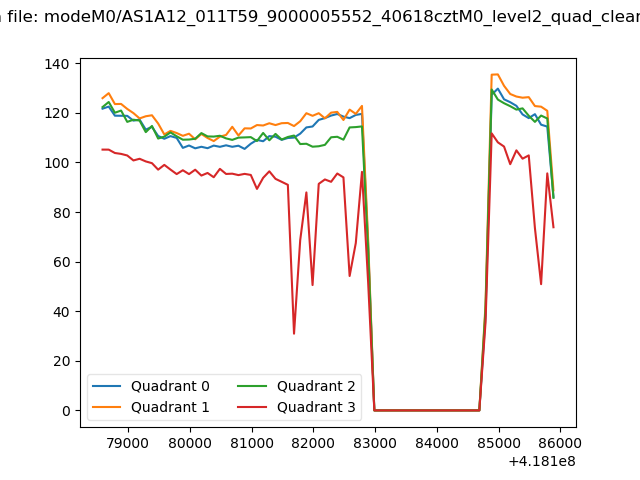
| Quadrant-wise count rates Data is divided into 100 sec bins |
 |
|
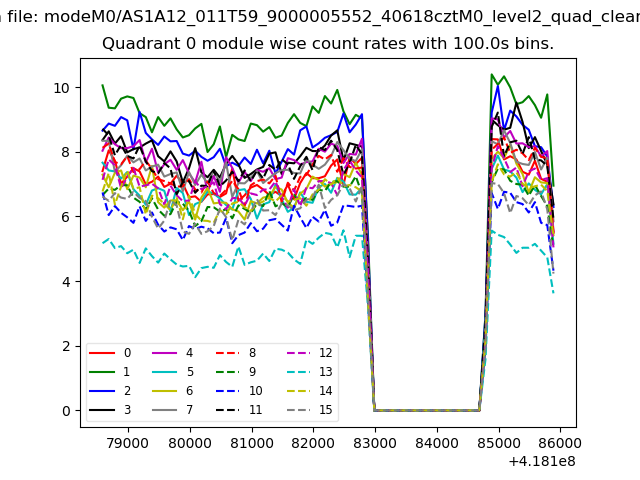
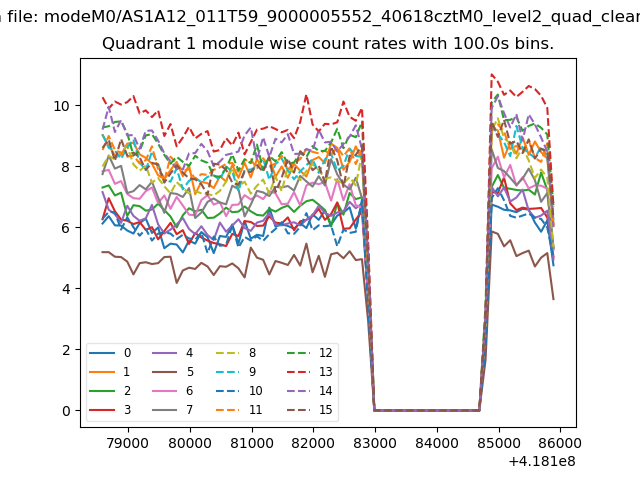
| Module-wise count rates for Quadrant A Data is divided into 100 sec bins |
 |
 |
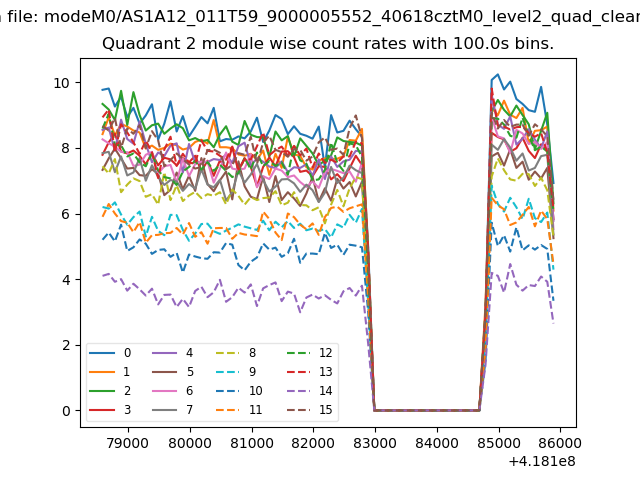
| Module-wise count rates for Quadrant B Data is divided into 100 sec bins |
 |
 |
| Module-wise count rates for Quadrant C Data is divided into 100 sec bins |
 |
 |
| Module-wise count rates for Quadrant D Data is divided into 100 sec bins |
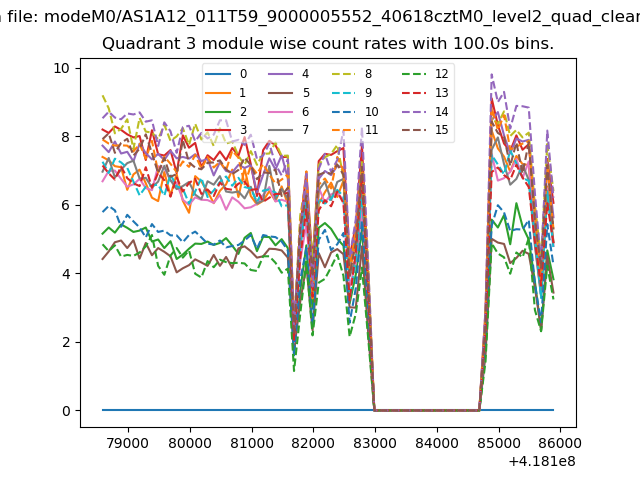 |
 |
| Parameter | Plot |
|---|---|
| CZT HV Monitor | 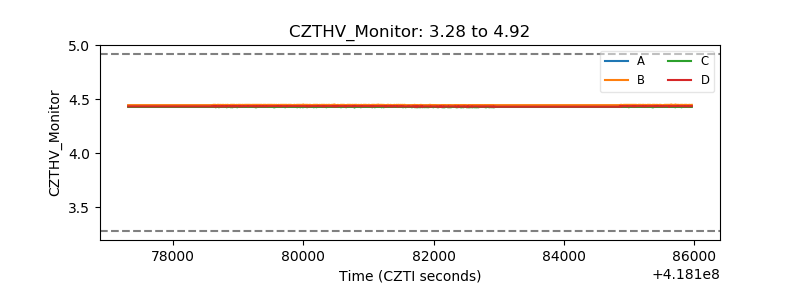 |
| D_VDD | 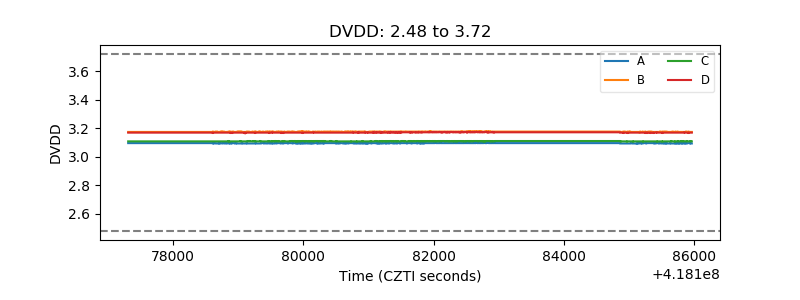 |
| Temperature 1 | 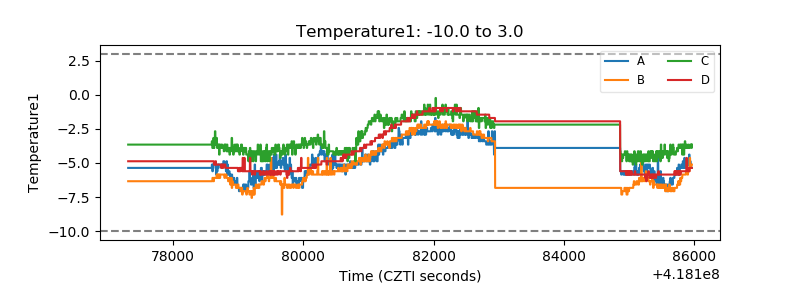 |
| Veto HV Monitor | 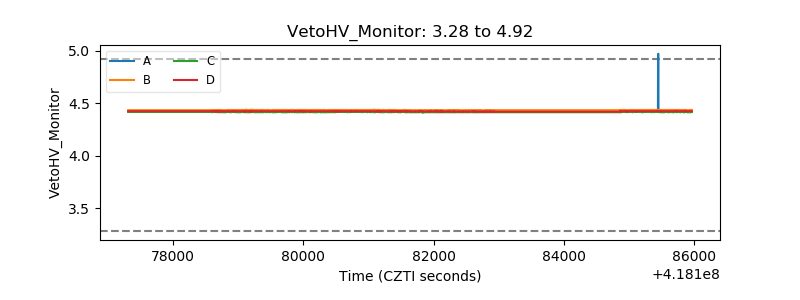 |
| Veto LLD | 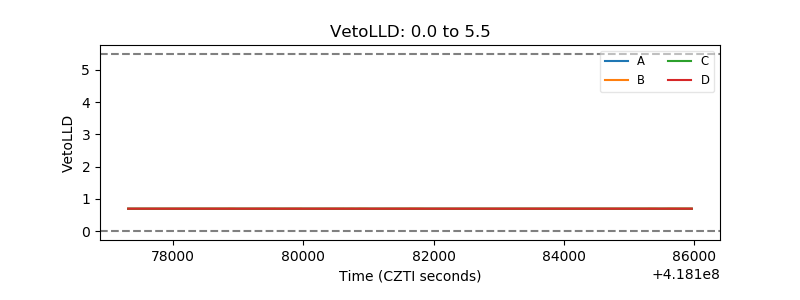 |
| Alpha Counter | 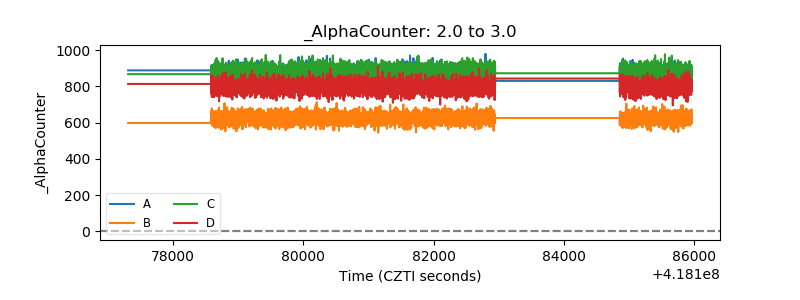 |
| _CPM_Rate | 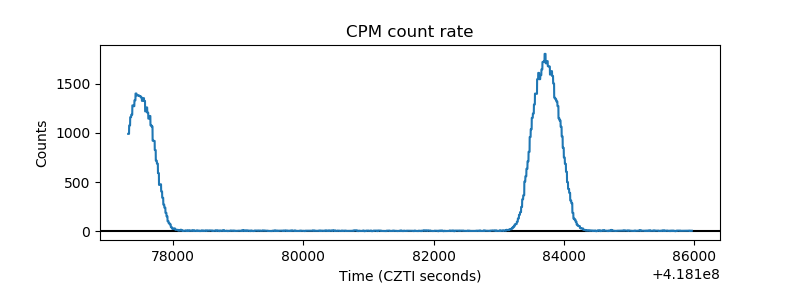 |
| CZT Counter | 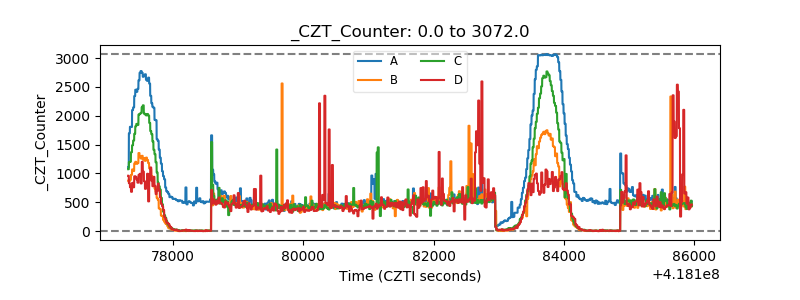 |
| +2.5 Volts monitor | 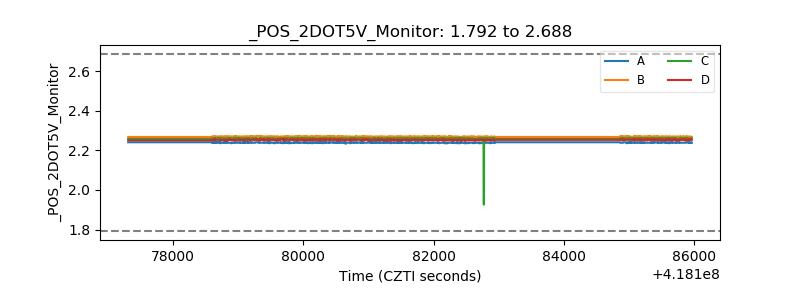 |
| +5 Volts monitor | 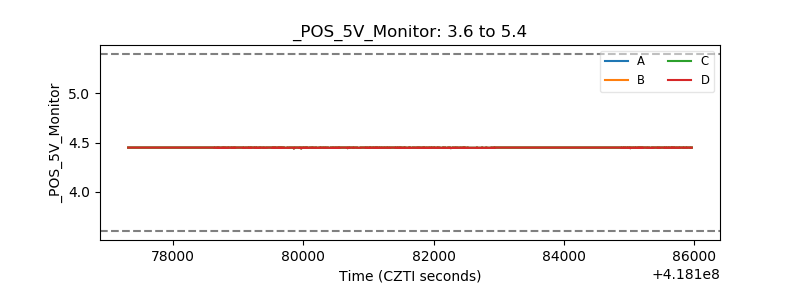 |
| _ROLL_ROT | 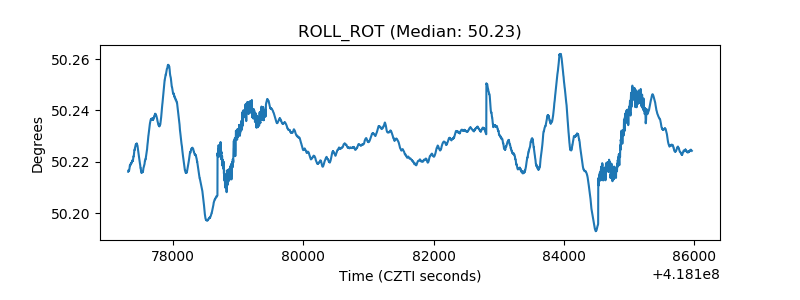 |
| _Roll_DEC | 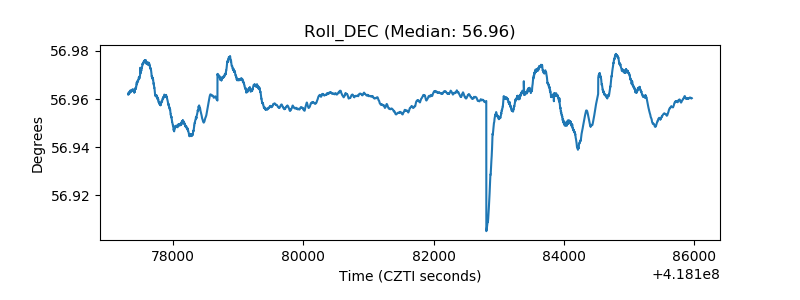 |
| _Roll_RA |  |
| Veto Counter | 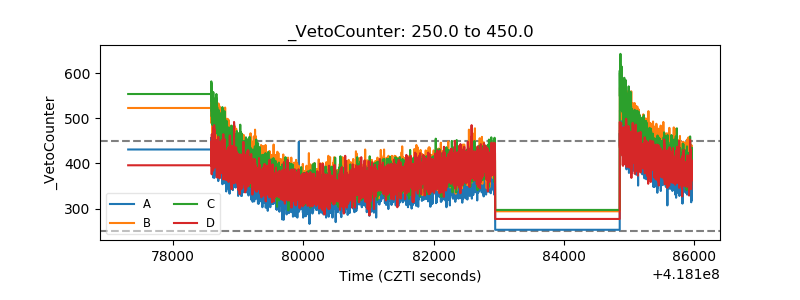 |