| Param | Original file | Final file |
|---|---|---|
| Filename | modeM0/AS1A12_011T59_9000005552_40619cztM0_level2.fits | modeM0/AS1A12_011T59_9000005552_40619cztM0_level2_quad_clean.evt |
| Size (bytes) | 322,508,160 | 87,471,360 |
| Size | 307.6 MB | 83.4 MB |
| Events in quadrant A | 2,790,657 | 615,939 |
| Events in quadrant B | 2,831,180 | 635,382 |
| Events in quadrant C | 2,491,235 | 605,723 |
| Events in quadrant D | 3,417,559 | 426,436 |
| Mode M0 | |||
|---|---|---|---|
| Quadrant | BADHDUFLAG | Total packets | Discarded packets |
| A | 0 | 11343 | 3 |
| B | 0 | 11851 | 2 |
| C | 0 | 10634 | 2 |
| D | 0 | 13802 | 2 |
| Mode M9 | |||
|---|---|---|---|
| Quadrant | BADHDUFLAG | Total packets | Discarded packets |
| A | 0 | 21 | 0 |
| B | 0 | 21 | 0 |
| C | 0 | 21 | 0 |
| D | 0 | 21 | 0 |
| Mode SS | |||
|---|---|---|---|
| Quadrant | BADHDUFLAG | Total packets | Discarded packets |
| A | 0 | 106 | 0 |
| B | 0 | 106 | 0 |
| C | 0 | 106 | 0 |
| D | 0 | 106 | 0 |
| Quadrant | Total seconds | Saturated seconds | Saturation percentage |
|---|---|---|---|
| A | 5213 | 7 | 0.134280% |
| B | 5213 | 58 | 1.112603% |
| C | 5213 | 5 | 0.095914% |
| D | 5213 | 1332 | 25.551506% |
Noise dominated data is calculated using 1-second bins in cleaned event files. If a bin has >2000 counts, and if more than 50% of those come from <1% of pixels, then it is considered to be noise-dominated and hence unusable.
| Quadrant | # 1 sec bins | Bins with >0 counts | Bins with >2000 counts | High rate bins dominated by noise | Noise dominated (total time) | Noise dominated (detector-on time) | Marked lightcurve |
|---|---|---|---|---|---|---|---|
| A | 7246 | 5214 | 3 | 3 | 0.04% | 0.06% | 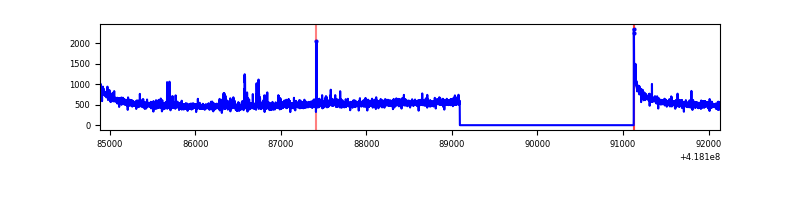 |
| B | 7246 | 5214 | 39 | 39 | 0.54% | 0.75% | 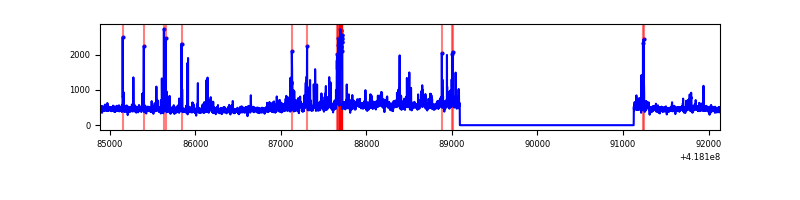 |
| C | 7246 | 5214 | 4 | 4 | 0.06% | 0.08% | 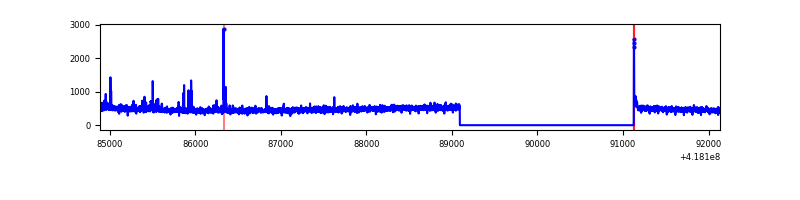 |
| D | 7246 | 5214 | 190 | 190 | 2.62% | 3.64% | 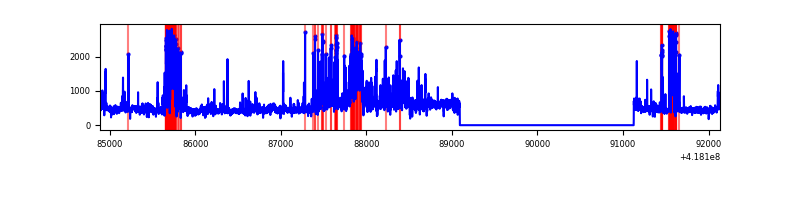 |
Top three noisy pixels from each quadrant. If the there are fewer than three noisy pixels in the level2.evt file, extra rows are filled as -1
| Pixel properties | Quadrant properties | ||||||
|---|---|---|---|---|---|---|---|
| Quadrant | DetID | PixID | Counts | Sigma | Mean | Median | Sigma |
| A | 10 | 83 | 458197 | 3863.08 | 581 | 570 | 118.5 |
| A | 2 | 79 | 43289 | 360.61 | 581 | 570 | 118.5 |
| A | 12 | 189 | 39386 | 327.67 | 581 | 570 | 118.5 |
| B | 5 | 255 | 168552 | 1544.51 | 576 | 561 | 108.8 |
| B | 0 | 229 | 143261 | 1311.98 | 576 | 561 | 108.8 |
| B | 3 | 112 | 114589 | 1048.37 | 576 | 561 | 108.8 |
| C | 15 | 214 | 227606 | 1755.09 | 559 | 561 | 129.4 |
| C | 14 | 254 | 36482 | 277.67 | 559 | 561 | 129.4 |
| C | 9 | 187 | 27630 | 209.25 | 559 | 561 | 129.4 |
| D | 12 | 227 | 414927 | 3430.84 | 493 | 478 | 120.8 |
| D | 2 | 250 | 272487 | 2251.71 | 493 | 478 | 120.8 |
| D | 12 | 191 | 256345 | 2118.08 | 493 | 478 | 120.8 |
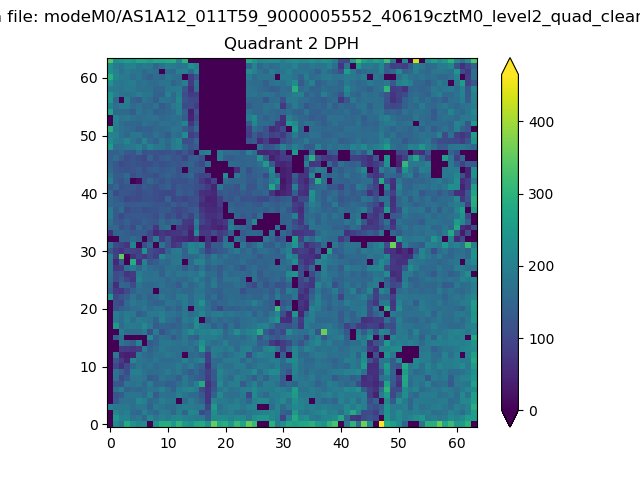
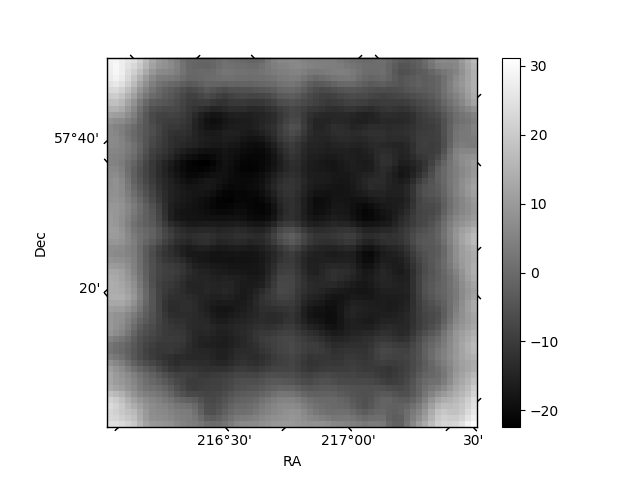
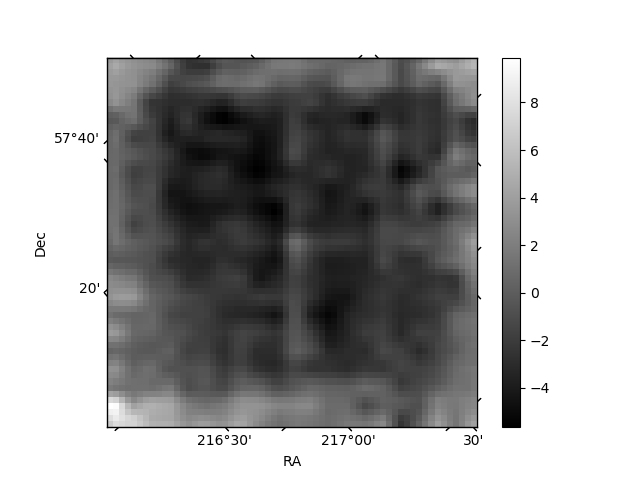
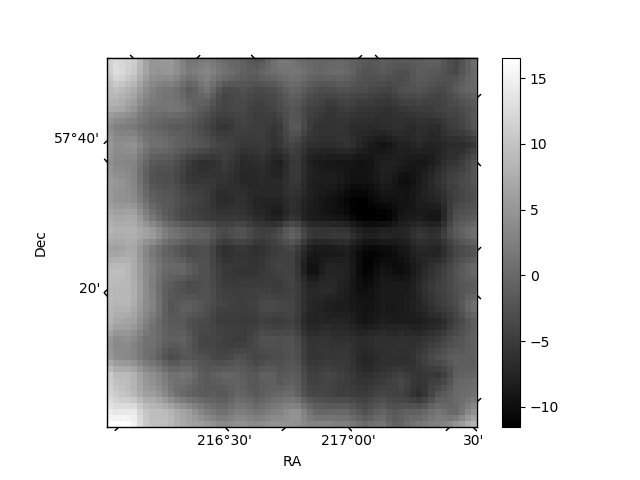
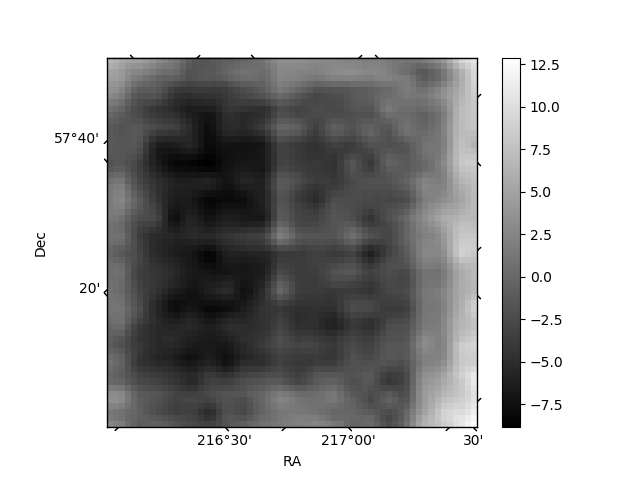
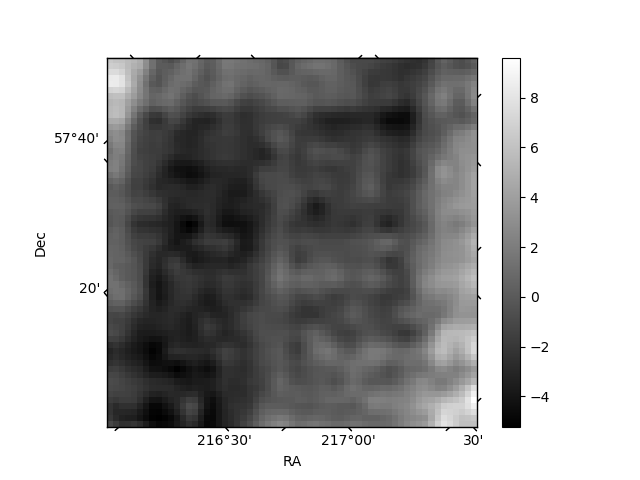
Histogram calculated using DETX and DETY for each event in the final _common_clean file
| Quadrant A | 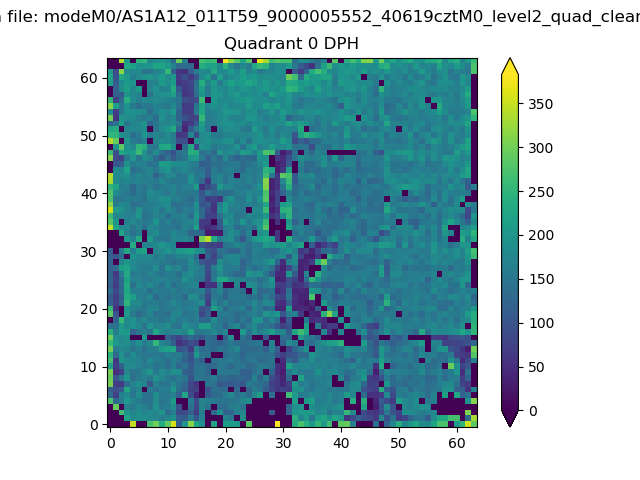 |
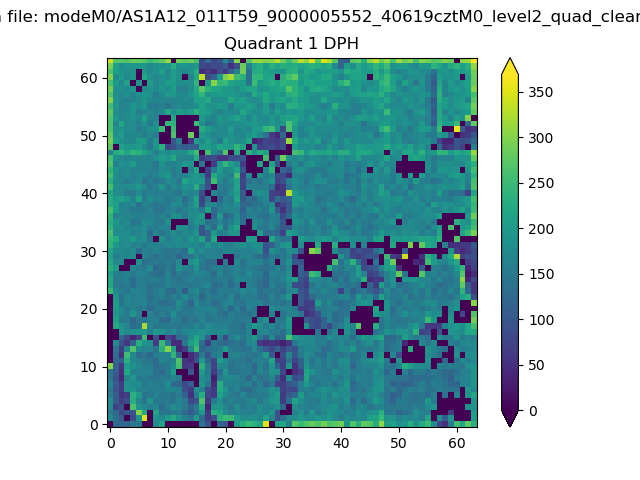 |
Quadrant B |
|---|---|---|---|
| Quadrant D | 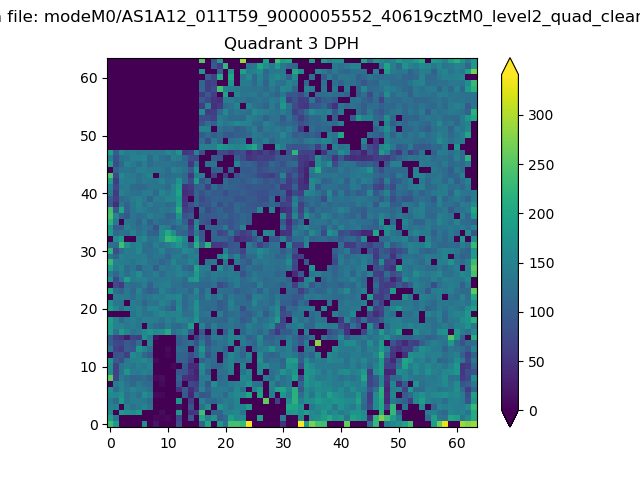 |
 |
Quadrant C |
| Plot type | Count rate plots | Images |
|---|---|---|
| Comparison with Poisson distribution Blue bars denote a histogram of data divided into 1 sec bins. Red curve is a Poisson curve with rate = median count rate of data. |
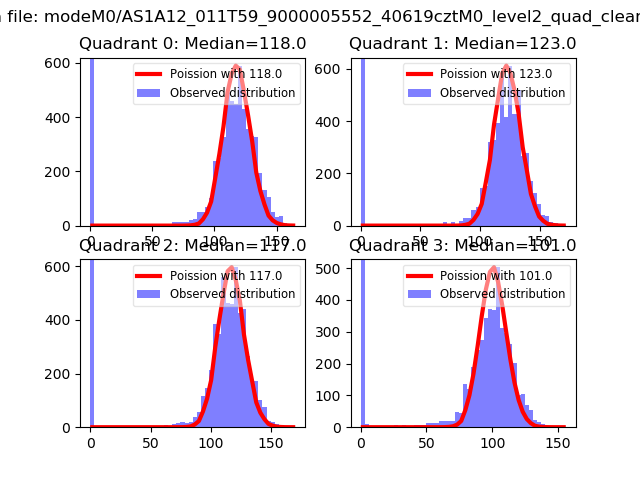 |
 |
| Quadrant-wise count rates Data is divided into 100 sec bins |
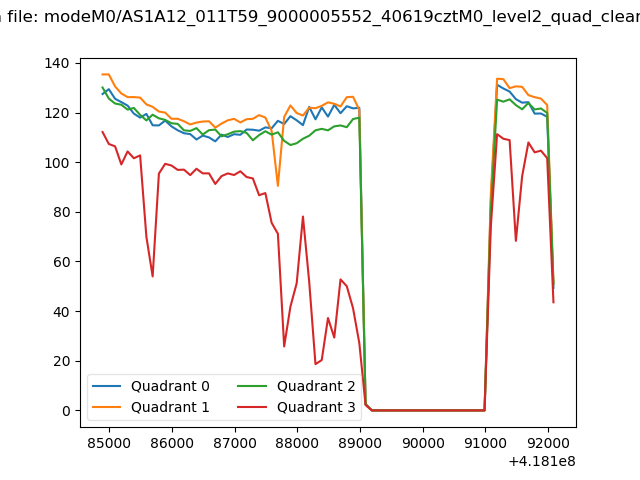 |
|
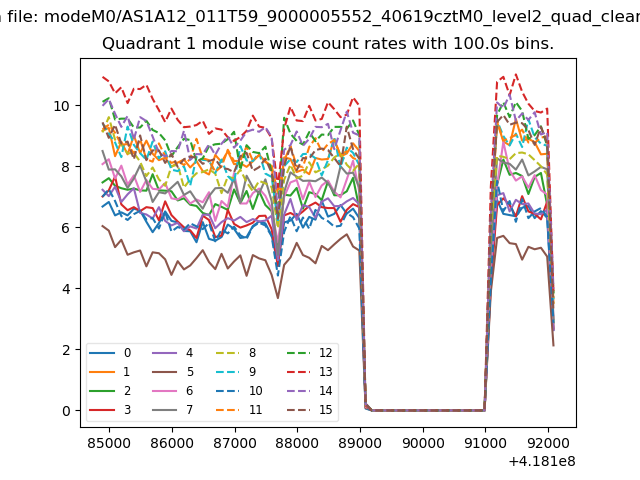
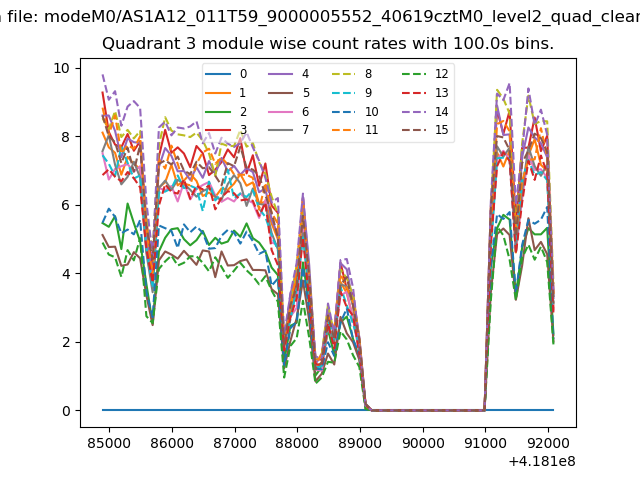
| Module-wise count rates for Quadrant A Data is divided into 100 sec bins |
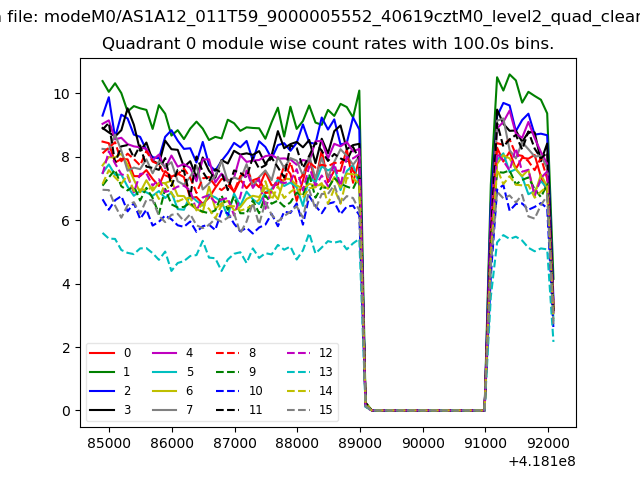 |
 |
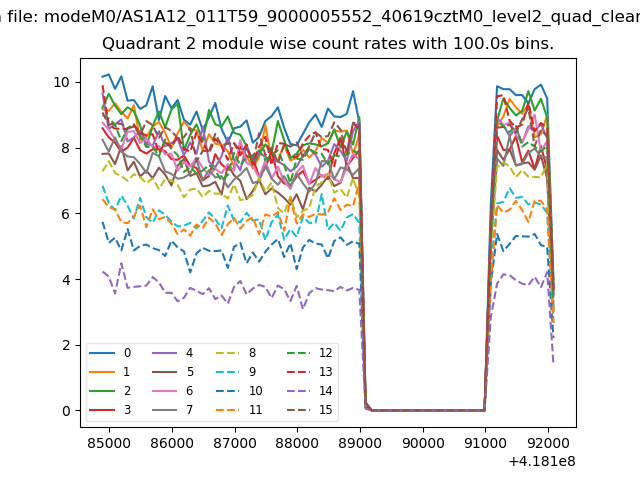
| Module-wise count rates for Quadrant B Data is divided into 100 sec bins |
 |
 |
| Module-wise count rates for Quadrant C Data is divided into 100 sec bins |
 |
 |
| Module-wise count rates for Quadrant D Data is divided into 100 sec bins |
 |
 |
| Parameter | Plot |
|---|---|
| CZT HV Monitor | 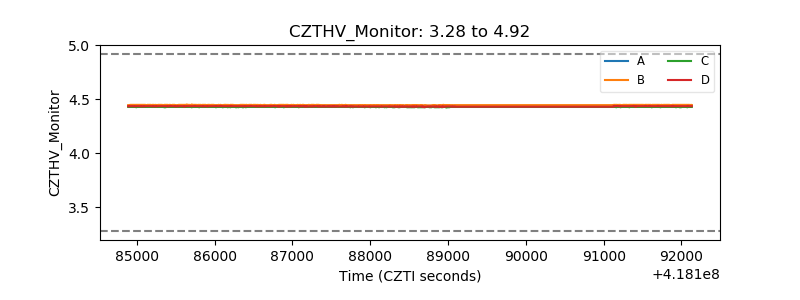 |
| D_VDD | 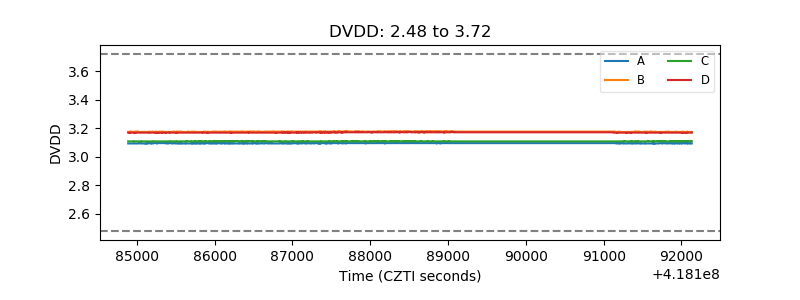 |
| Temperature 1 | 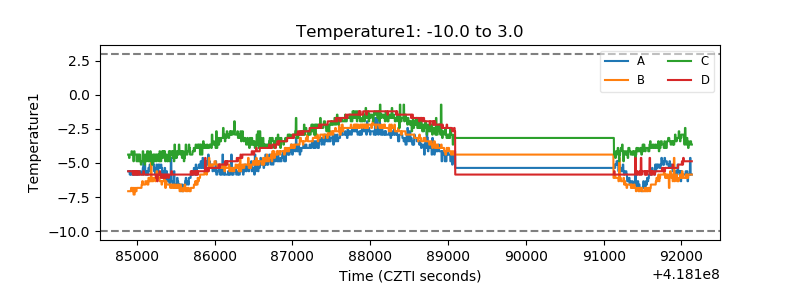 |
| Veto HV Monitor | 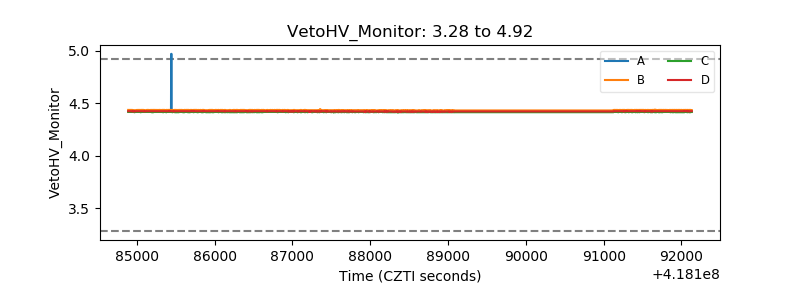 |
| Veto LLD | 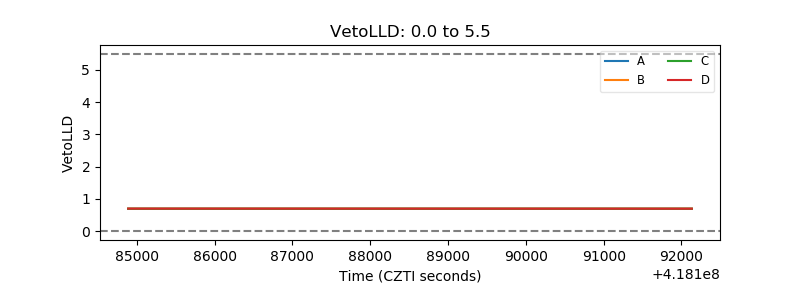 |
| Alpha Counter | 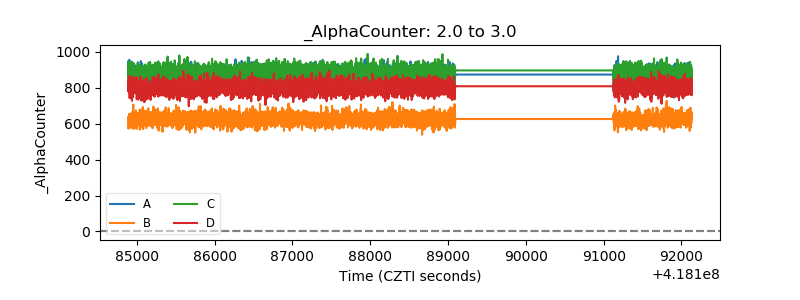 |
| _CPM_Rate | 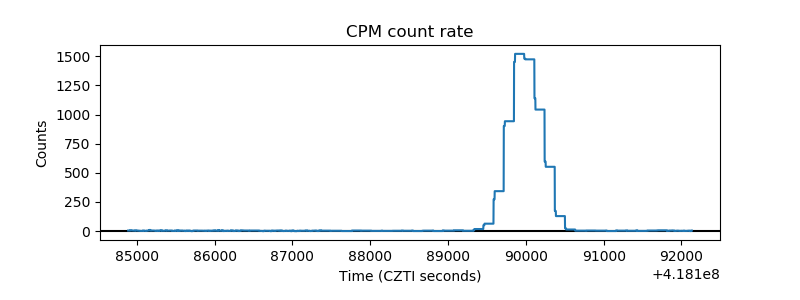 |
| CZT Counter | 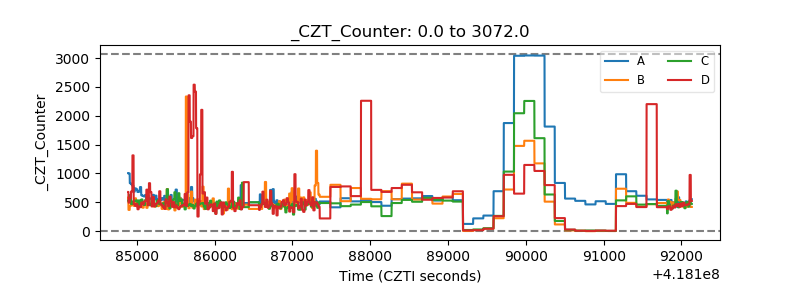 |
| +2.5 Volts monitor | 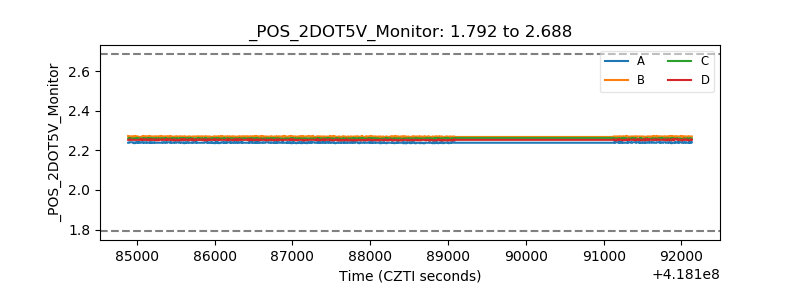 |
| +5 Volts monitor | 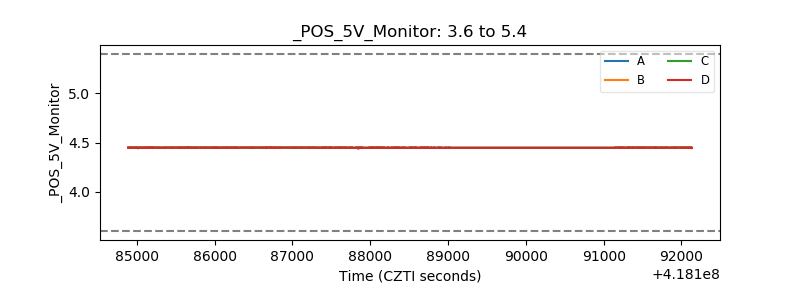 |
| _ROLL_ROT | 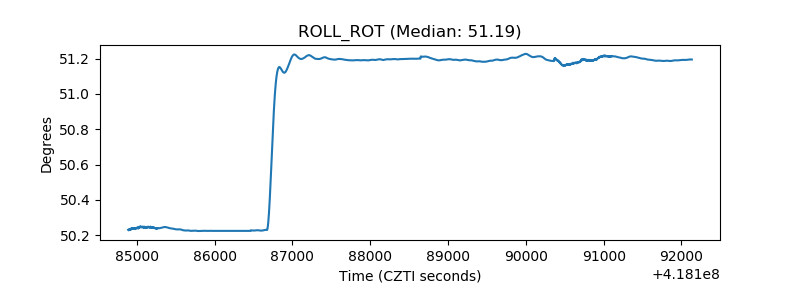 |
| _Roll_DEC | 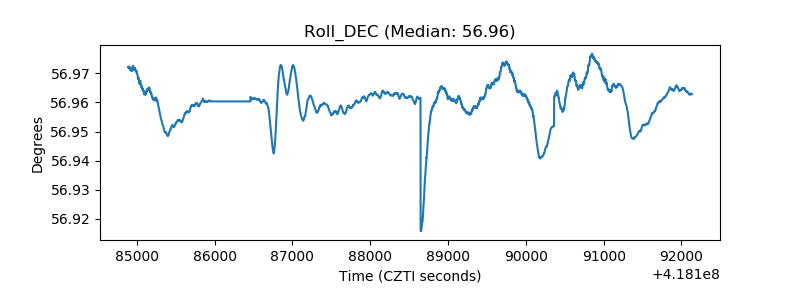 |
| _Roll_RA |  |
| Veto Counter | 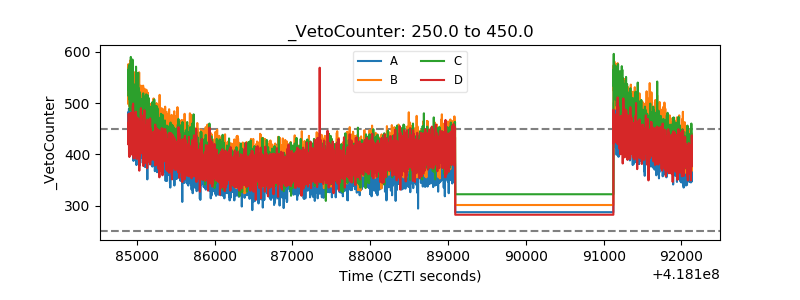 |