| Param | Original file | Final file |
|---|---|---|
| Filename | modeM0/AS1A12_011T59_9000005552_40621cztM0_level2.fits | modeM0/AS1A12_011T59_9000005552_40621cztM0_level2_quad_clean.evt |
| Size (bytes) | 753,929,280 | 203,106,240 |
| Size | 719.0 MB | 193.7 MB |
| Events in quadrant A | 6,574,670 | 1,438,147 |
| Events in quadrant B | 6,718,581 | 1,481,394 |
| Events in quadrant C | 6,006,343 | 1,400,456 |
| Events in quadrant D | 7,641,476 | 970,704 |
| Mode M0 | |||
|---|---|---|---|
| Quadrant | BADHDUFLAG | Total packets | Discarded packets |
| A | 0 | 26569 | 4 |
| B | 0 | 27839 | 3 |
| C | 0 | 25495 | 3 |
| D | 0 | 31226 | 3 |
| Mode M9 | |||
|---|---|---|---|
| Quadrant | BADHDUFLAG | Total packets | Discarded packets |
| A | 0 | 63 | 0 |
| B | 0 | 63 | 0 |
| C | 0 | 63 | 0 |
| D | 0 | 63 | 0 |
| Mode SS | |||
|---|---|---|---|
| Quadrant | BADHDUFLAG | Total packets | Discarded packets |
| A | 0 | 252 | 0 |
| B | 0 | 252 | 0 |
| C | 0 | 252 | 0 |
| D | 0 | 252 | 0 |
| Quadrant | Total seconds | Saturated seconds | Saturation percentage |
|---|---|---|---|
| A | 12430 | 19 | 0.152856% |
| B | 12430 | 111 | 0.893001% |
| C | 12430 | 16 | 0.128721% |
| D | 12430 | 3386 | 27.240547% |
Noise dominated data is calculated using 1-second bins in cleaned event files. If a bin has >2000 counts, and if more than 50% of those come from <1% of pixels, then it is considered to be noise-dominated and hence unusable.
| Quadrant | # 1 sec bins | Bins with >0 counts | Bins with >2000 counts | High rate bins dominated by noise | Noise dominated (total time) | Noise dominated (detector-on time) | Marked lightcurve |
|---|---|---|---|---|---|---|---|
| A | 18708 | 12433 | 10 | 10 | 0.05% | 0.08% | 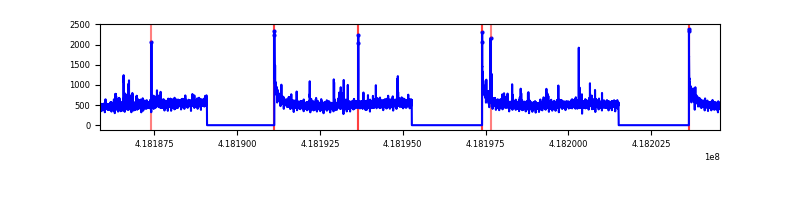 |
| B | 18708 | 12433 | 60 | 60 | 0.32% | 0.48% | 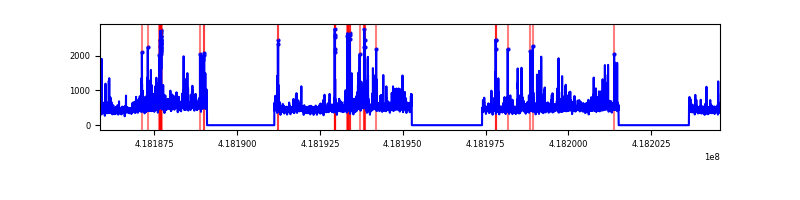 |
| C | 18708 | 12433 | 13 | 13 | 0.07% | 0.10% | 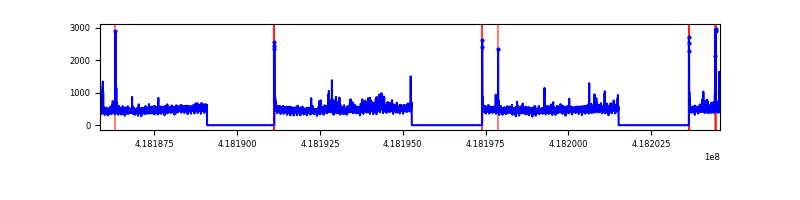 |
| D | 18708 | 12432 | 195 | 195 | 1.04% | 1.57% | 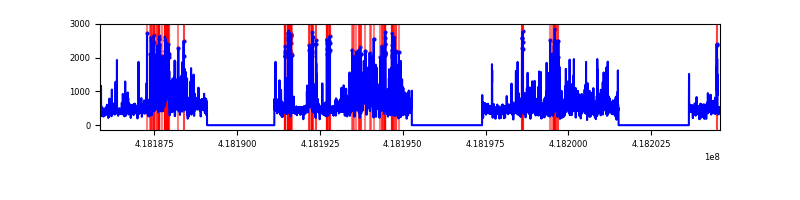 |
Top three noisy pixels from each quadrant. If the there are fewer than three noisy pixels in the level2.evt file, extra rows are filled as -1
| Pixel properties | Quadrant properties | ||||||
|---|---|---|---|---|---|---|---|
| Quadrant | DetID | PixID | Counts | Sigma | Mean | Median | Sigma |
| A | 10 | 83 | 989588 | 3527.56 | 1397 | 1374 | 280.1 |
| A | 2 | 79 | 93692 | 329.54 | 1397 | 1374 | 280.1 |
| A | 12 | 189 | 70580 | 247.04 | 1397 | 1374 | 280.1 |
| B | 0 | 229 | 375793 | 1453.85 | 1378 | 1341 | 257.6 |
| B | 3 | 112 | 277625 | 1072.7 | 1378 | 1341 | 257.6 |
| B | 0 | 190 | 249005 | 961.58 | 1378 | 1341 | 257.6 |
| C | 15 | 214 | 530764 | 1718.69 | 1341 | 1345 | 308.0 |
| C | 9 | 187 | 148026 | 476.18 | 1341 | 1345 | 308.0 |
| C | 0 | 10 | 48528 | 153.17 | 1341 | 1345 | 308.0 |
| D | 12 | 227 | 1267444 | 4426.06 | 1181 | 1145 | 286.1 |
| D | 12 | 191 | 687640 | 2399.49 | 1181 | 1145 | 286.1 |
| D | 12 | 79 | 482929 | 1683.97 | 1181 | 1145 | 286.1 |
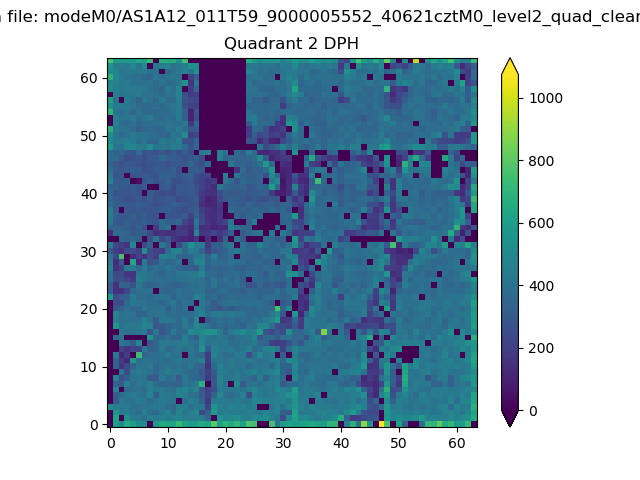
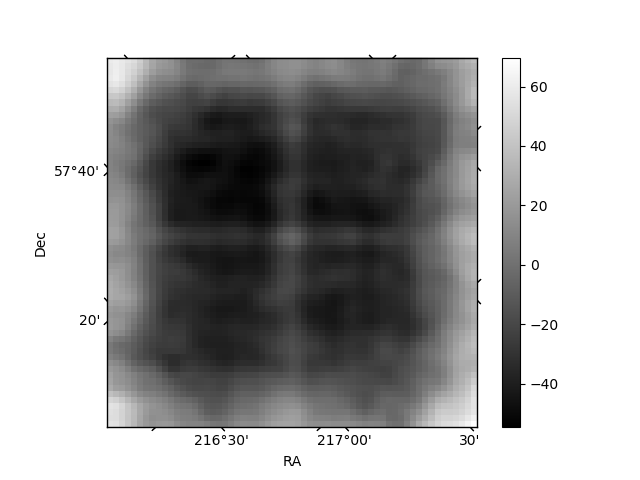
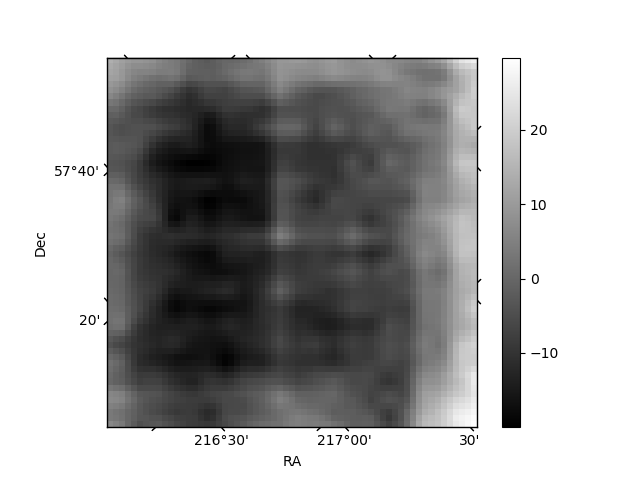
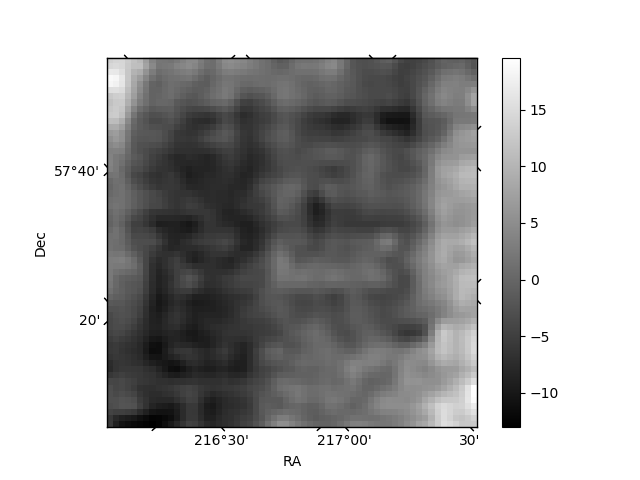
Histogram calculated using DETX and DETY for each event in the final _common_clean file
| Quadrant A | 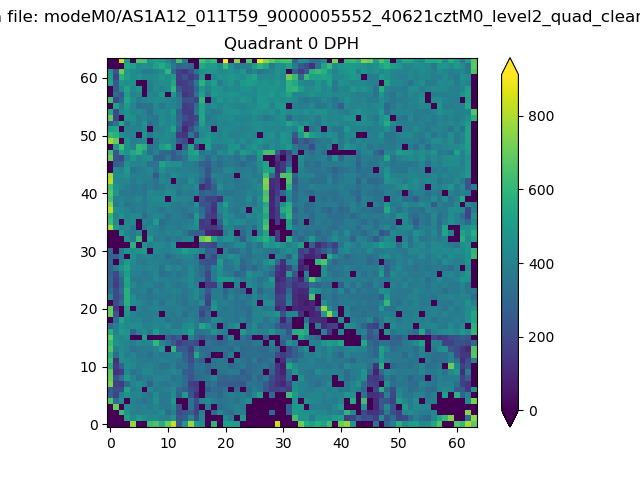 |
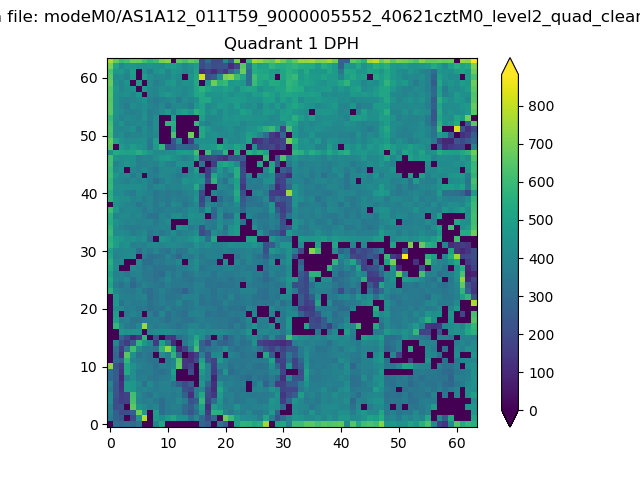 |
Quadrant B |
|---|---|---|---|
| Quadrant D | 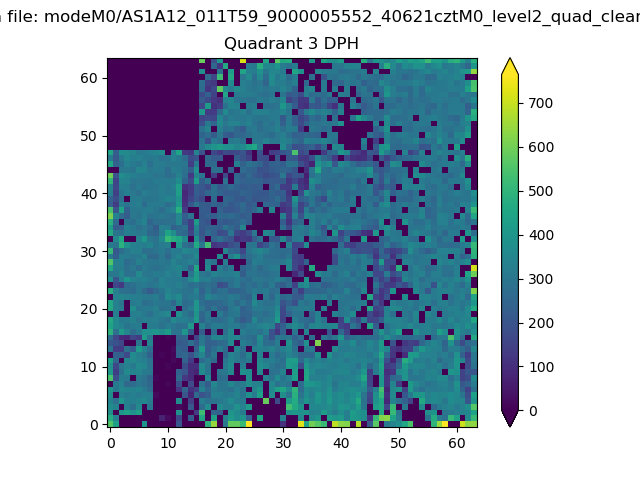 |
 |
Quadrant C |
| Plot type | Count rate plots | Images |
|---|---|---|
| Comparison with Poisson distribution Blue bars denote a histogram of data divided into 1 sec bins. Red curve is a Poisson curve with rate = median count rate of data. |
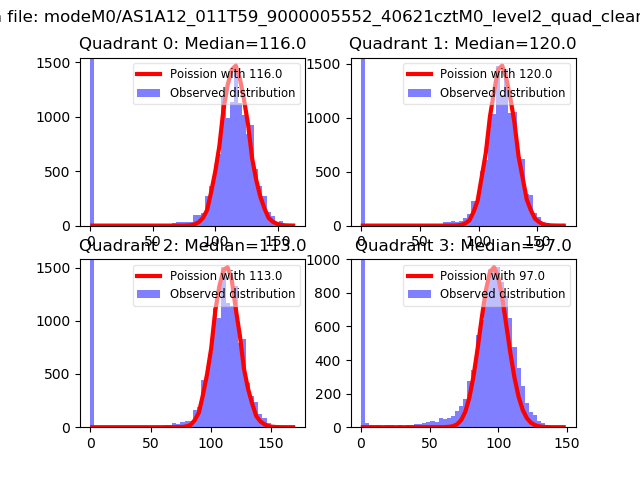 |
 |
| Quadrant-wise count rates Data is divided into 100 sec bins |
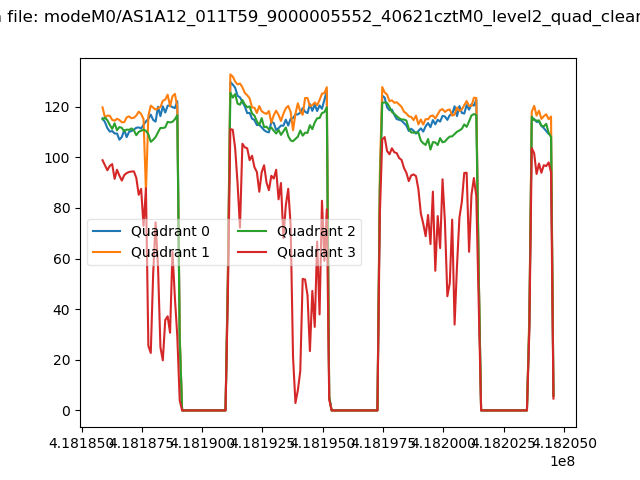 |
|
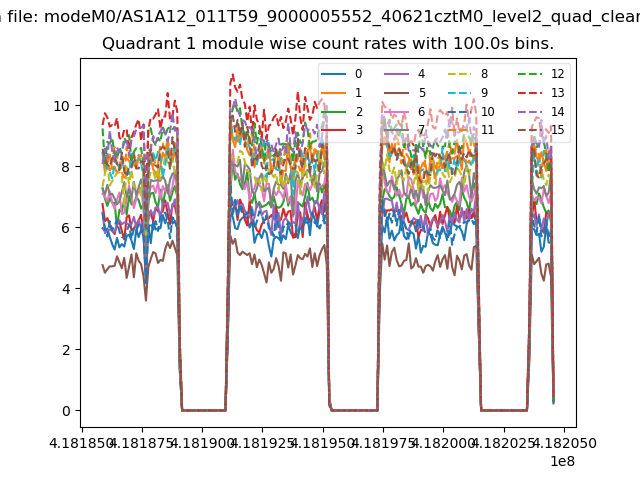
| Module-wise count rates for Quadrant A Data is divided into 100 sec bins |
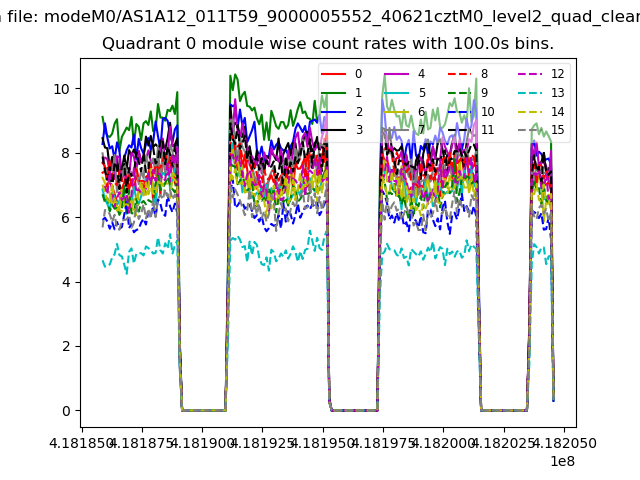 |
 |
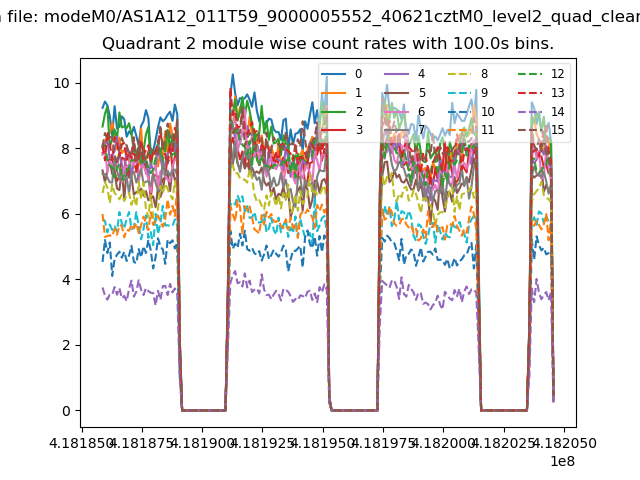
| Module-wise count rates for Quadrant B Data is divided into 100 sec bins |
 |
 |
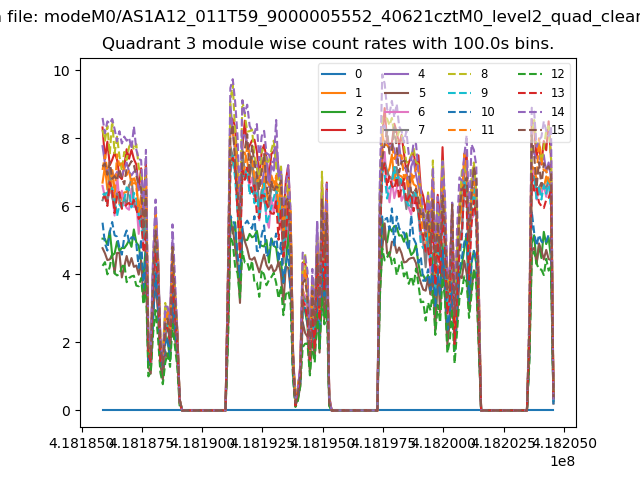
| Module-wise count rates for Quadrant C Data is divided into 100 sec bins |
 |
 |
| Module-wise count rates for Quadrant D Data is divided into 100 sec bins |
 |
 |
| Parameter | Plot |
|---|---|
| CZT HV Monitor | 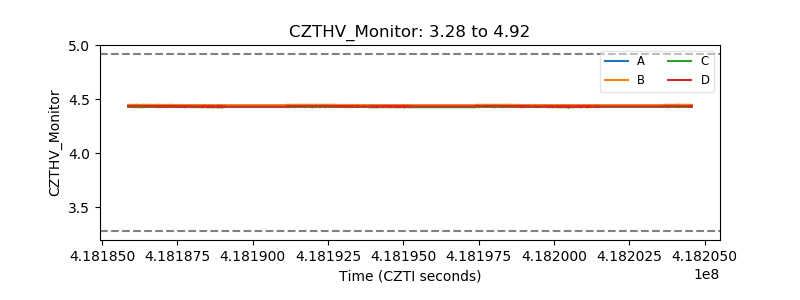 |
| D_VDD | 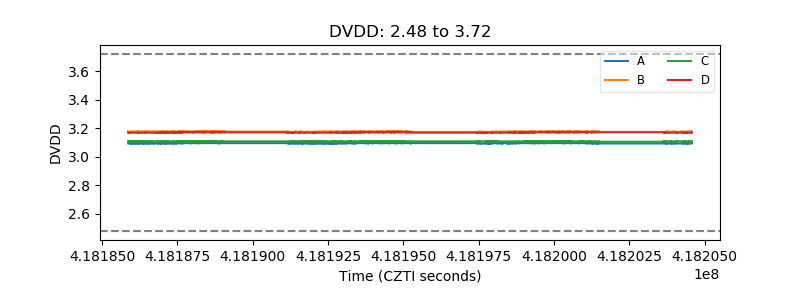 |
| Temperature 1 | 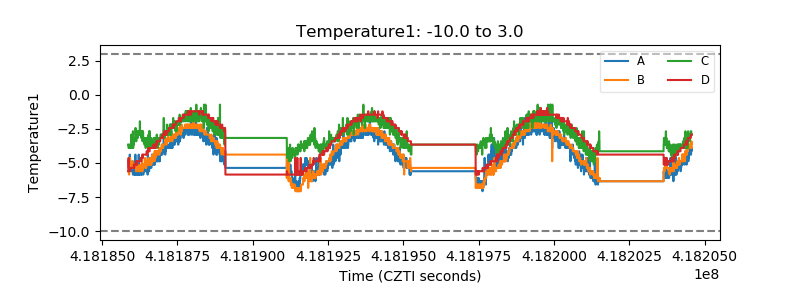 |
| Veto HV Monitor | 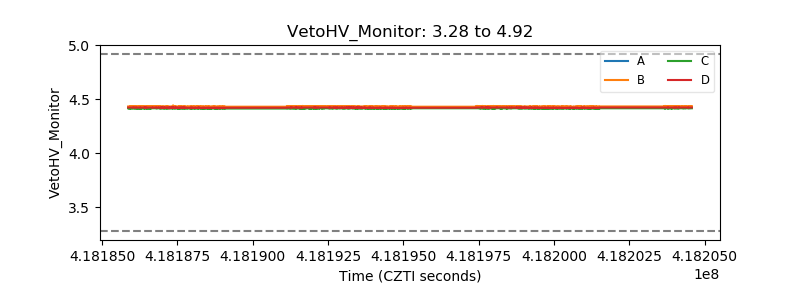 |
| Veto LLD | 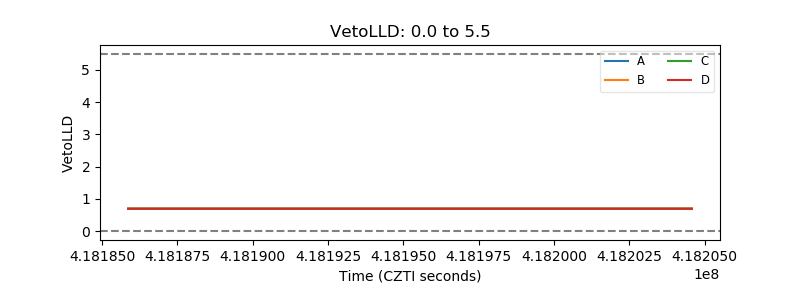 |
| Alpha Counter | 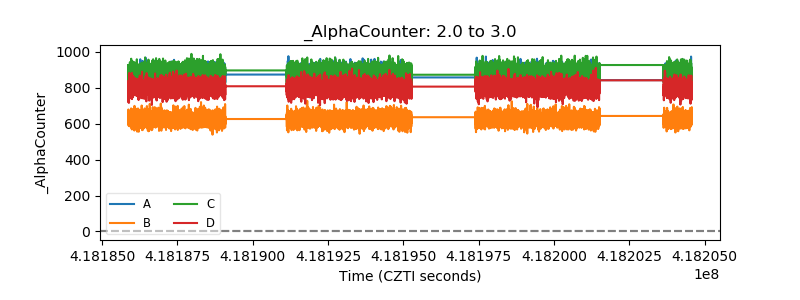 |
| _CPM_Rate | 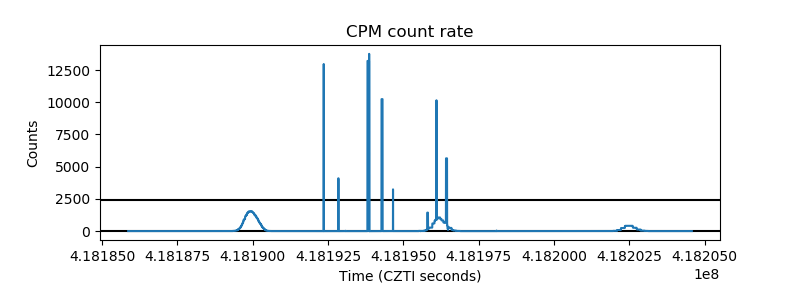 |
| CZT Counter | 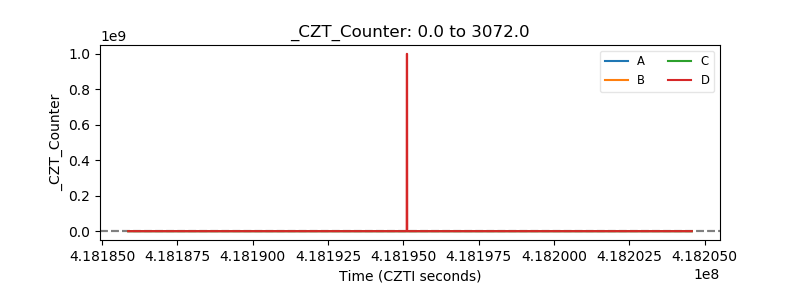 |
| +2.5 Volts monitor | 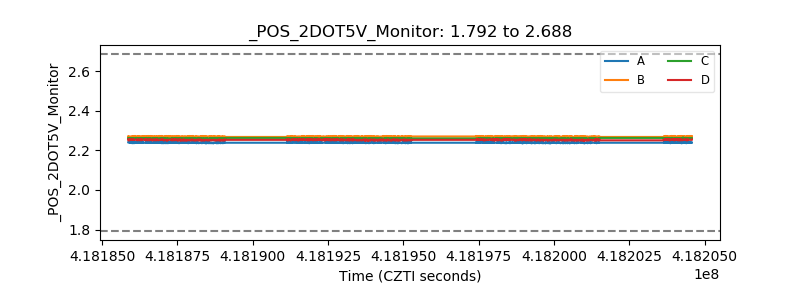 |
| +5 Volts monitor | 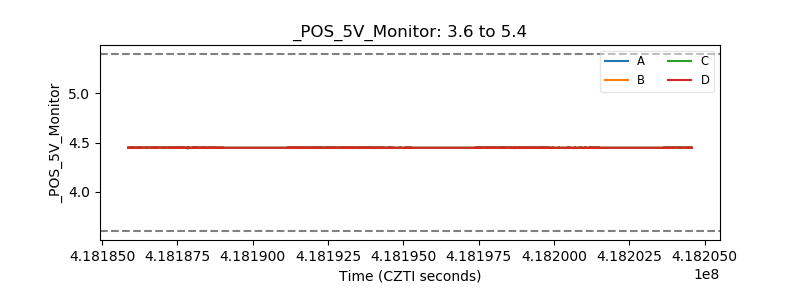 |
| _ROLL_ROT | 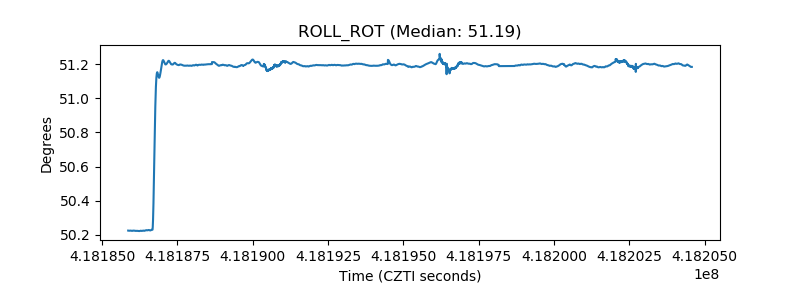 |
| _Roll_DEC | 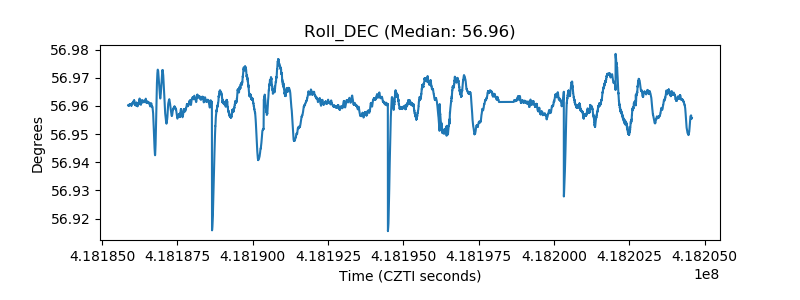 |
| _Roll_RA | 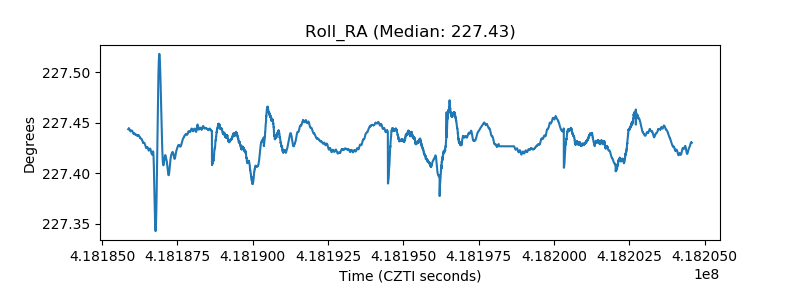 |
| Veto Counter | 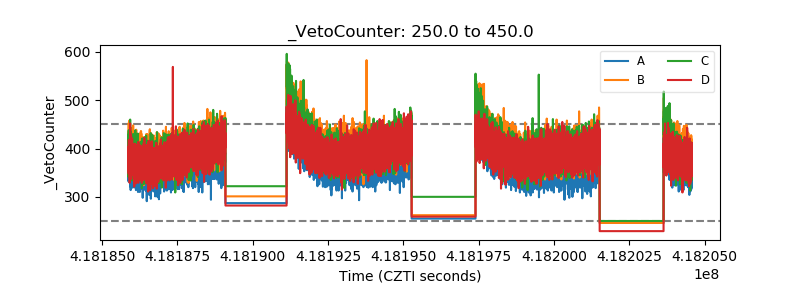 |