| Param | Original file | Final file |
|---|---|---|
| Filename | modeM0/AS1A12_011T59_9000005552_40622cztM0_level2.fits | modeM0/AS1A12_011T59_9000005552_40622cztM0_level2_quad_clean.evt |
| Size (bytes) | 325,486,080 | 82,149,120 |
| Size | 310.4 MB | 78.3 MB |
| Events in quadrant A | 2,651,499 | 568,875 |
| Events in quadrant B | 2,838,191 | 583,611 |
| Events in quadrant C | 2,683,504 | 552,245 |
| Events in quadrant D | 3,480,138 | 427,706 |
| Mode M0 | |||
|---|---|---|---|
| Quadrant | BADHDUFLAG | Total packets | Discarded packets |
| A | 0 | 10827 | 3 |
| B | 0 | 11687 | 2 |
| C | 0 | 11079 | 2 |
| D | 0 | 13742 | 2 |
| Mode M9 | |||
|---|---|---|---|
| Quadrant | BADHDUFLAG | Total packets | Discarded packets |
| A | 0 | 26 | 0 |
| B | 0 | 26 | 0 |
| C | 0 | 26 | 0 |
| D | 0 | 27 | 0 |
| Mode SS | |||
|---|---|---|---|
| Quadrant | BADHDUFLAG | Total packets | Discarded packets |
| A | 0 | 104 | 0 |
| B | 0 | 104 | 0 |
| C | 0 | 104 | 0 |
| D | 0 | 104 | 0 |
| Quadrant | Total seconds | Saturated seconds | Saturation percentage |
|---|---|---|---|
| A | 5061 | 15 | 0.296384% |
| B | 5061 | 50 | 0.987947% |
| C | 5061 | 14 | 0.276625% |
| D | 5061 | 979 | 19.344003% |
Noise dominated data is calculated using 1-second bins in cleaned event files. If a bin has >2000 counts, and if more than 50% of those come from <1% of pixels, then it is considered to be noise-dominated and hence unusable.
| Quadrant | # 1 sec bins | Bins with >0 counts | Bins with >2000 counts | High rate bins dominated by noise | Noise dominated (total time) | Noise dominated (detector-on time) | Marked lightcurve |
|---|---|---|---|---|---|---|---|
| A | 7093 | 5062 | 4 | 4 | 0.06% | 0.08% | 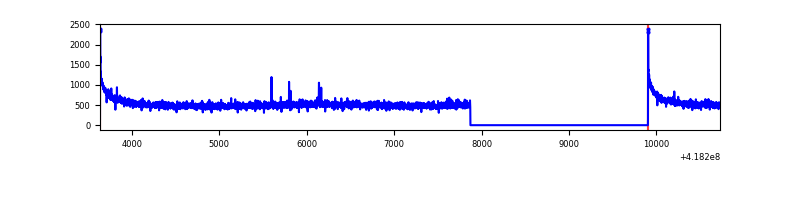 |
| B | 7093 | 5062 | 19 | 19 | 0.27% | 0.38% | 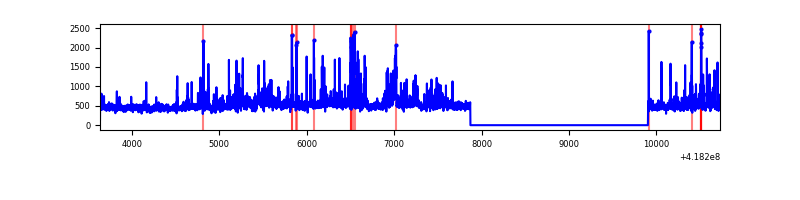 |
| C | 7093 | 5062 | 13 | 13 | 0.18% | 0.26% | 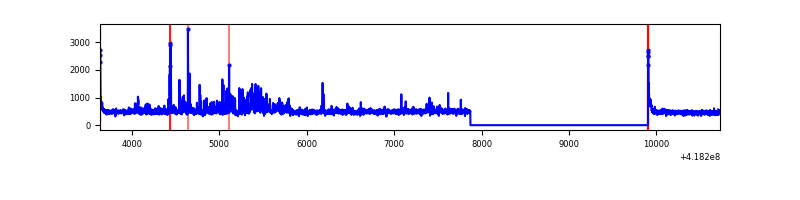 |
| D | 7093 | 5062 | 215 | 215 | 3.03% | 4.25% | 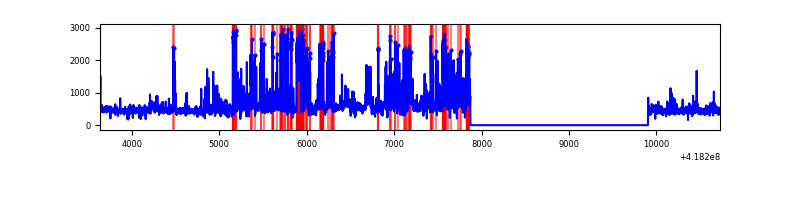 |
Top three noisy pixels from each quadrant. If the there are fewer than three noisy pixels in the level2.evt file, extra rows are filled as -1
| Pixel properties | Quadrant properties | ||||||
|---|---|---|---|---|---|---|---|
| Quadrant | DetID | PixID | Counts | Sigma | Mean | Median | Sigma |
| A | 10 | 83 | 469973 | 4145.67 | 557 | 547 | 113.2 |
| A | 12 | 189 | 15228 | 129.65 | 557 | 547 | 113.2 |
| A | 2 | 79 | 8431 | 69.63 | 557 | 547 | 113.2 |
| B | 0 | 229 | 309599 | 2896.45 | 549 | 535 | 106.7 |
| B | 0 | 190 | 144737 | 1351.41 | 549 | 535 | 106.7 |
| B | 3 | 112 | 121253 | 1131.33 | 549 | 535 | 106.7 |
| C | 9 | 187 | 316335 | 2549.78 | 536 | 538 | 123.9 |
| C | 15 | 214 | 222729 | 1793.99 | 536 | 538 | 123.9 |
| C | 0 | 10 | 46413 | 370.4 | 536 | 538 | 123.9 |
| D | 2 | 153 | 500181 | 4155.29 | 489 | 474 | 120.3 |
| D | 12 | 227 | 459083 | 3813.54 | 489 | 474 | 120.3 |
| D | 2 | 250 | 222230 | 1844.0 | 489 | 474 | 120.3 |
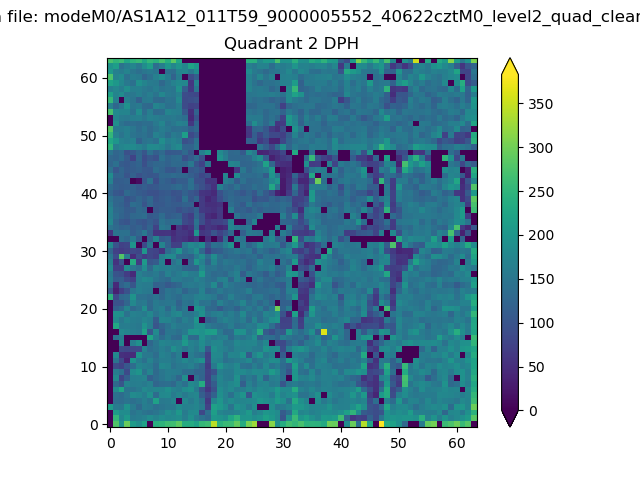
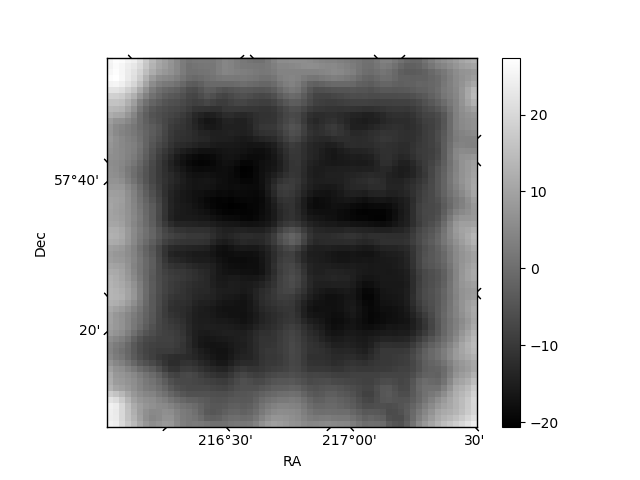
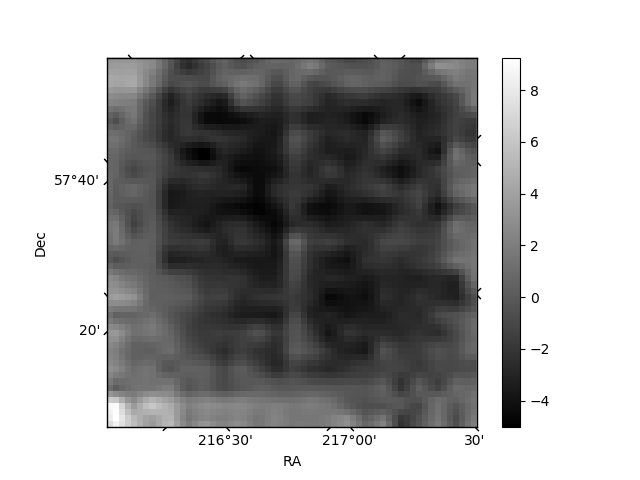
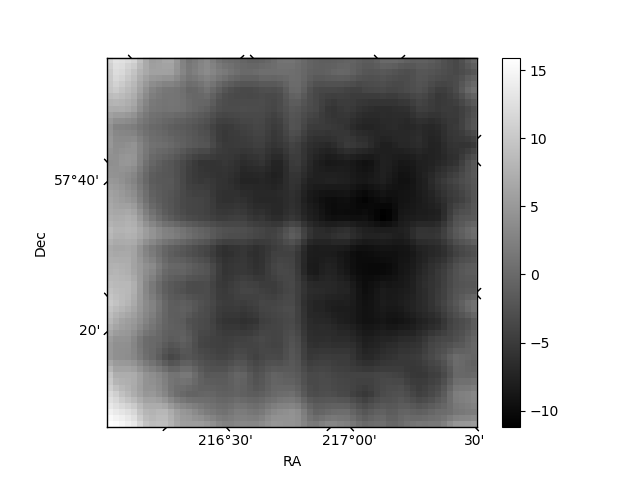
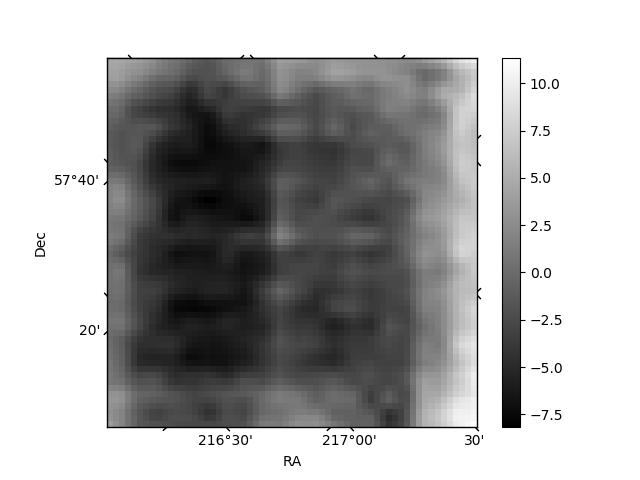
Histogram calculated using DETX and DETY for each event in the final _common_clean file
| Quadrant A | 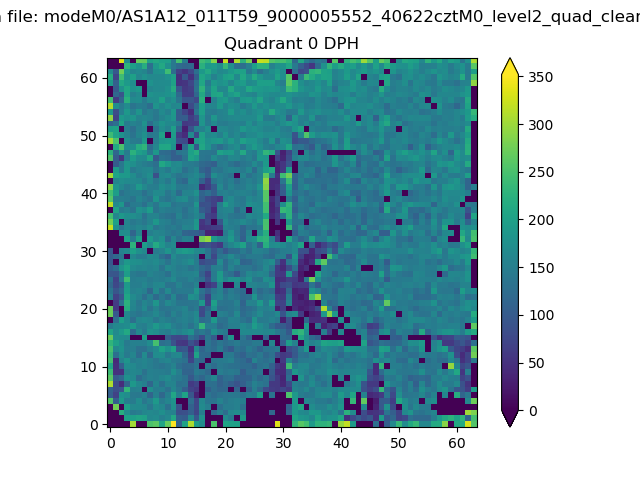 |
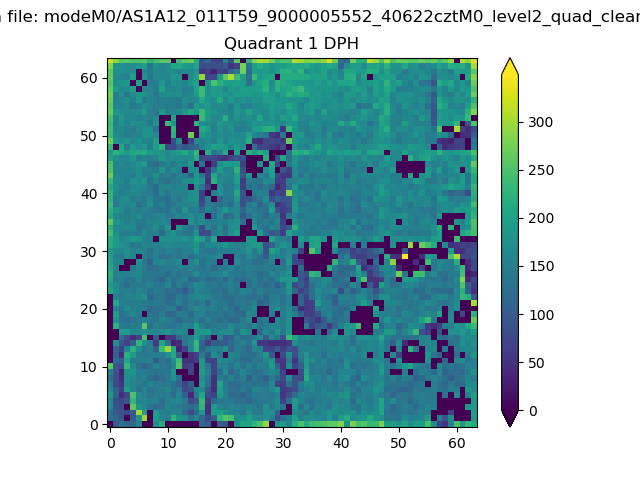 |
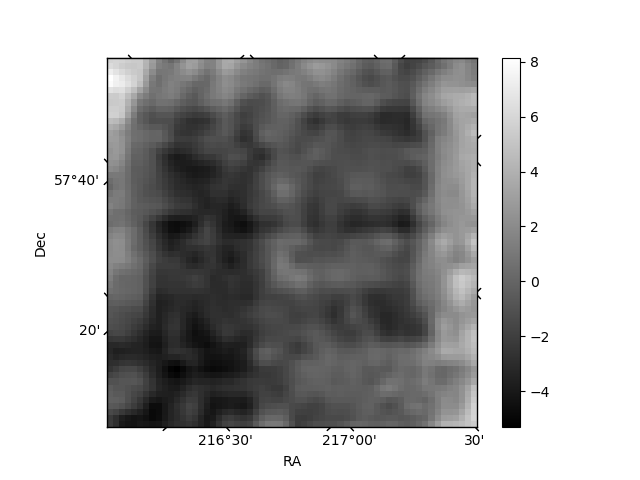
Quadrant B |
|---|---|---|---|
| Quadrant D | 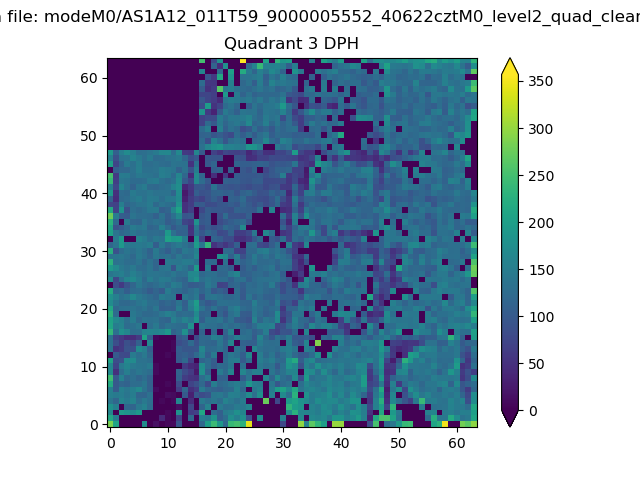 |
 |
Quadrant C |
| Plot type | Count rate plots | Images |
|---|---|---|
| Comparison with Poisson distribution Blue bars denote a histogram of data divided into 1 sec bins. Red curve is a Poisson curve with rate = median count rate of data. |
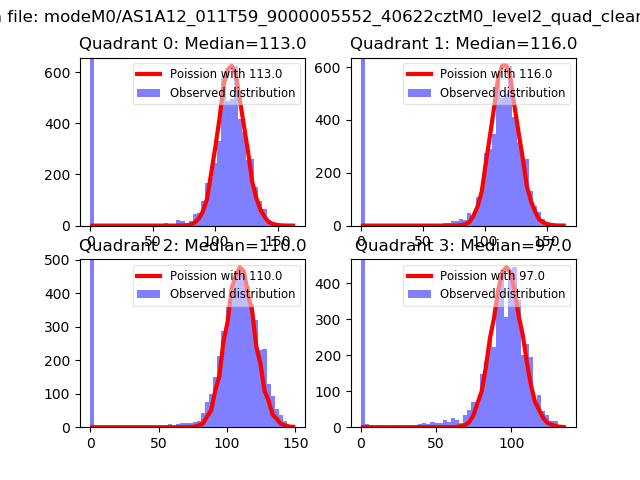 |
 |
| Quadrant-wise count rates Data is divided into 100 sec bins |
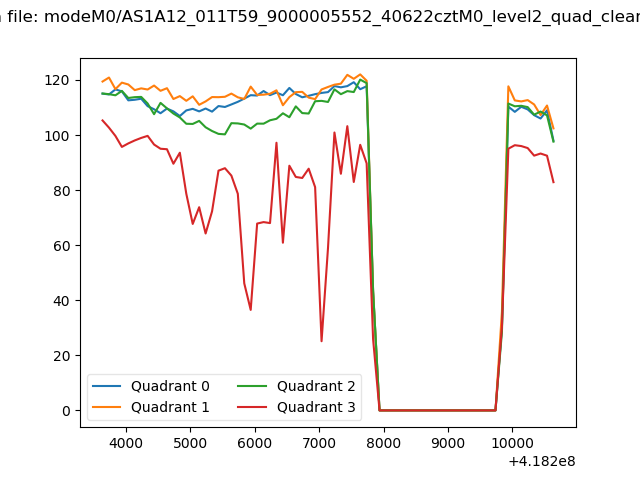 |
|
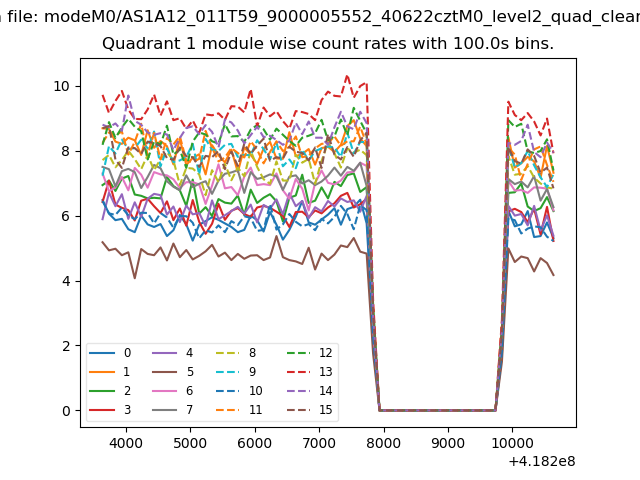
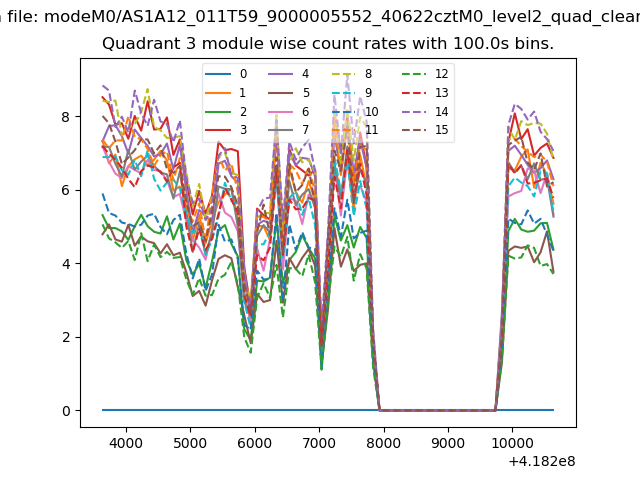
| Module-wise count rates for Quadrant A Data is divided into 100 sec bins |
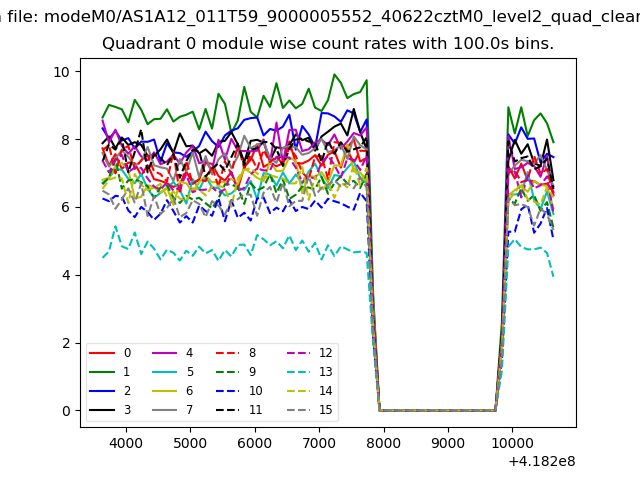 |
 |
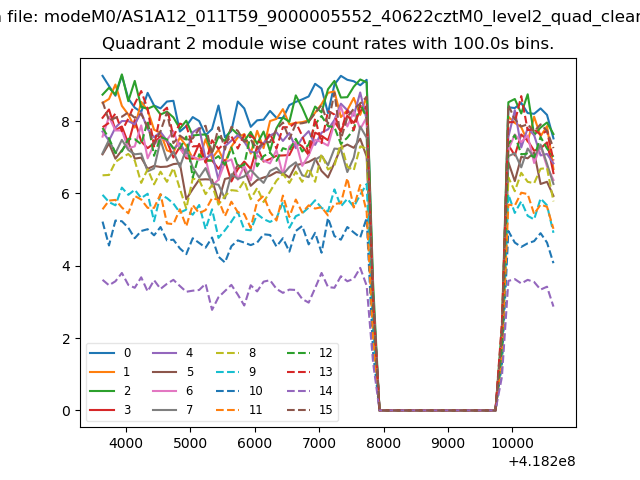
| Module-wise count rates for Quadrant B Data is divided into 100 sec bins |
 |
 |
| Module-wise count rates for Quadrant C Data is divided into 100 sec bins |
 |
 |
| Module-wise count rates for Quadrant D Data is divided into 100 sec bins |
 |
 |
| Parameter | Plot |
|---|---|
| CZT HV Monitor | 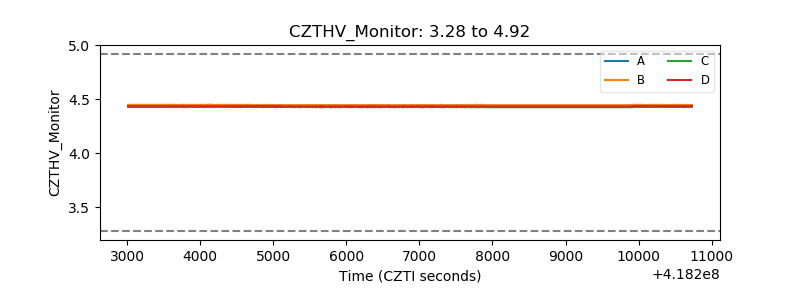 |
| D_VDD | 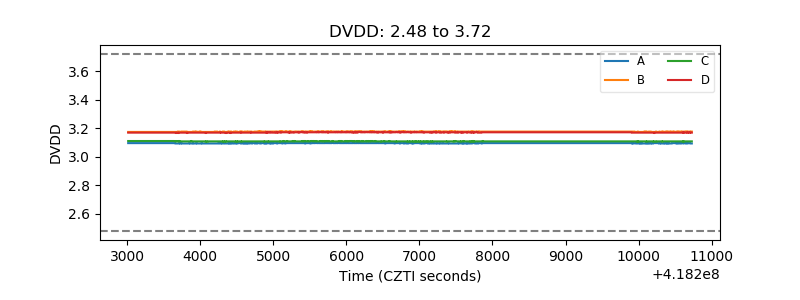 |
| Temperature 1 | 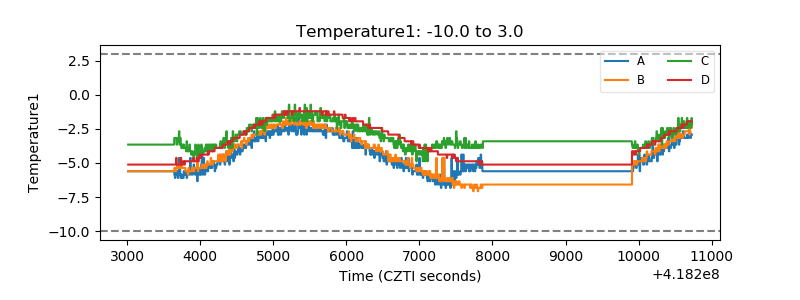 |
| Veto HV Monitor | 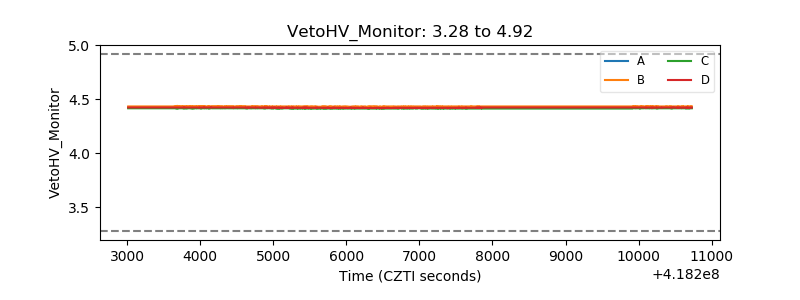 |
| Veto LLD | 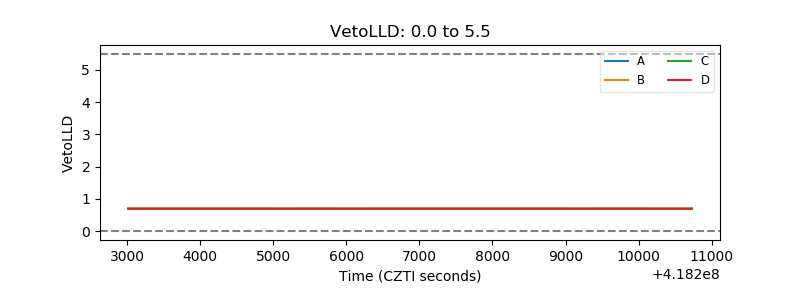 |
| Alpha Counter | 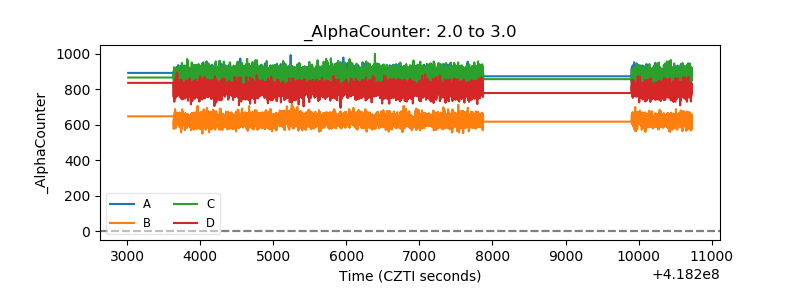 |
| _CPM_Rate | 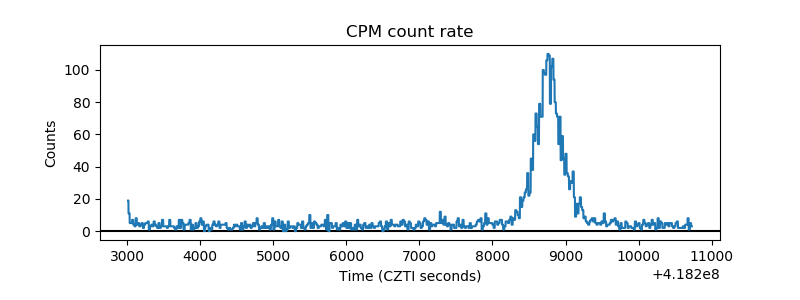 |
| CZT Counter | 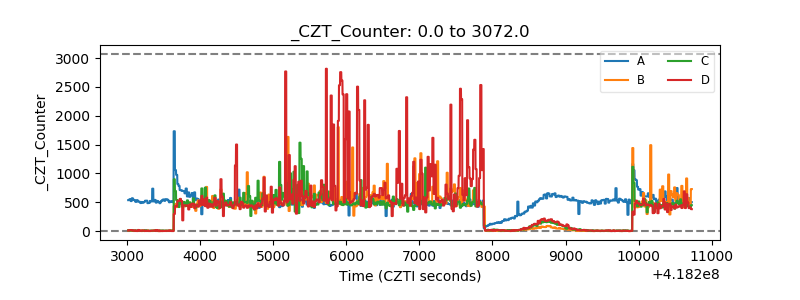 |
| +2.5 Volts monitor | 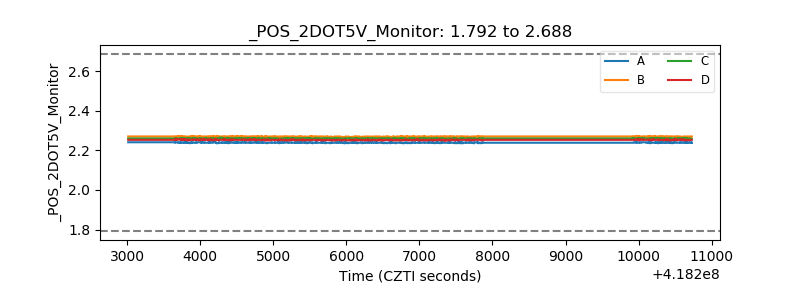 |
| +5 Volts monitor | 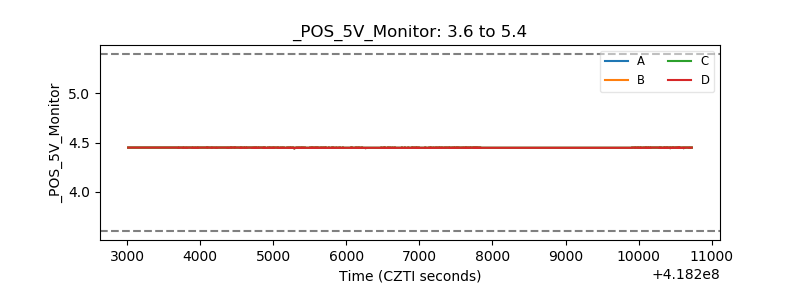 |
| _ROLL_ROT | 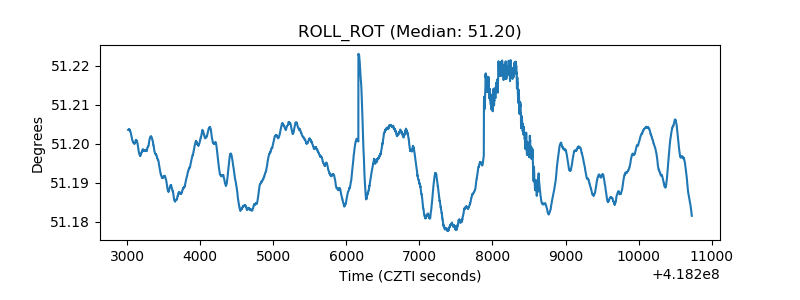 |
| _Roll_DEC | 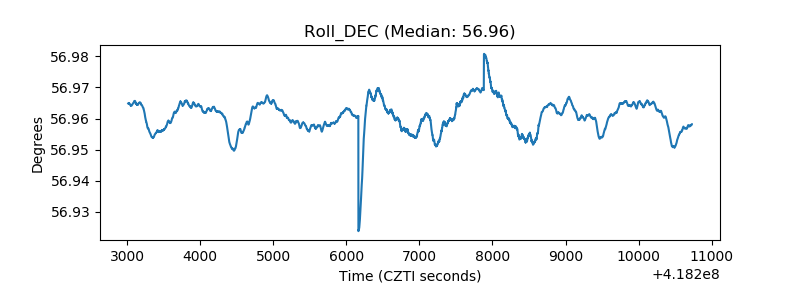 |
| _Roll_RA | 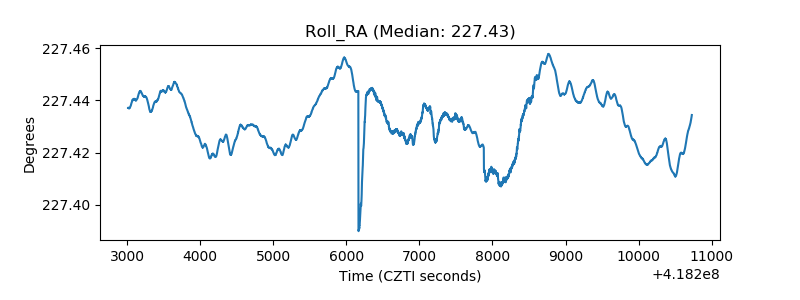 |
| Veto Counter | 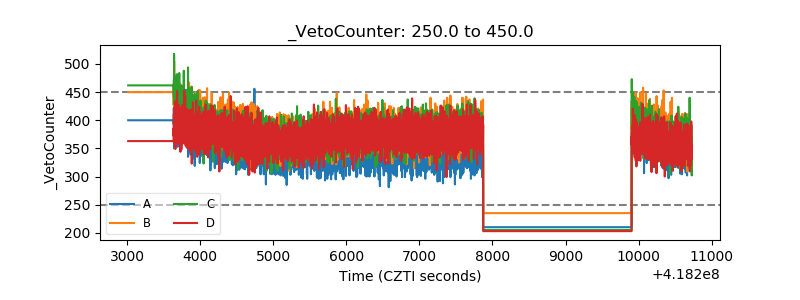 |