| Param | Original file | Final file |
|---|---|---|
| Filename | modeM0/AS1A12_011T59_9000005552_40623cztM0_level2.fits | modeM0/AS1A12_011T59_9000005552_40623cztM0_level2_quad_clean.evt |
| Size (bytes) | 313,116,480 | 84,551,040 |
| Size | 298.6 MB | 80.6 MB |
| Events in quadrant A | 2,946,418 | 585,953 |
| Events in quadrant B | 3,126,582 | 600,905 |
| Events in quadrant C | 2,498,512 | 572,612 |
| Events in quadrant D | 2,599,287 | 424,472 |
| Mode M0 | |||
|---|---|---|---|
| Quadrant | BADHDUFLAG | Total packets | Discarded packets |
| A | 0 | 11953 | 3 |
| B | 0 | 12788 | 2 |
| C | 0 | 10902 | 2 |
| D | 0 | 11412 | 2 |
| Mode M9 | |||
|---|---|---|---|
| Quadrant | BADHDUFLAG | Total packets | Discarded packets |
| A | 0 | 24 | 0 |
| B | 0 | 24 | 0 |
| C | 0 | 24 | 0 |
| D | 0 | 25 | 0 |
| Mode SS | |||
|---|---|---|---|
| Quadrant | BADHDUFLAG | Total packets | Discarded packets |
| A | 0 | 110 | 0 |
| B | 0 | 110 | 0 |
| C | 0 | 110 | 0 |
| D | 0 | 110 | 0 |
| Quadrant | Total seconds | Saturated seconds | Saturation percentage |
|---|---|---|---|
| A | 5369 | 41 | 0.763643% |
| B | 5369 | 63 | 1.173403% |
| C | 5369 | 11 | 0.204880% |
| D | 5369 | 1166 | 21.717266% |
Noise dominated data is calculated using 1-second bins in cleaned event files. If a bin has >2000 counts, and if more than 50% of those come from <1% of pixels, then it is considered to be noise-dominated and hence unusable.
| Quadrant | # 1 sec bins | Bins with >0 counts | Bins with >2000 counts | High rate bins dominated by noise | Noise dominated (total time) | Noise dominated (detector-on time) | Marked lightcurve |
|---|---|---|---|---|---|---|---|
| A | 7163 | 5370 | 32 | 32 | 0.45% | 0.60% | 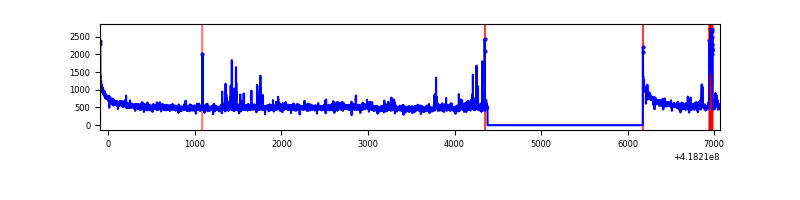 |
| B | 7163 | 5370 | 45 | 45 | 0.63% | 0.84% | 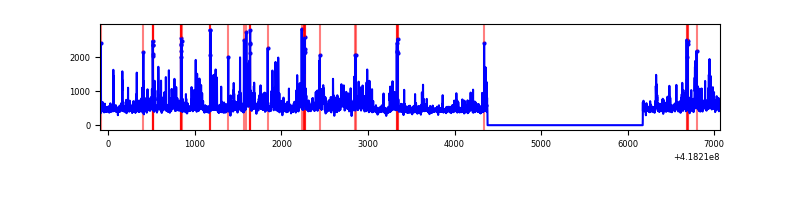 |
| C | 7163 | 5370 | 9 | 9 | 0.13% | 0.17% | 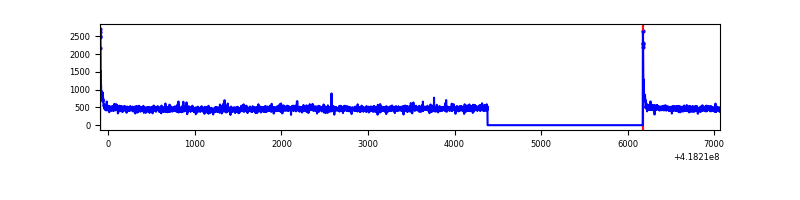 |
| D | 7163 | 5370 | 18 | 18 | 0.25% | 0.34% | 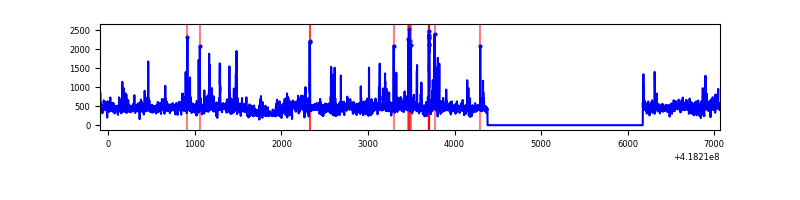 |
Top three noisy pixels from each quadrant. If the there are fewer than three noisy pixels in the level2.evt file, extra rows are filled as -1
| Pixel properties | Quadrant properties | ||||||
|---|---|---|---|---|---|---|---|
| Quadrant | DetID | PixID | Counts | Sigma | Mean | Median | Sigma |
| A | 10 | 83 | 497362 | 4174.13 | 582 | 570 | 119.0 |
| A | 12 | 189 | 159166 | 1332.55 | 582 | 570 | 119.0 |
| A | 2 | 79 | 36176 | 299.17 | 582 | 570 | 119.0 |
| B | 0 | 190 | 324847 | 2886.96 | 575 | 559 | 112.3 |
| B | 0 | 229 | 286178 | 2542.71 | 575 | 559 | 112.3 |
| B | 5 | 255 | 92333 | 817.01 | 575 | 559 | 112.3 |
| C | 15 | 214 | 234068 | 1783.3 | 565 | 568 | 130.9 |
| C | 0 | 10 | 48903 | 369.15 | 565 | 568 | 130.9 |
| C | 12 | 249 | 7563 | 53.42 | 565 | 568 | 130.9 |
| D | 12 | 191 | 289694 | 2420.43 | 487 | 472 | 119.5 |
| D | 2 | 250 | 186935 | 1560.47 | 487 | 472 | 119.5 |
| D | 12 | 227 | 60339 | 501.01 | 487 | 472 | 119.5 |
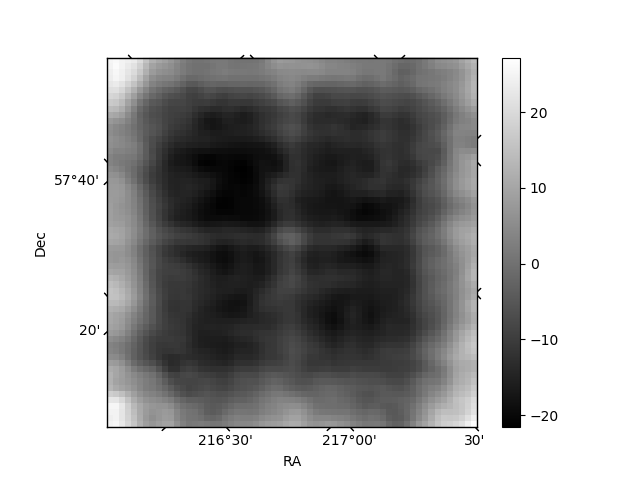
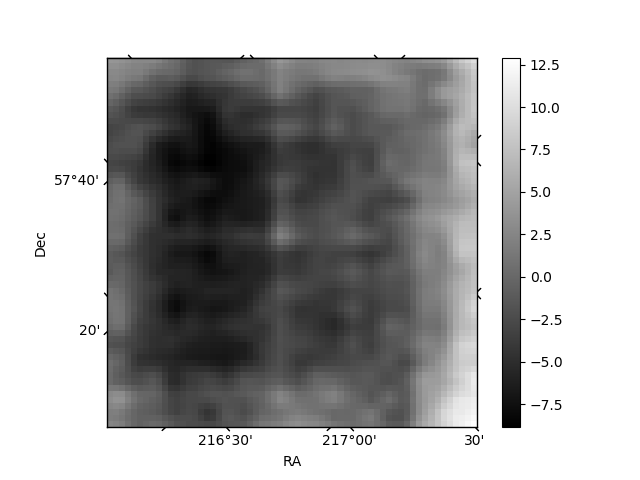
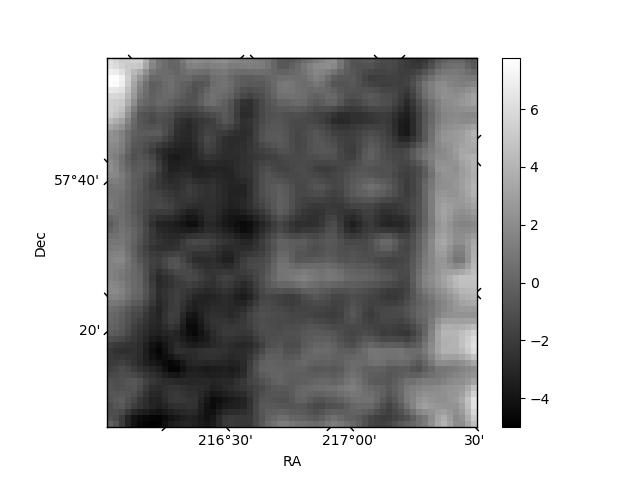
Histogram calculated using DETX and DETY for each event in the final _common_clean file
| Quadrant A | 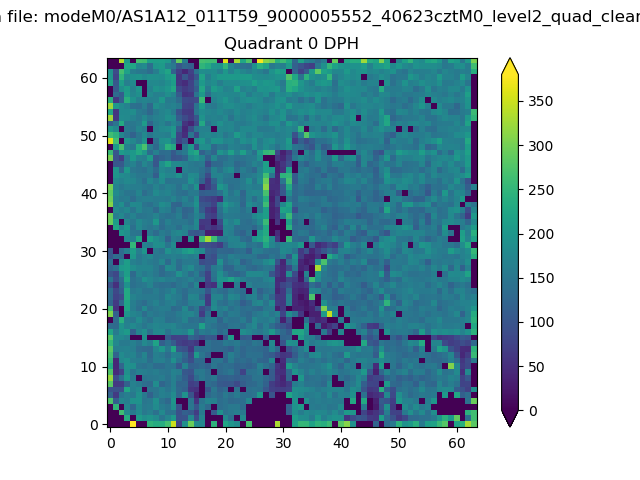 |
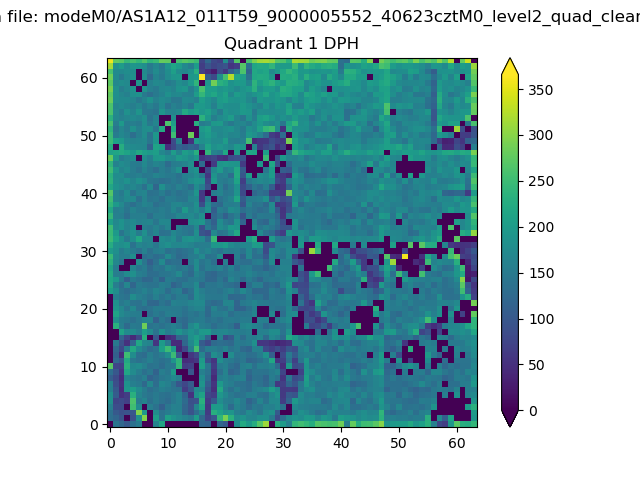 |
Quadrant B |
|---|---|---|---|
| Quadrant D | 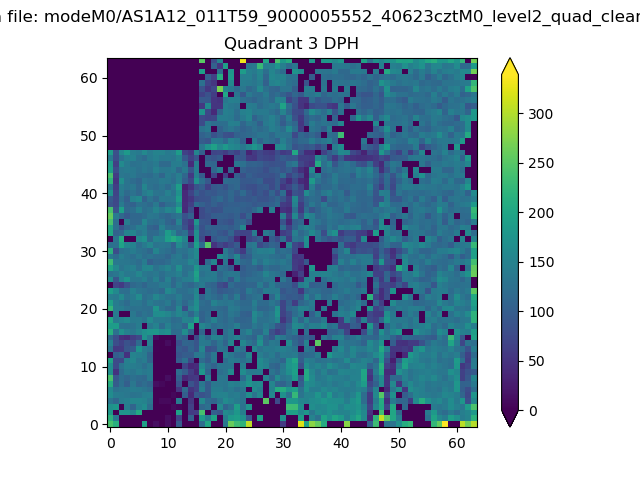 |
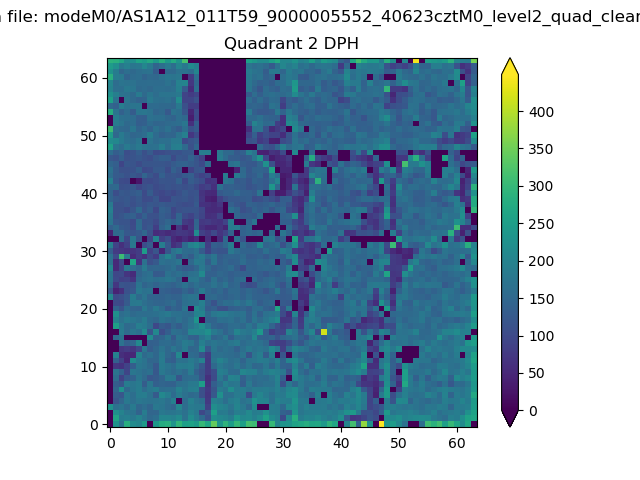 |
Quadrant C |
| Plot type | Count rate plots | Images |
|---|---|---|
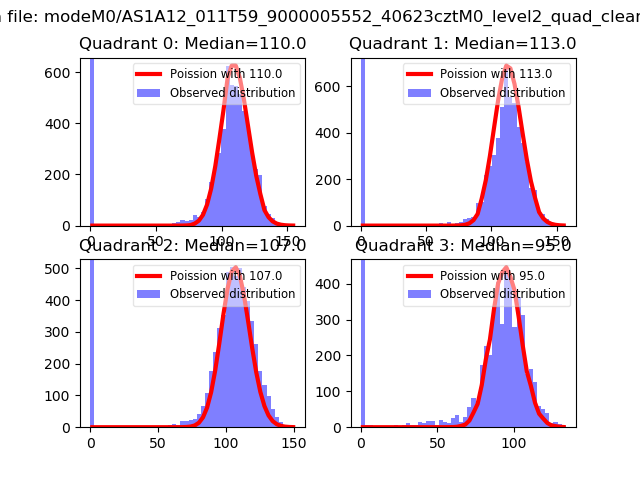
| Comparison with Poisson distribution Blue bars denote a histogram of data divided into 1 sec bins. Red curve is a Poisson curve with rate = median count rate of data. |
 |
 |
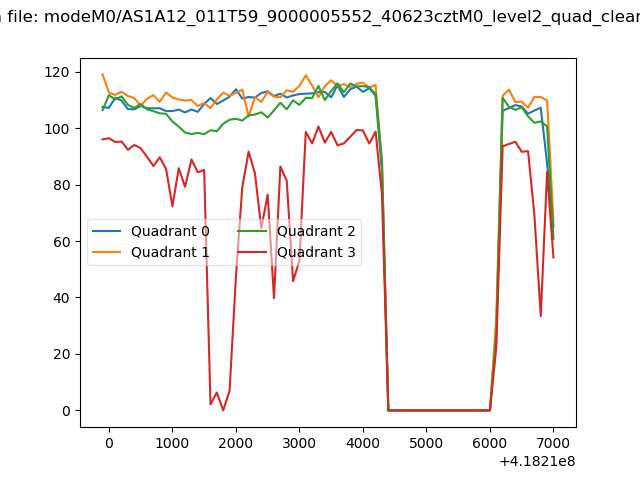
| Quadrant-wise count rates Data is divided into 100 sec bins |
 |
|
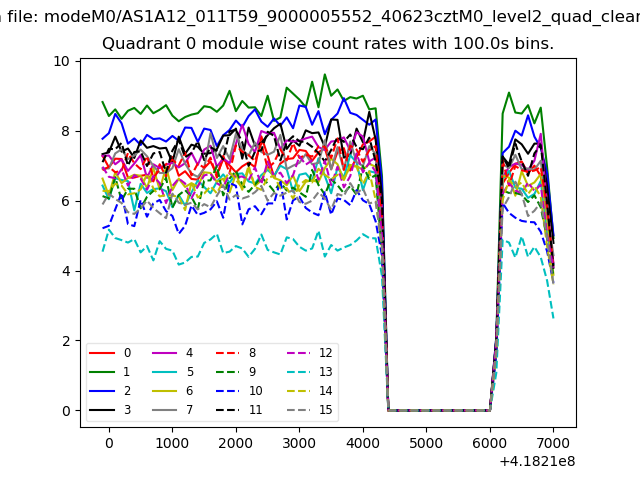
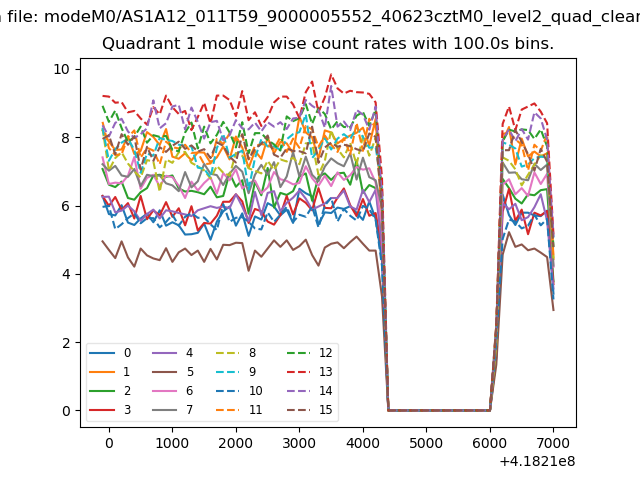
| Module-wise count rates for Quadrant A Data is divided into 100 sec bins |
 |
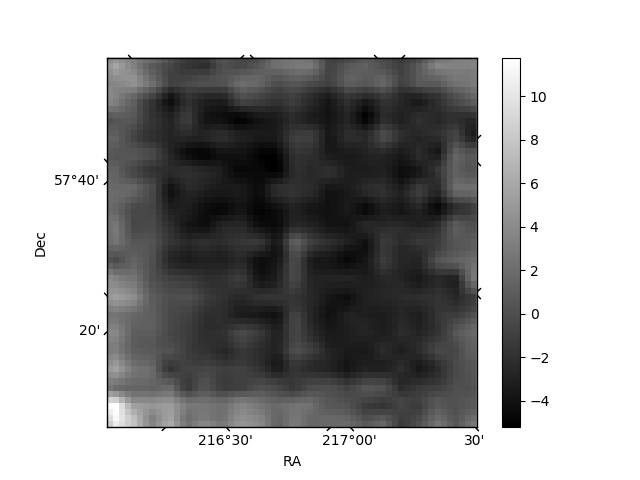 |
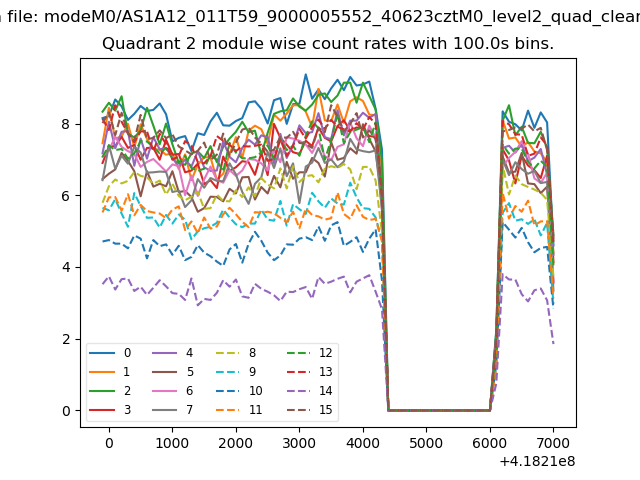
| Module-wise count rates for Quadrant B Data is divided into 100 sec bins |
 |
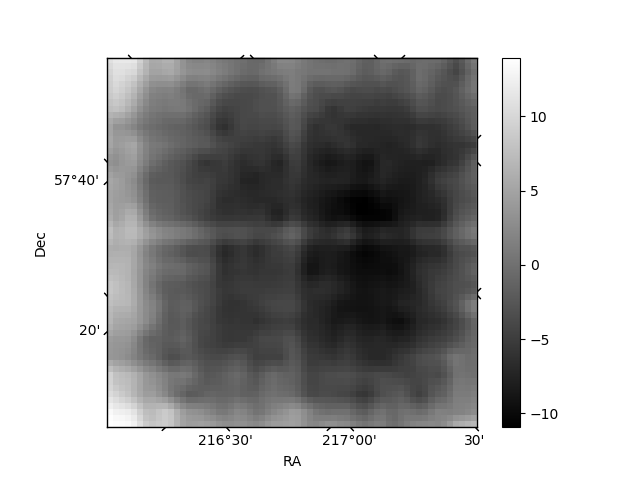 |
| Module-wise count rates for Quadrant C Data is divided into 100 sec bins |
 |
 |
| Module-wise count rates for Quadrant D Data is divided into 100 sec bins |
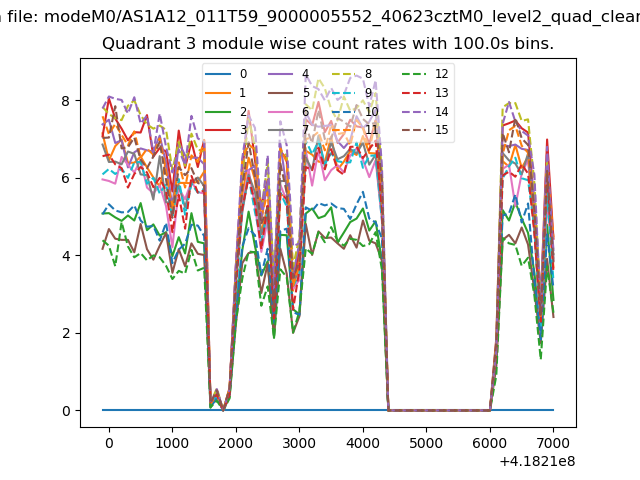 |
 |
| Parameter | Plot |
|---|---|
| CZT HV Monitor | 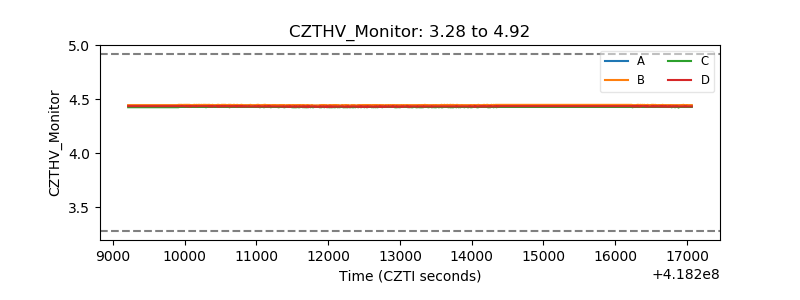 |
| D_VDD | 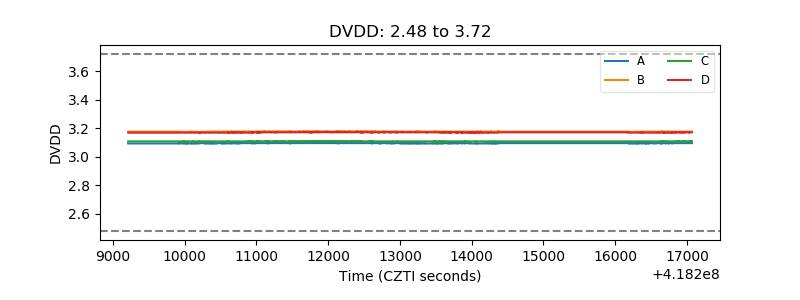 |
| Temperature 1 | 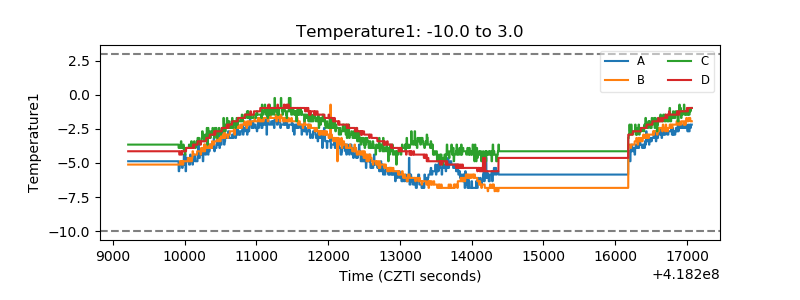 |
| Veto HV Monitor | 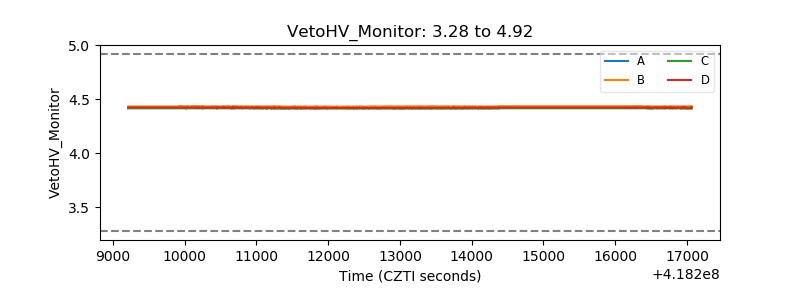 |
| Veto LLD | 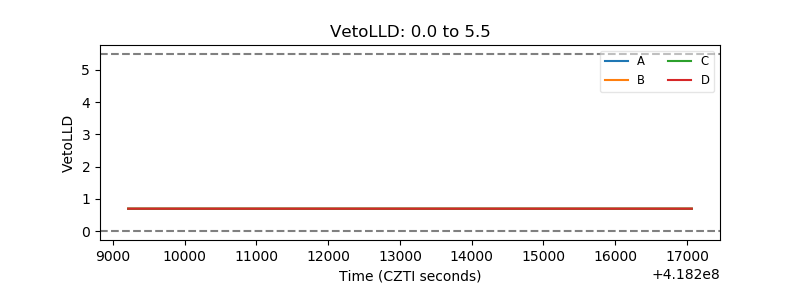 |
| Alpha Counter | 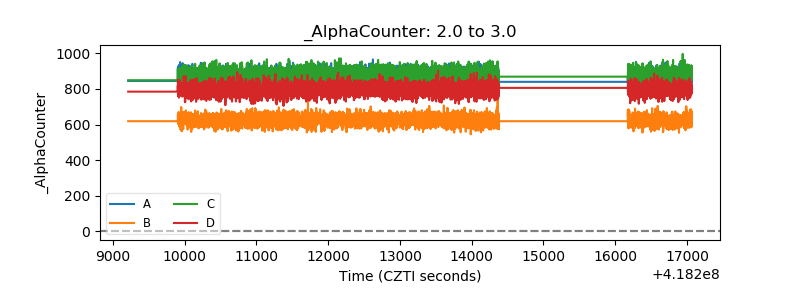 |
| _CPM_Rate | 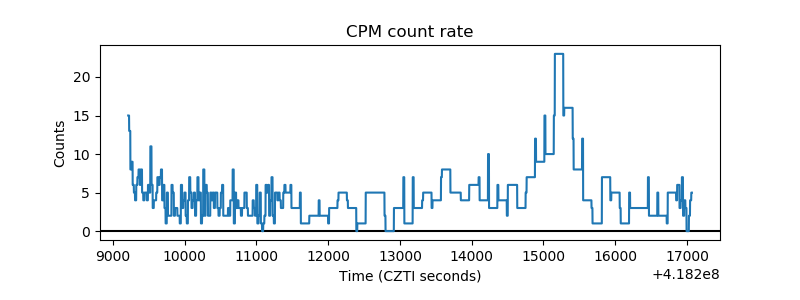 |
| CZT Counter |  |
| +2.5 Volts monitor | 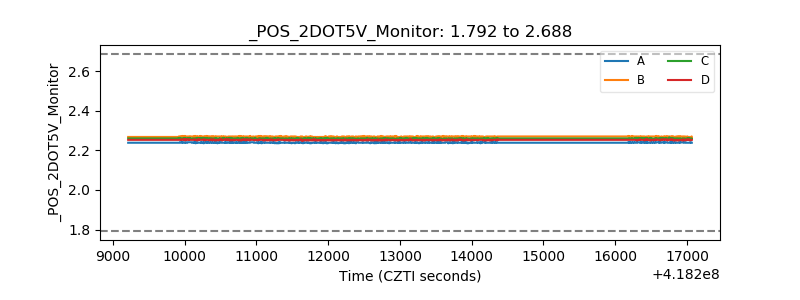 |
| +5 Volts monitor | 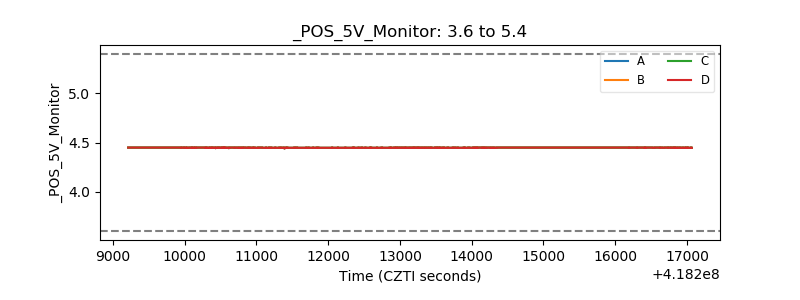 |
| _ROLL_ROT | 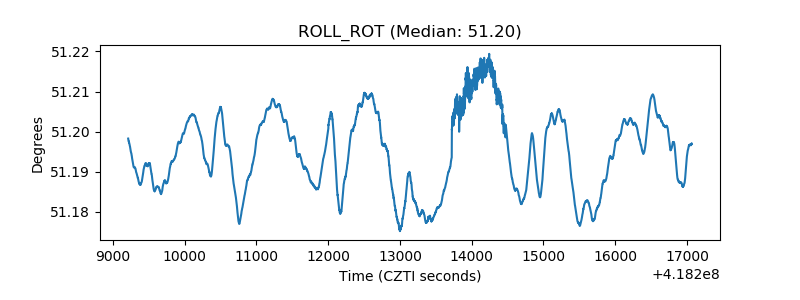 |
| _Roll_DEC | 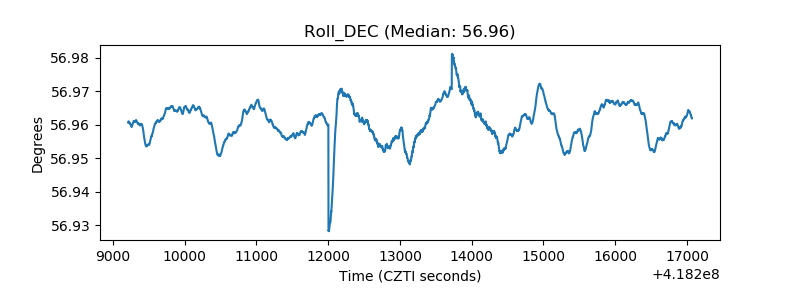 |
| _Roll_RA | 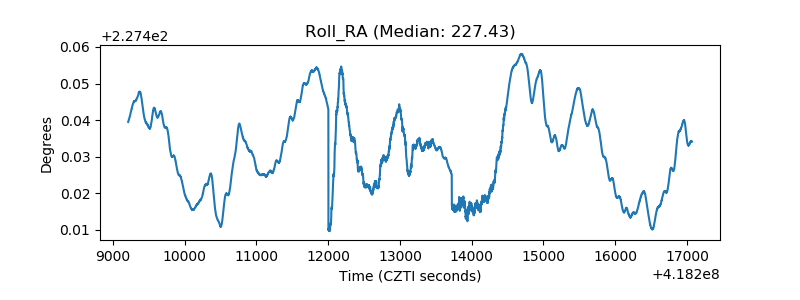 |
| Veto Counter | 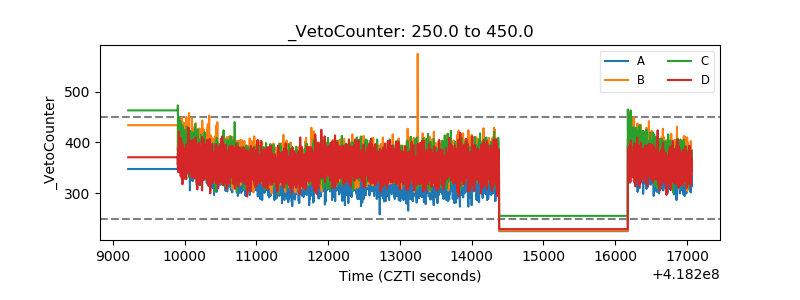 |