| Param | Original file | Final file |
|---|---|---|
| Filename | modeM0/AS1A12_011T59_9000005552_40624cztM0_level2.fits | modeM0/AS1A12_011T59_9000005552_40624cztM0_level2_quad_clean.evt |
| Size (bytes) | 356,411,520 | 88,971,840 |
| Size | 339.9 MB | 84.9 MB |
| Events in quadrant A | 3,081,533 | 622,467 |
| Events in quadrant B | 3,326,015 | 635,398 |
| Events in quadrant C | 2,674,577 | 601,860 |
| Events in quadrant D | 3,662,540 | 432,740 |
| Mode M0 | |||
|---|---|---|---|
| Quadrant | BADHDUFLAG | Total packets | Discarded packets |
| A | 0 | 12686 | 3 |
| B | 0 | 13591 | 2 |
| C | 0 | 11647 | 2 |
| D | 0 | 14746 | 2 |
| Mode M9 | |||
|---|---|---|---|
| Quadrant | BADHDUFLAG | Total packets | Discarded packets |
| A | 0 | 22 | 0 |
| B | 0 | 22 | 0 |
| C | 0 | 22 | 0 |
| D | 0 | 23 | 0 |
| Mode SS | |||
|---|---|---|---|
| Quadrant | BADHDUFLAG | Total packets | Discarded packets |
| A | 0 | 116 | 0 |
| B | 0 | 116 | 0 |
| C | 0 | 116 | 0 |
| D | 0 | 116 | 0 |
| Quadrant | Total seconds | Saturated seconds | Saturation percentage |
|---|---|---|---|
| A | 5742 | 33 | 0.574713% |
| B | 5742 | 55 | 0.957854% |
| C | 5742 | 11 | 0.191571% |
| D | 5742 | 1463 | 25.478927% |
Noise dominated data is calculated using 1-second bins in cleaned event files. If a bin has >2000 counts, and if more than 50% of those come from <1% of pixels, then it is considered to be noise-dominated and hence unusable.
| Quadrant | # 1 sec bins | Bins with >0 counts | Bins with >2000 counts | High rate bins dominated by noise | Noise dominated (total time) | Noise dominated (detector-on time) | Marked lightcurve |
|---|---|---|---|---|---|---|---|
| A | 7205 | 5743 | 29 | 29 | 0.40% | 0.50% | 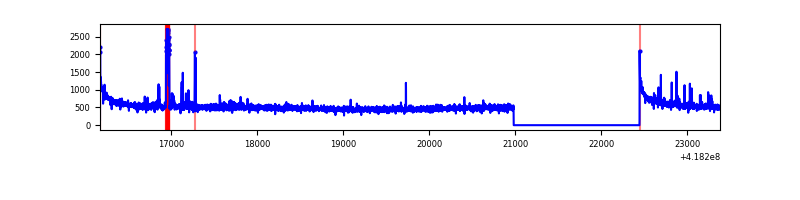 |
| B | 7205 | 5743 | 30 | 30 | 0.42% | 0.52% | 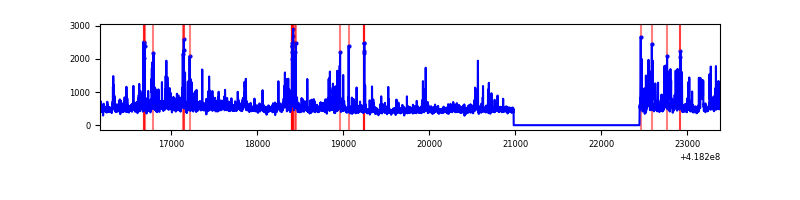 |
| C | 7205 | 5743 | 8 | 8 | 0.11% | 0.14% | 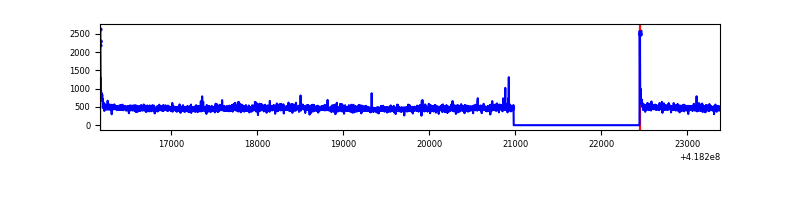 |
| D | 7204 | 5742 | 240 | 240 | 3.33% | 4.18% | 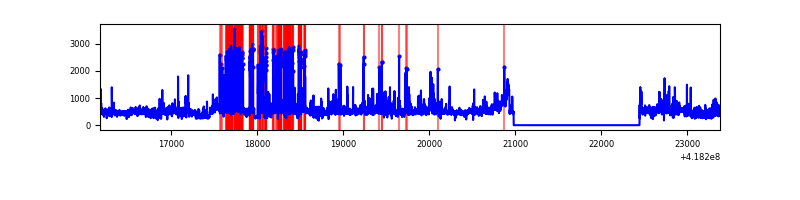 |
Top three noisy pixels from each quadrant. If the there are fewer than three noisy pixels in the level2.evt file, extra rows are filled as -1
| Pixel properties | Quadrant properties | ||||||
|---|---|---|---|---|---|---|---|
| Quadrant | DetID | PixID | Counts | Sigma | Mean | Median | Sigma |
| A | 10 | 83 | 521521 | 4039.79 | 623 | 611 | 128.9 |
| A | 12 | 189 | 115099 | 887.88 | 623 | 611 | 128.9 |
| A | 2 | 79 | 27213 | 206.31 | 623 | 611 | 128.9 |
| B | 0 | 190 | 448243 | 3704.08 | 618 | 600 | 120.9 |
| B | 0 | 229 | 189548 | 1563.47 | 618 | 600 | 120.9 |
| B | 3 | 112 | 109118 | 897.95 | 618 | 600 | 120.9 |
| C | 15 | 214 | 247552 | 1753.4 | 606 | 610 | 140.8 |
| C | 0 | 10 | 37039 | 258.66 | 606 | 610 | 140.8 |
| C | 14 | 254 | 13126 | 88.87 | 606 | 610 | 140.8 |
| D | 12 | 227 | 938160 | 7415.74 | 511 | 496 | 126.4 |
| D | 12 | 191 | 310146 | 2448.94 | 511 | 496 | 126.4 |
| D | 2 | 250 | 147049 | 1159.05 | 511 | 496 | 126.4 |
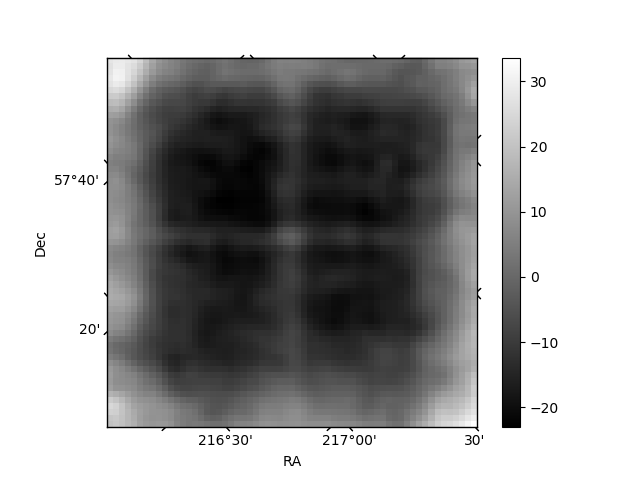
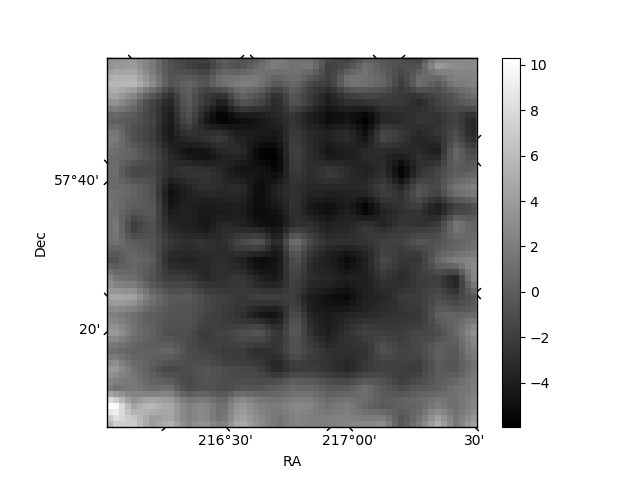
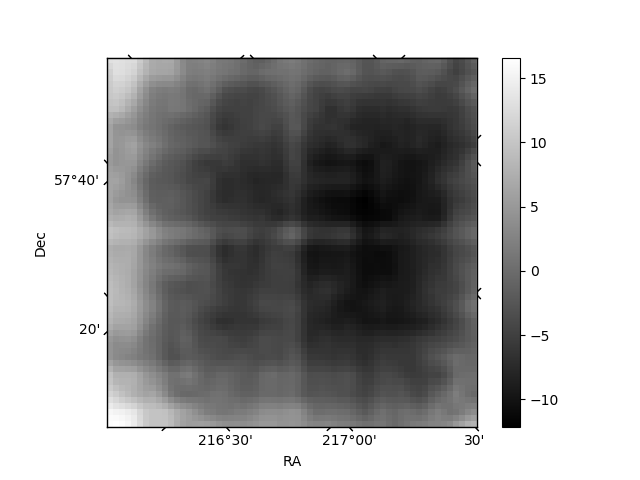
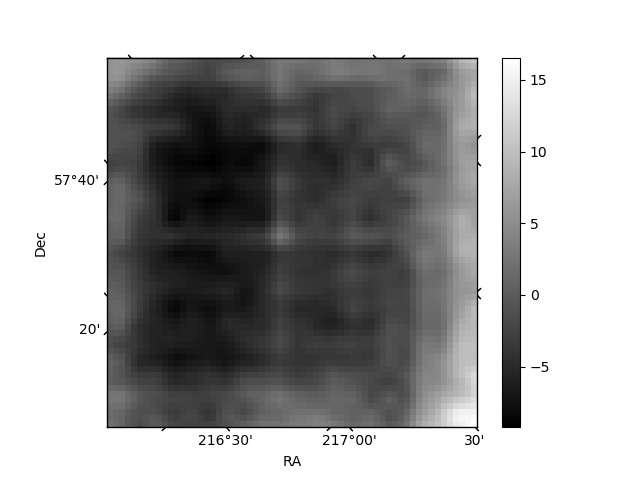
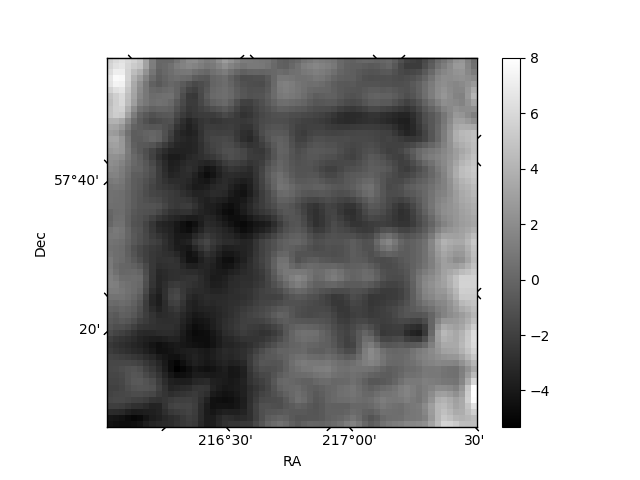
Histogram calculated using DETX and DETY for each event in the final _common_clean file
| Quadrant A | 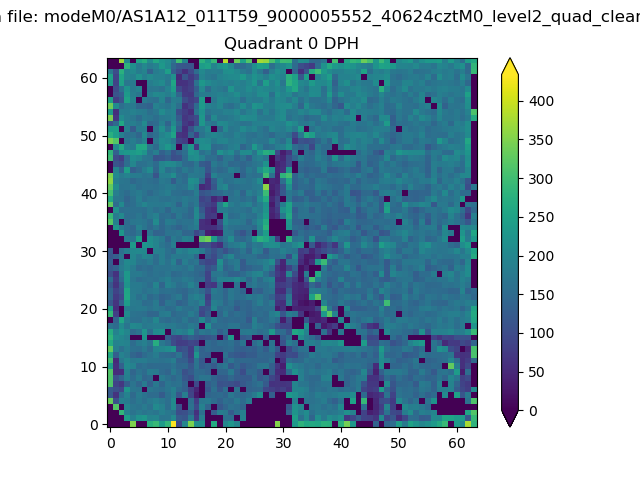 |
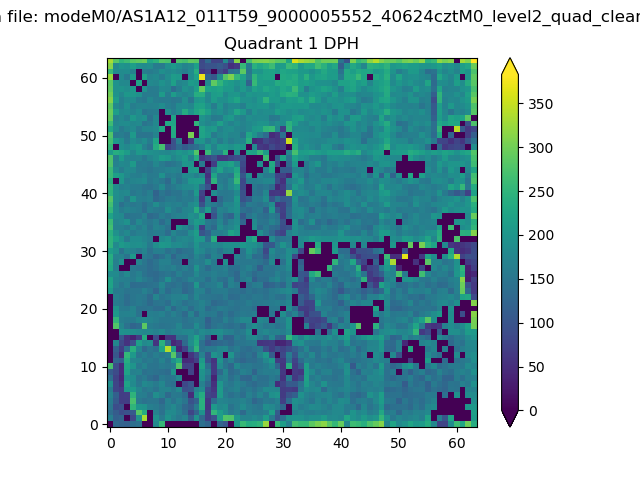 |
Quadrant B |
|---|---|---|---|
| Quadrant D | 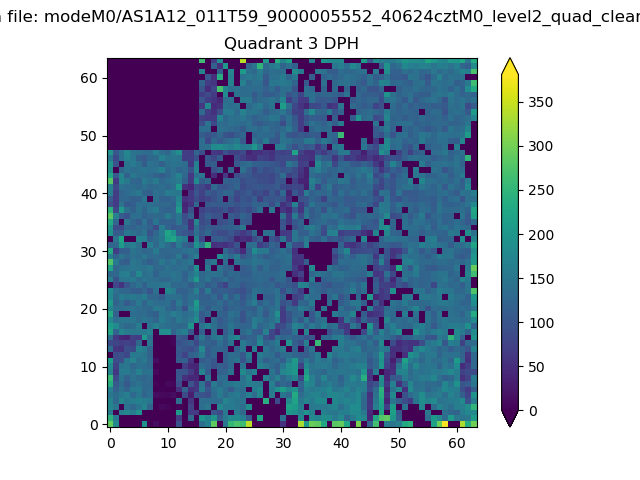 |
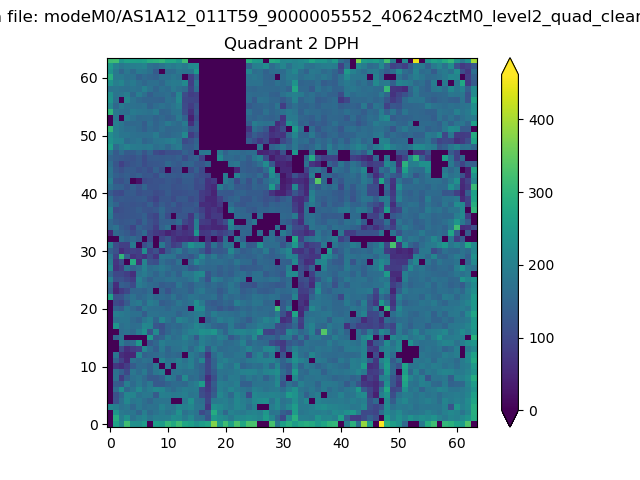 |
Quadrant C |
| Plot type | Count rate plots | Images |
|---|---|---|
| Comparison with Poisson distribution Blue bars denote a histogram of data divided into 1 sec bins. Red curve is a Poisson curve with rate = median count rate of data. |
 |
 |
| Quadrant-wise count rates Data is divided into 100 sec bins |
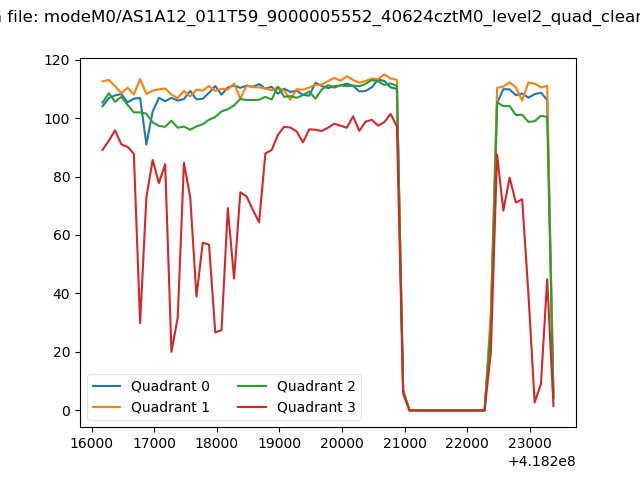 |
|
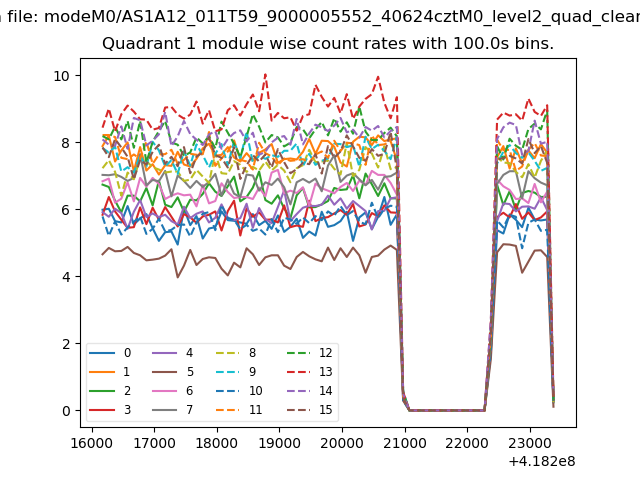
| Module-wise count rates for Quadrant A Data is divided into 100 sec bins |
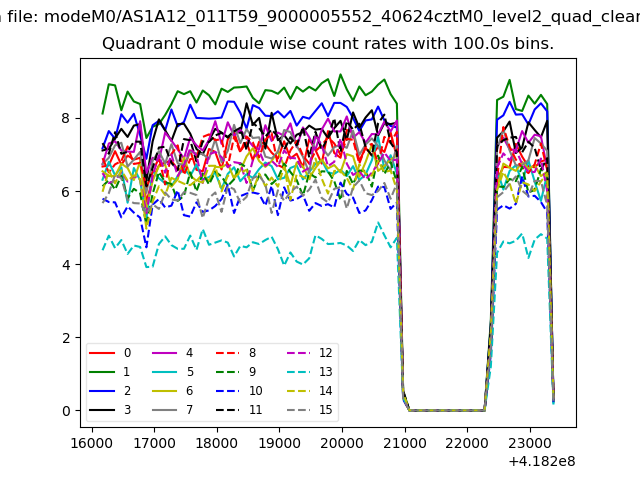 |
 |
| Module-wise count rates for Quadrant B Data is divided into 100 sec bins |
 |
 |
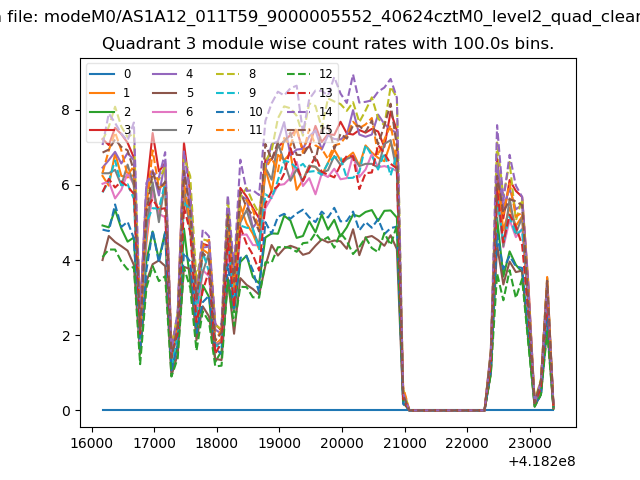
| Module-wise count rates for Quadrant C Data is divided into 100 sec bins |
 |
 |
| Module-wise count rates for Quadrant D Data is divided into 100 sec bins |
 |
 |
| Parameter | Plot |
|---|---|
| CZT HV Monitor |  |
| D_VDD | 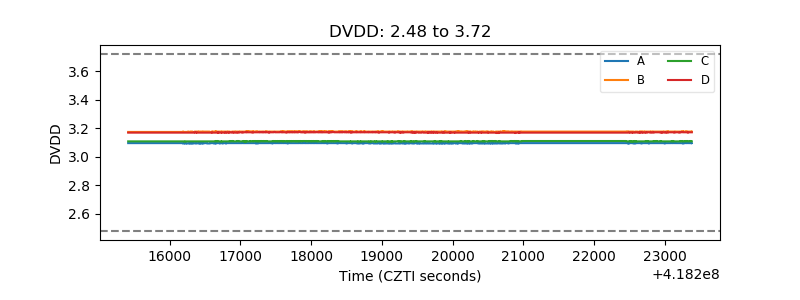 |
| Temperature 1 | 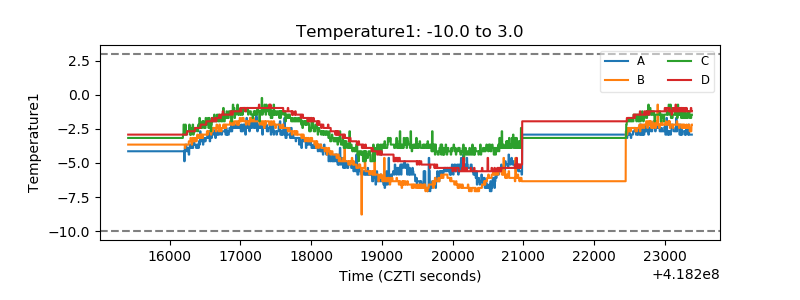 |
| Veto HV Monitor | 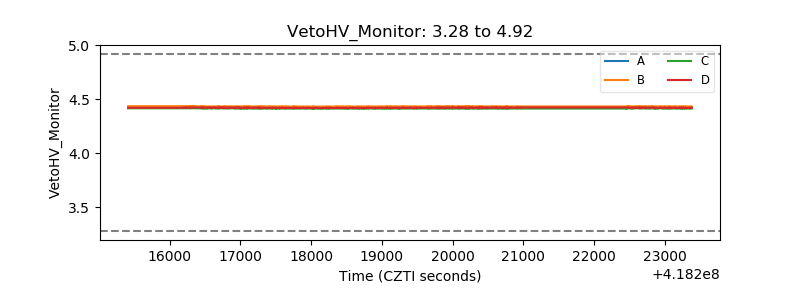 |
| Veto LLD | 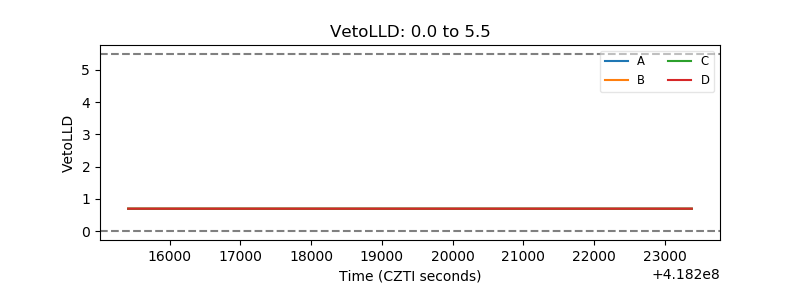 |
| Alpha Counter | 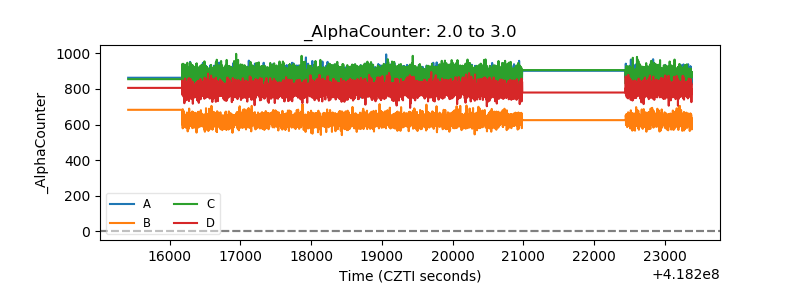 |
| _CPM_Rate | 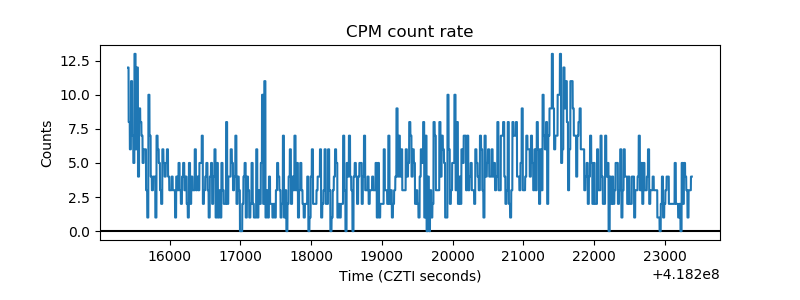 |
| CZT Counter | 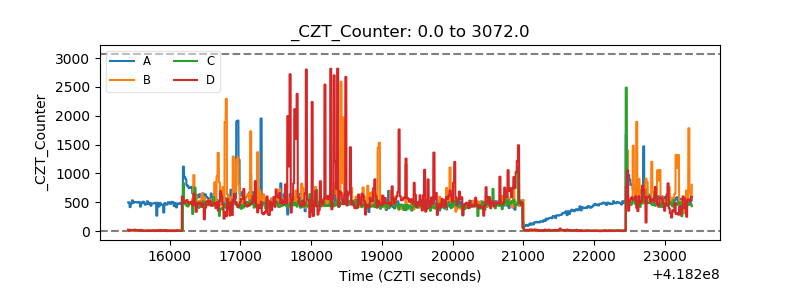 |
| +2.5 Volts monitor | 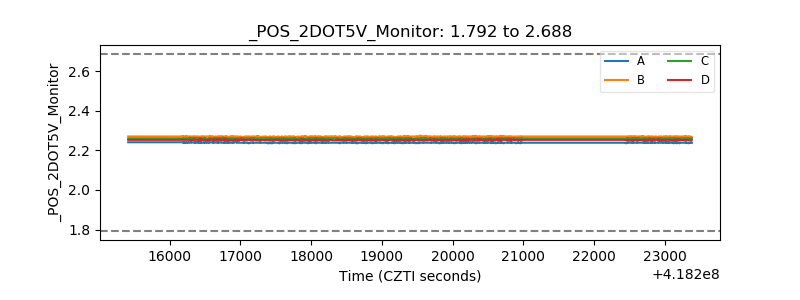 |
| +5 Volts monitor | 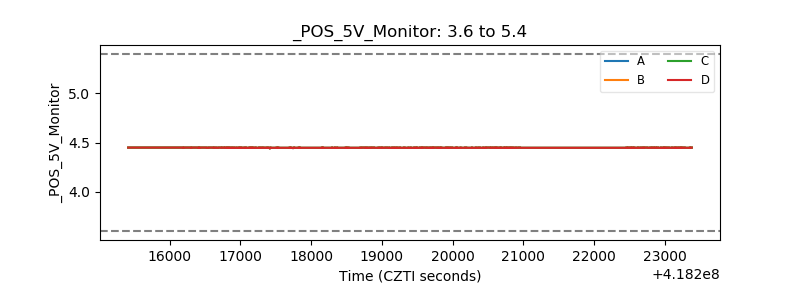 |
| _ROLL_ROT | 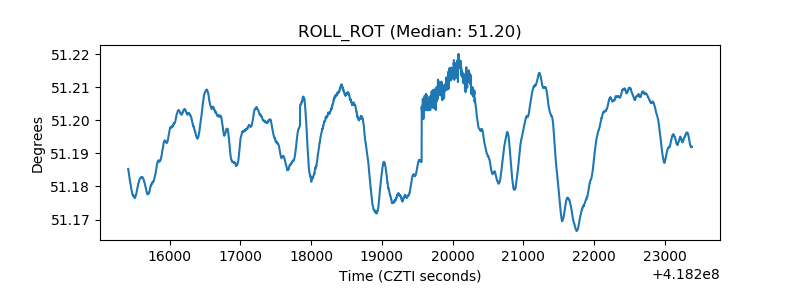 |
| _Roll_DEC | 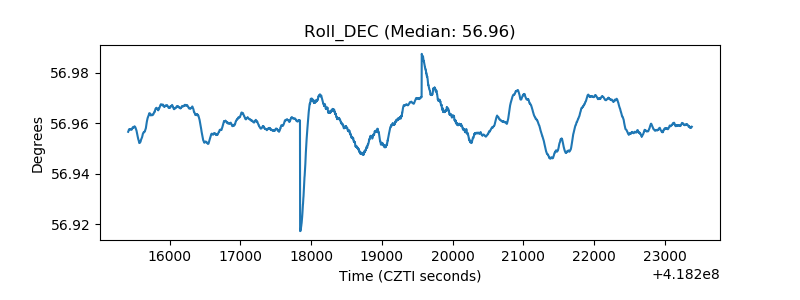 |
| _Roll_RA | 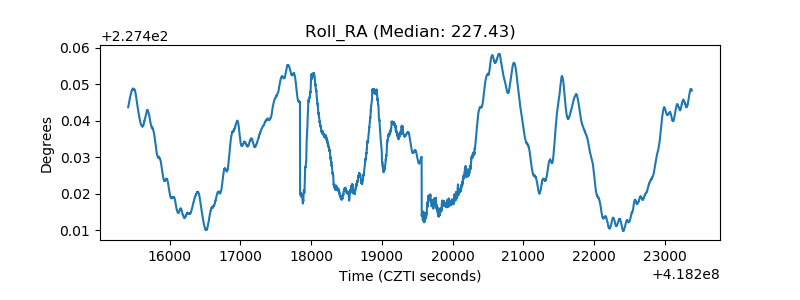 |
| Veto Counter | 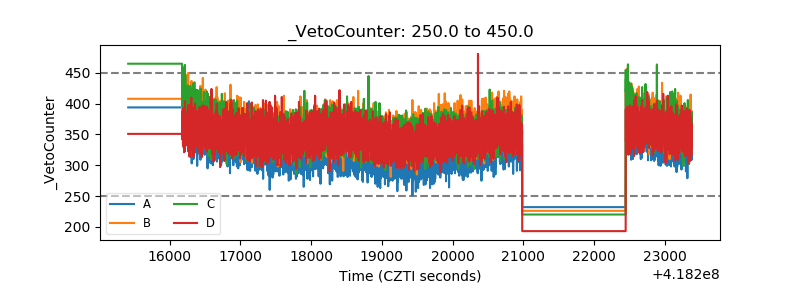 |