| Param | Original file | Final file |
|---|---|---|
| Filename | modeM0/AS1A12_011T59_9000005552_40625cztM0_level2.fits | modeM0/AS1A12_011T59_9000005552_40625cztM0_level2_quad_clean.evt |
| Size (bytes) | 204,661,440 | 51,393,600 |
| Size | 195.2 MB | 49.0 MB |
| Events in quadrant A | 1,726,651 | 366,064 |
| Events in quadrant B | 2,216,694 | 366,204 |
| Events in quadrant C | 1,549,122 | 350,595 |
| Events in quadrant D | 1,816,273 | 232,370 |
| Mode M0 | |||
|---|---|---|---|
| Quadrant | BADHDUFLAG | Total packets | Discarded packets |
| A | 0 | 7293 | 1 |
| B | 0 | 8869 | 1 |
| C | 0 | 6870 | 1 |
| D | 0 | 7811 | 1 |
| Mode M9 | |||
|---|---|---|---|
| Quadrant | BADHDUFLAG | Total packets | Discarded packets |
| A | 0 | 9 | 0 |
| B | 0 | 9 | 0 |
| C | 0 | 9 | 0 |
| D | 0 | 10 | 0 |
| Mode SS | |||
|---|---|---|---|
| Quadrant | BADHDUFLAG | Total packets | Discarded packets |
| A | 0 | 68 | 0 |
| B | 0 | 68 | 0 |
| C | 0 | 68 | 0 |
| D | 0 | 68 | 0 |
| Quadrant | Total seconds | Saturated seconds | Saturation percentage |
|---|---|---|---|
| A | 3394 | 3 | 0.088391% |
| B | 3394 | 88 | 2.592811% |
| C | 3394 | 8 | 0.235710% |
| D | 3394 | 1118 | 32.940483% |
Noise dominated data is calculated using 1-second bins in cleaned event files. If a bin has >2000 counts, and if more than 50% of those come from <1% of pixels, then it is considered to be noise-dominated and hence unusable.
| Quadrant | # 1 sec bins | Bins with >0 counts | Bins with >2000 counts | High rate bins dominated by noise | Noise dominated (total time) | Noise dominated (detector-on time) | Marked lightcurve |
|---|---|---|---|---|---|---|---|
| A | 3394 | 3394 | 1 | 1 | 0.03% | 0.03% | 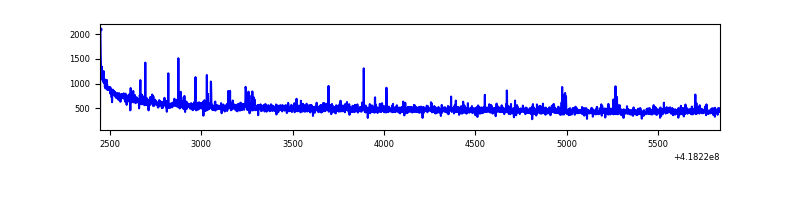 |
| B | 3394 | 3394 | 65 | 65 | 1.92% | 1.92% | 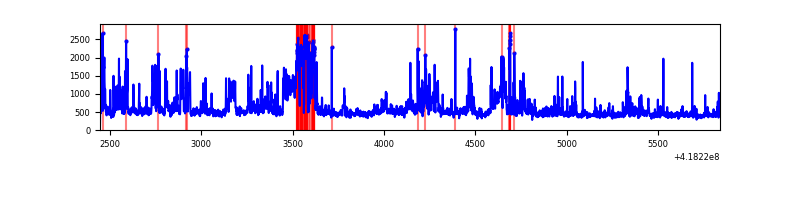 |
| C | 3394 | 3394 | 4 | 4 | 0.12% | 0.12% | 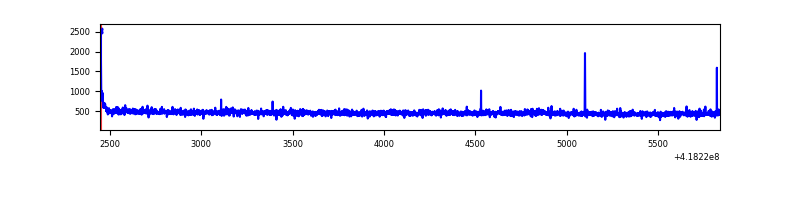 |
| D | 3394 | 3394 | 16 | 16 | 0.47% | 0.47% | 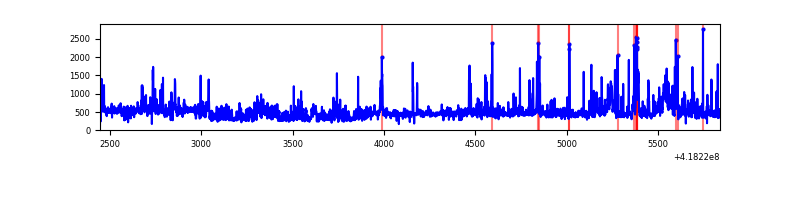 |
Top three noisy pixels from each quadrant. If the there are fewer than three noisy pixels in the level2.evt file, extra rows are filled as -1
| Pixel properties | Quadrant properties | ||||||
|---|---|---|---|---|---|---|---|
| Quadrant | DetID | PixID | Counts | Sigma | Mean | Median | Sigma |
| A | 10 | 83 | 294734 | 3903.81 | 360 | 352 | 75.4 |
| A | 2 | 79 | 28402 | 371.97 | 360 | 352 | 75.4 |
| A | 12 | 189 | 4442 | 54.23 | 360 | 352 | 75.4 |
| B | 0 | 190 | 482832 | 6945.38 | 353 | 345 | 69.5 |
| B | 0 | 229 | 157045 | 2255.69 | 353 | 345 | 69.5 |
| B | 5 | 255 | 100880 | 1447.2 | 353 | 345 | 69.5 |
| C | 15 | 214 | 145498 | 1746.78 | 353 | 354 | 83.1 |
| C | 0 | 10 | 17519 | 206.58 | 353 | 354 | 83.1 |
| C | 14 | 254 | 4968 | 55.53 | 353 | 354 | 83.1 |
| D | 12 | 191 | 221674 | 3145.87 | 286 | 278 | 70.4 |
| D | 2 | 153 | 129643 | 1838.18 | 286 | 278 | 70.4 |
| D | 2 | 250 | 129581 | 1837.3 | 286 | 278 | 70.4 |
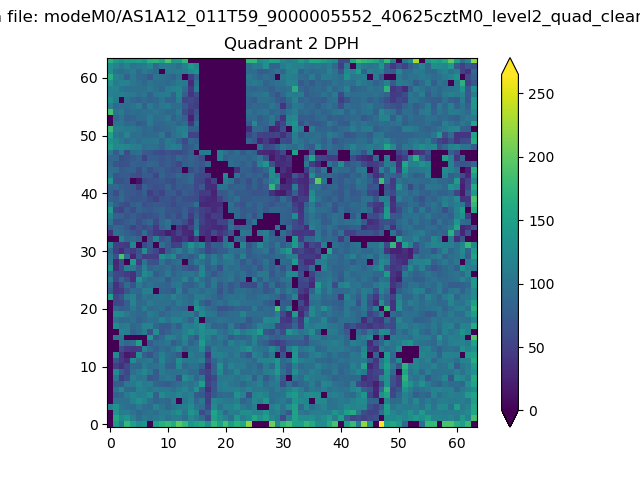
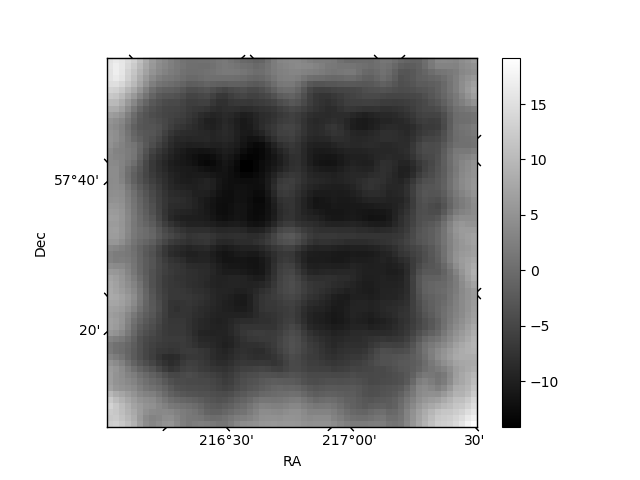
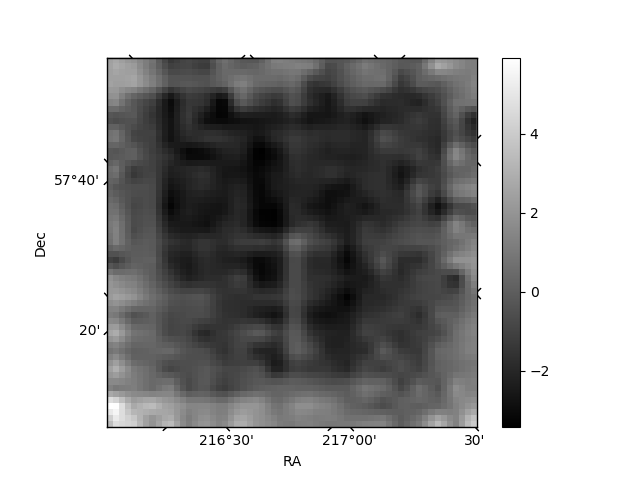
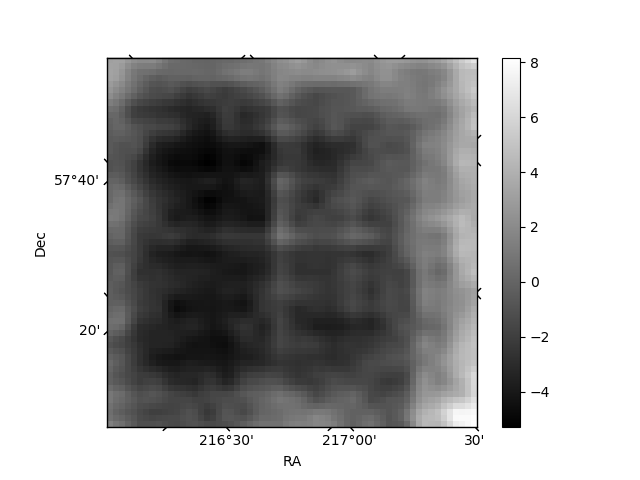
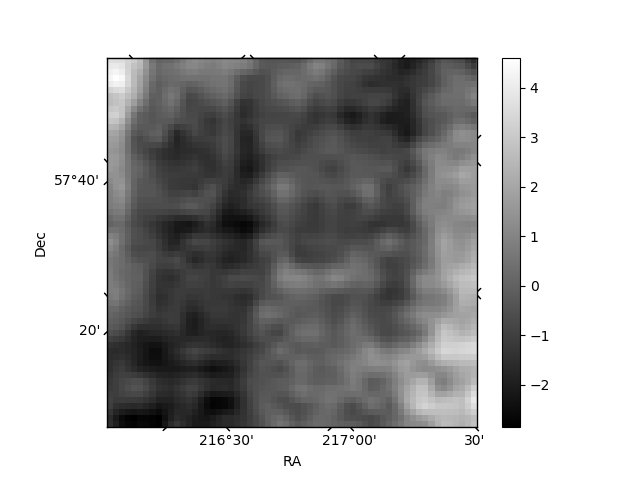
Histogram calculated using DETX and DETY for each event in the final _common_clean file
| Quadrant A | 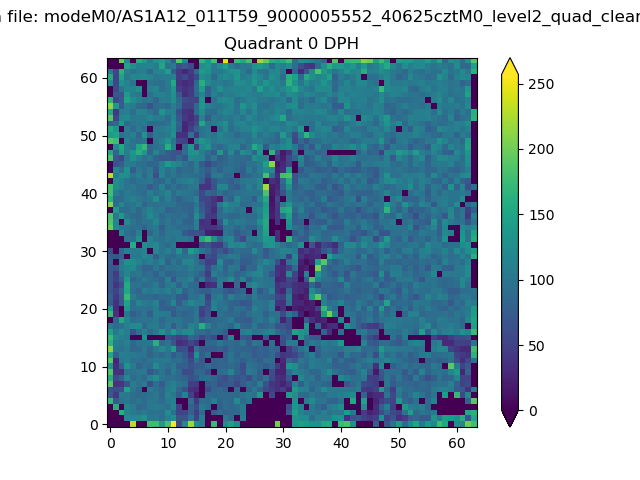 |
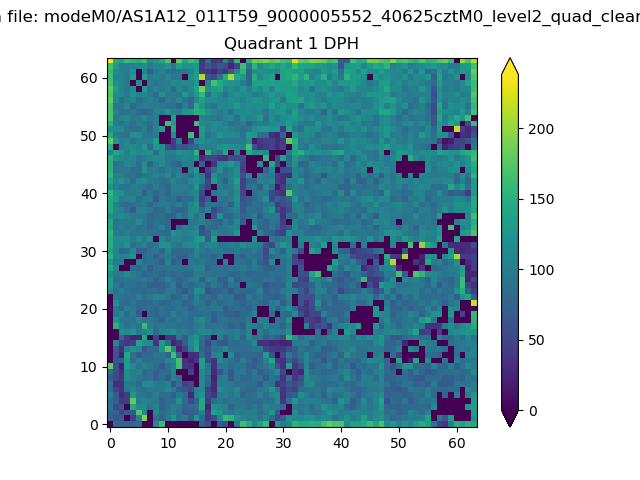 |
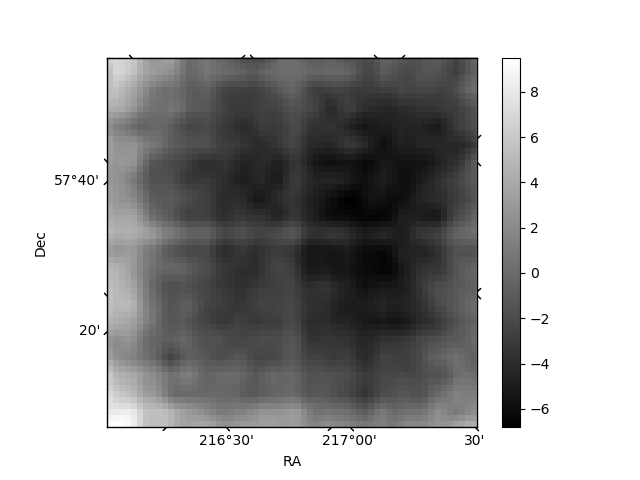
Quadrant B |
|---|---|---|---|
| Quadrant D | 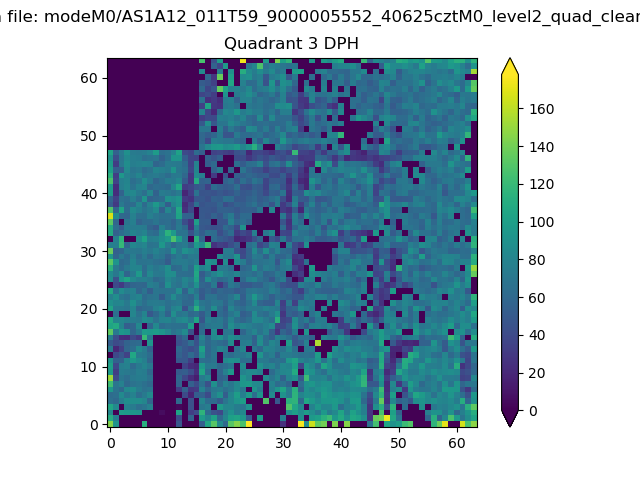 |
 |
Quadrant C |
| Plot type | Count rate plots | Images |
|---|---|---|
| Comparison with Poisson distribution Blue bars denote a histogram of data divided into 1 sec bins. Red curve is a Poisson curve with rate = median count rate of data. |
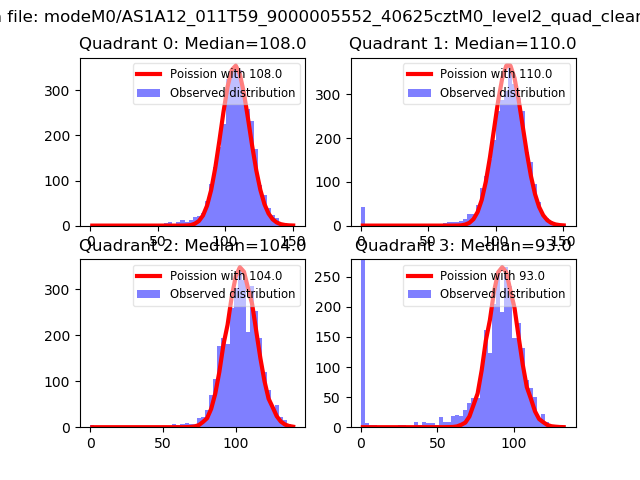 |
 |
| Quadrant-wise count rates Data is divided into 100 sec bins |
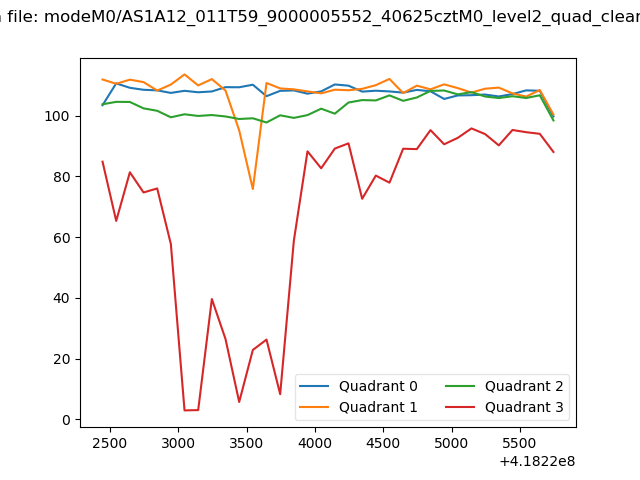 |
|
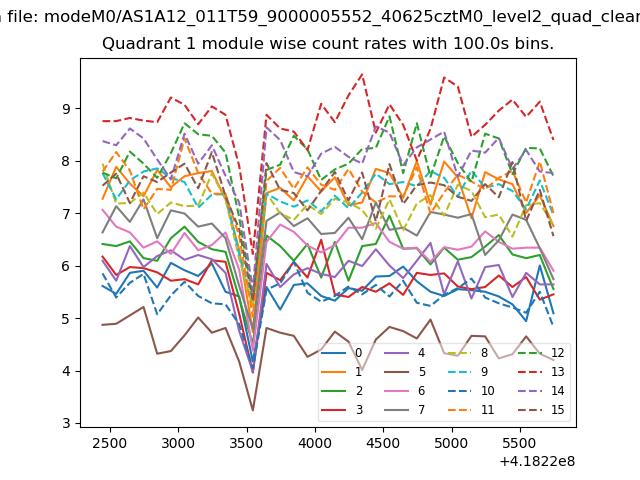
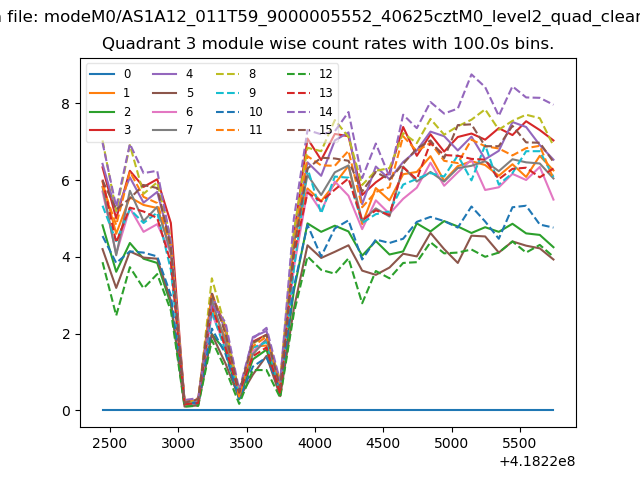
| Module-wise count rates for Quadrant A Data is divided into 100 sec bins |
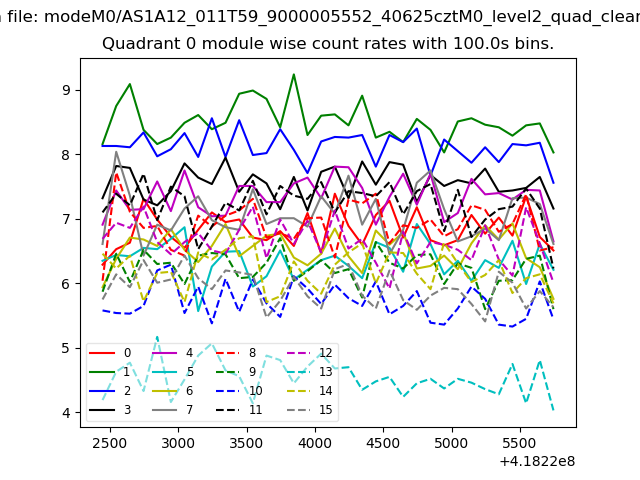 |
 |
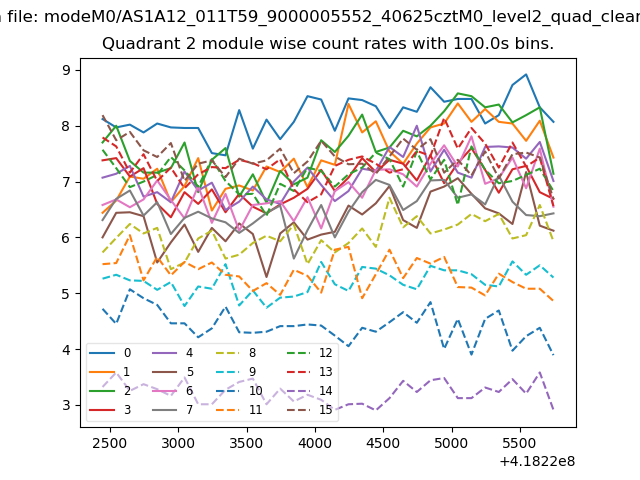
| Module-wise count rates for Quadrant B Data is divided into 100 sec bins |
 |
 |
| Module-wise count rates for Quadrant C Data is divided into 100 sec bins |
 |
 |
| Module-wise count rates for Quadrant D Data is divided into 100 sec bins |
 |
 |
| Parameter | Plot |
|---|---|
| CZT HV Monitor | 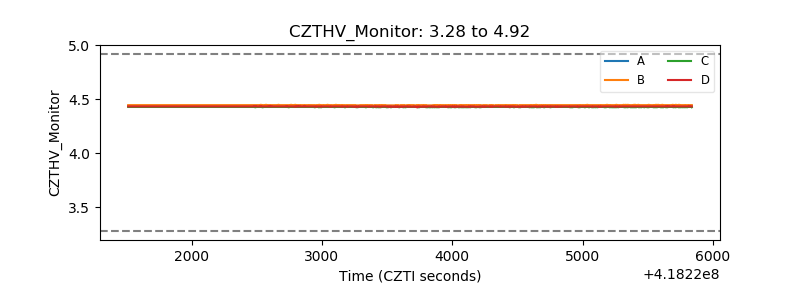 |
| D_VDD | 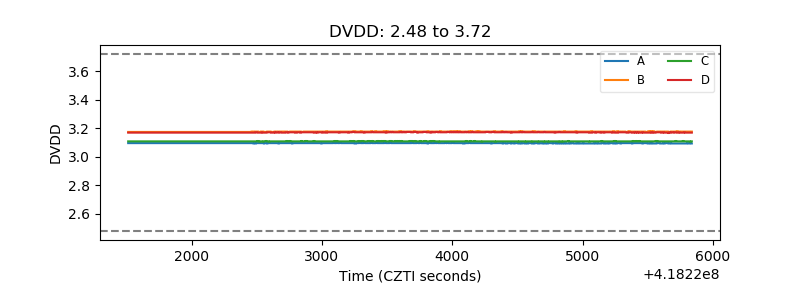 |
| Temperature 1 | 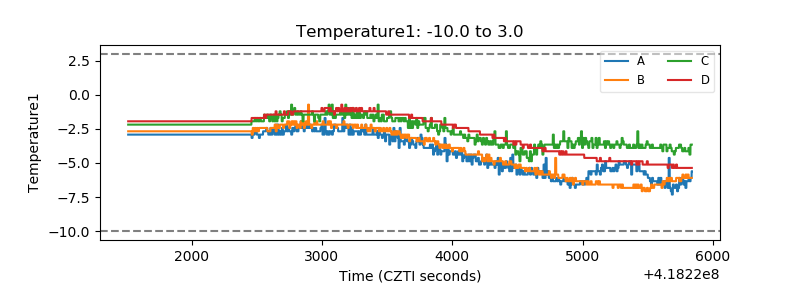 |
| Veto HV Monitor | 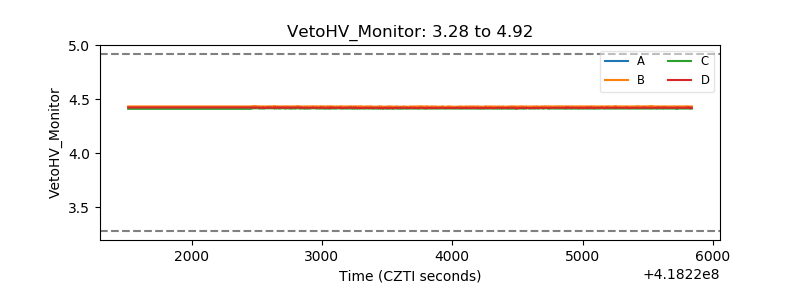 |
| Veto LLD | 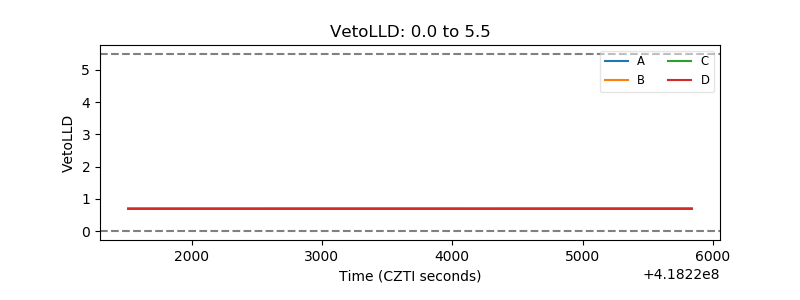 |
| Alpha Counter | 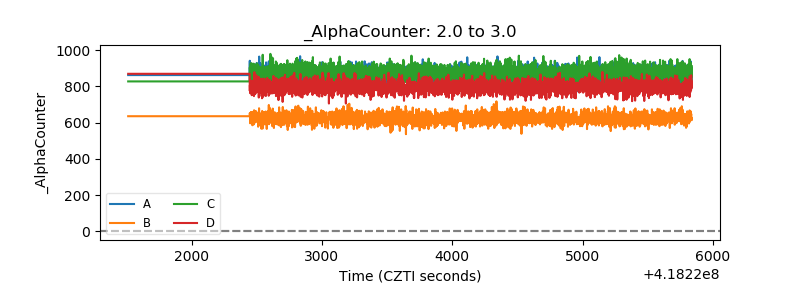 |
| _CPM_Rate | 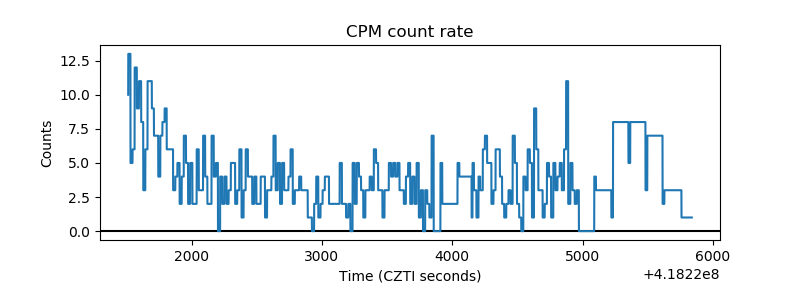 |
| CZT Counter | 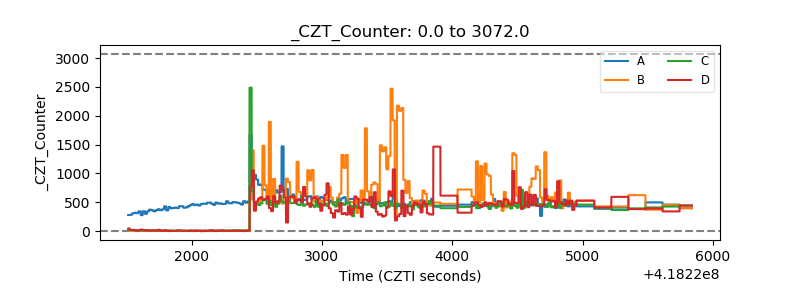 |
| +2.5 Volts monitor | 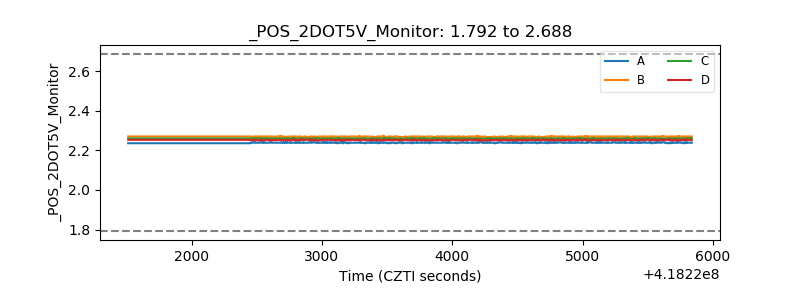 |
| +5 Volts monitor | 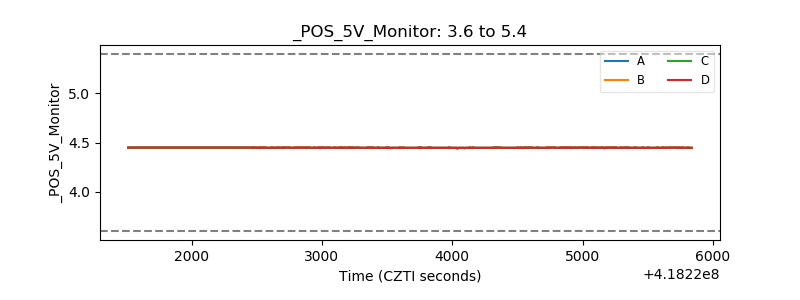 |
| _ROLL_ROT | 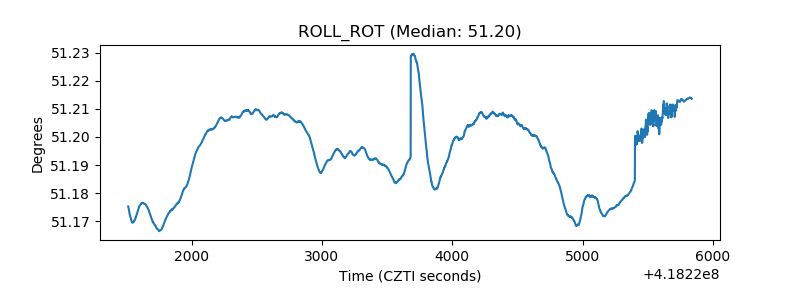 |
| _Roll_DEC | 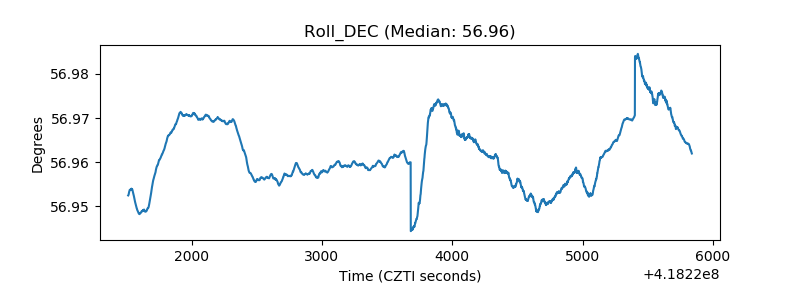 |
| _Roll_RA | 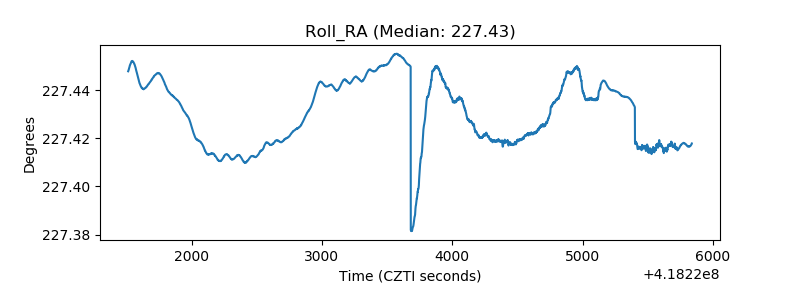 |
| Veto Counter | 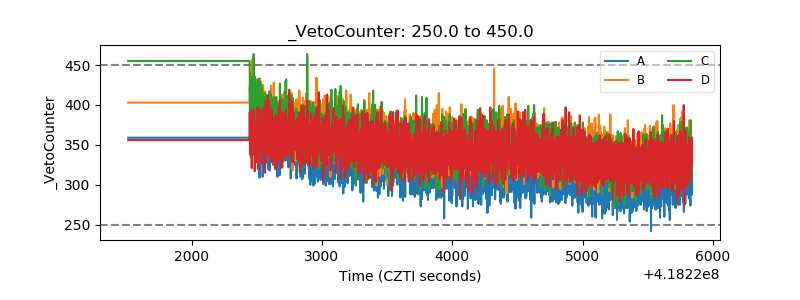 |