| Param | Original file | Final file |
|---|---|---|
| Filename | modeM0/AS1A12_012T01_9000005554_40625cztM0_level2.fits | modeM0/AS1A12_012T01_9000005554_40625cztM0_level2_quad_clean.evt |
| Size (bytes) | 133,634,880 | 34,614,720 |
| Size | 127.4 MB | 33.0 MB |
| Events in quadrant A | 1,185,115 | 236,763 |
| Events in quadrant B | 1,216,754 | 239,977 |
| Events in quadrant C | 1,040,215 | 228,931 |
| Events in quadrant D | 1,335,567 | 187,852 |
| Mode M9 | |||
|---|---|---|---|
| Quadrant | BADHDUFLAG | Total packets | Discarded packets |
| A | 0 | 14 | 0 |
| B | 0 | 14 | 0 |
| C | 0 | 14 | 0 |
| D | 0 | 14 | 0 |
| Mode SS | |||
|---|---|---|---|
| Quadrant | BADHDUFLAG | Total packets | Discarded packets |
| A | 0 | 44 | 0 |
| B | 0 | 44 | 0 |
| C | 0 | 44 | 0 |
| D | 0 | 44 | 0 |
| Mode M0 | |||
|---|---|---|---|
| Quadrant | BADHDUFLAG | Total packets | Discarded packets |
| A | 0 | 4765 | 2 |
| B | 0 | 4998 | 1 |
| C | 0 | 4394 | 1 |
| D | 0 | 5415 | 1 |
| Quadrant | Total seconds | Saturated seconds | Saturation percentage |
|---|---|---|---|
| A | 2136 | 7 | 0.327715% |
| B | 2136 | 34 | 1.591760% |
| C | 2136 | 7 | 0.327715% |
| D | 2136 | 327 | 15.308989% |
Noise dominated data is calculated using 1-second bins in cleaned event files. If a bin has >2000 counts, and if more than 50% of those come from <1% of pixels, then it is considered to be noise-dominated and hence unusable.
| Quadrant | # 1 sec bins | Bins with >0 counts | Bins with >2000 counts | High rate bins dominated by noise | Noise dominated (total time) | Noise dominated (detector-on time) | Marked lightcurve |
|---|---|---|---|---|---|---|---|
| A | 3448 | 2137 | 2 | 2 | 0.06% | 0.09% | 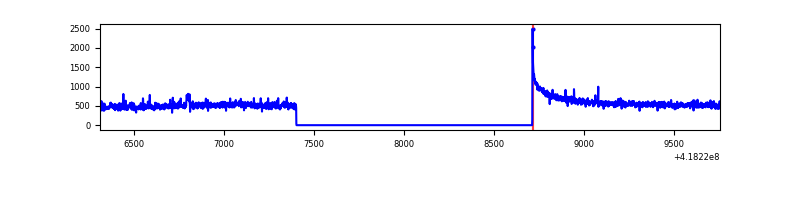 |
| B | 3447 | 2136 | 19 | 19 | 0.55% | 0.89% | 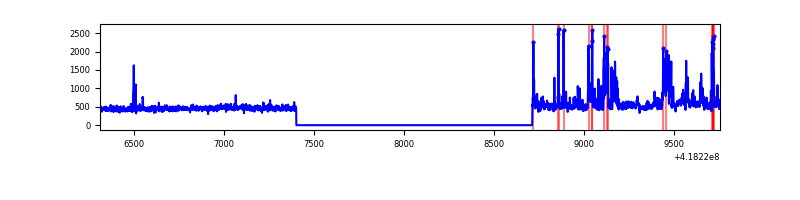 |
| C | 3448 | 2137 | 5 | 5 | 0.15% | 0.23% | 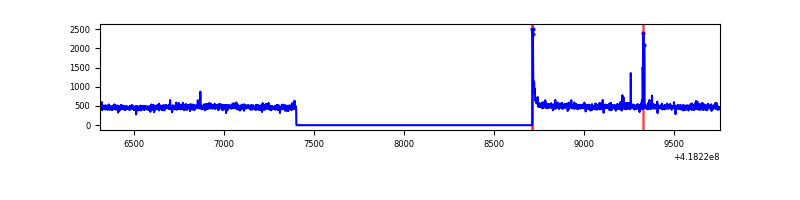 |
| D | 3447 | 2136 | 57 | 57 | 1.65% | 2.67% | 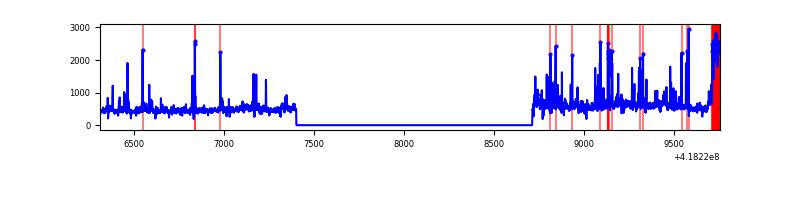 |
Top three noisy pixels from each quadrant. If the there are fewer than three noisy pixels in the level2.evt file, extra rows are filled as -1
| Pixel properties | Quadrant properties | ||||||
|---|---|---|---|---|---|---|---|
| Quadrant | DetID | PixID | Counts | Sigma | Mean | Median | Sigma |
| A | 10 | 83 | 220861 | 4288.56 | 243 | 238 | 51.4 |
| A | 2 | 79 | 14728 | 281.66 | 243 | 238 | 51.4 |
| A | 12 | 189 | 5585 | 103.94 | 243 | 238 | 51.4 |
| B | 0 | 229 | 79623 | 1651.87 | 239 | 232 | 48.1 |
| B | 5 | 255 | 66125 | 1371.02 | 239 | 232 | 48.1 |
| B | 15 | 85 | 54195 | 1122.79 | 239 | 232 | 48.1 |
| C | 15 | 214 | 94574 | 1694.33 | 232 | 233 | 55.7 |
| C | 0 | 10 | 16888 | 299.12 | 232 | 233 | 55.7 |
| C | 14 | 254 | 15866 | 280.76 | 232 | 233 | 55.7 |
| D | 12 | 227 | 130430 | 2371.16 | 218 | 211 | 54.9 |
| D | 13 | 249 | 89985 | 1634.69 | 218 | 211 | 54.9 |
| D | 12 | 191 | 82249 | 1493.83 | 218 | 211 | 54.9 |
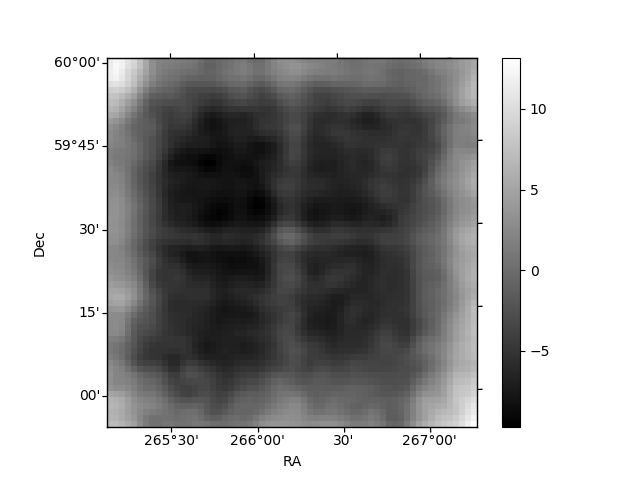
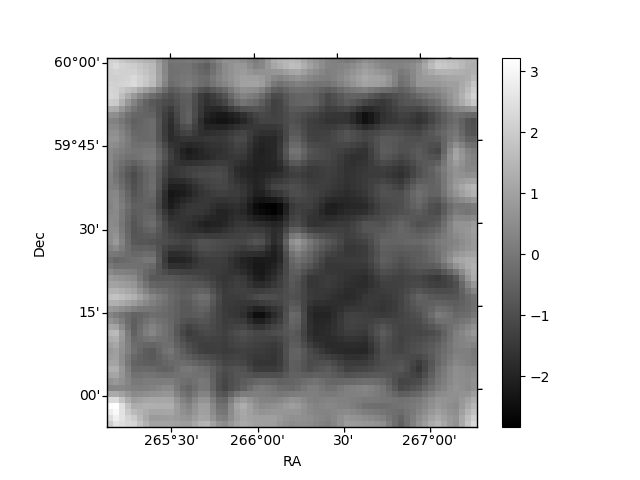
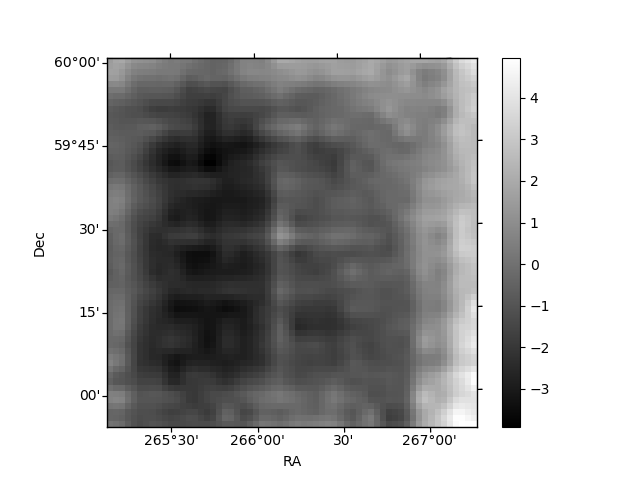
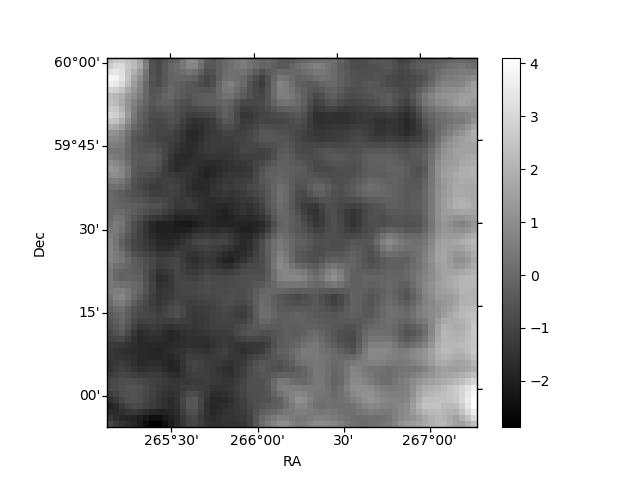
Histogram calculated using DETX and DETY for each event in the final _common_clean file
| Quadrant A | 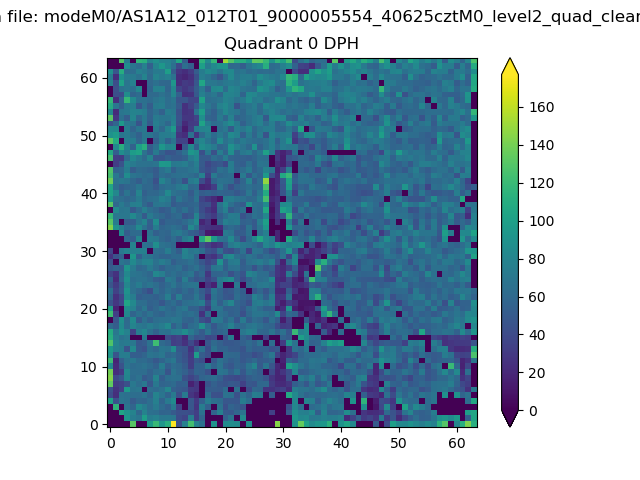 |
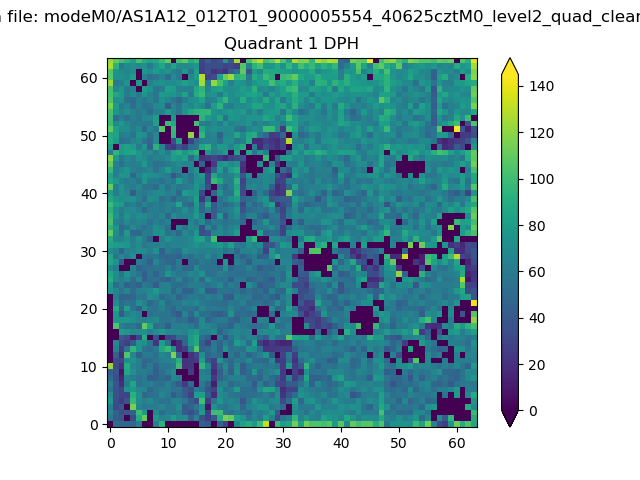 |
Quadrant B |
|---|---|---|---|
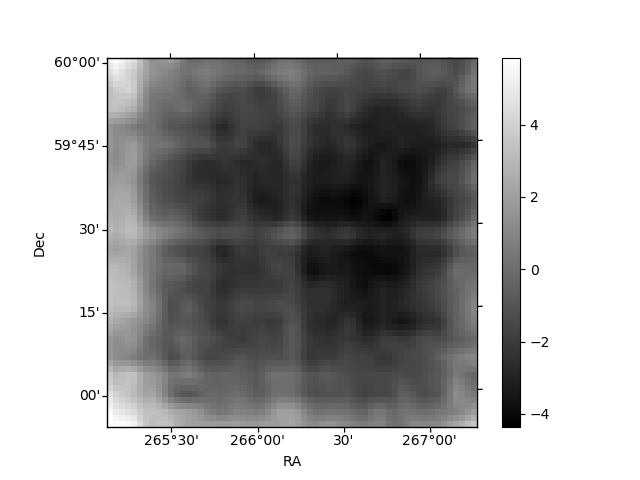
| Quadrant D | 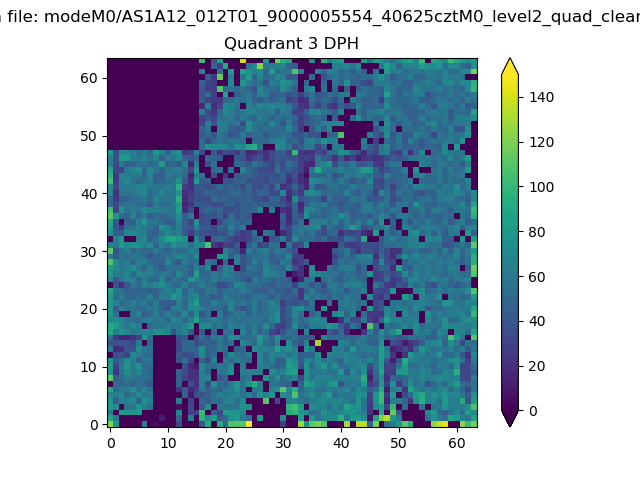 |
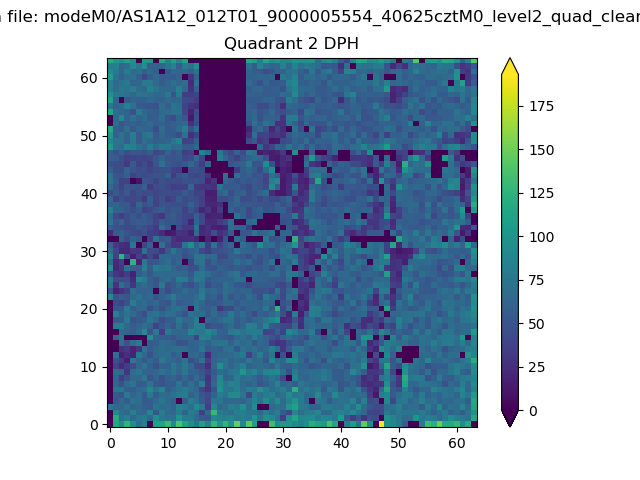 |
Quadrant C |
| Plot type | Count rate plots | Images |
|---|---|---|
| Comparison with Poisson distribution Blue bars denote a histogram of data divided into 1 sec bins. Red curve is a Poisson curve with rate = median count rate of data. |
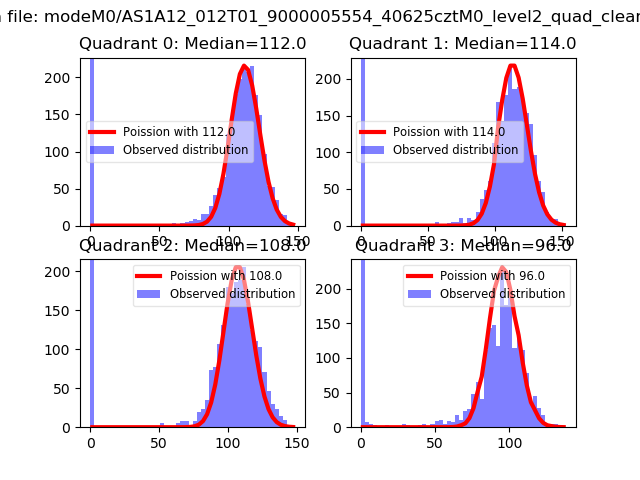 |
 |
| Quadrant-wise count rates Data is divided into 100 sec bins |
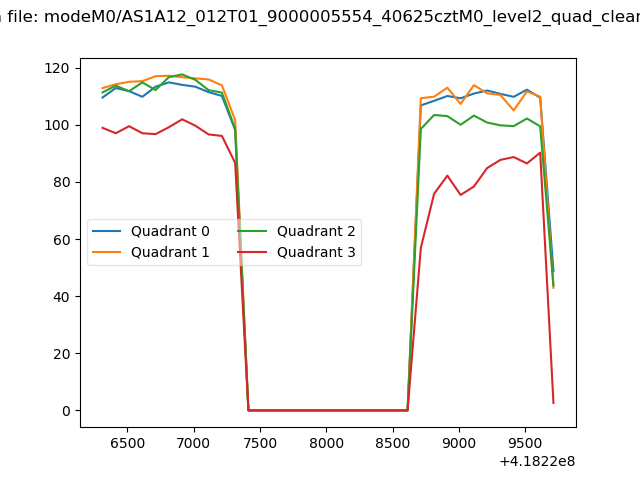 |
|
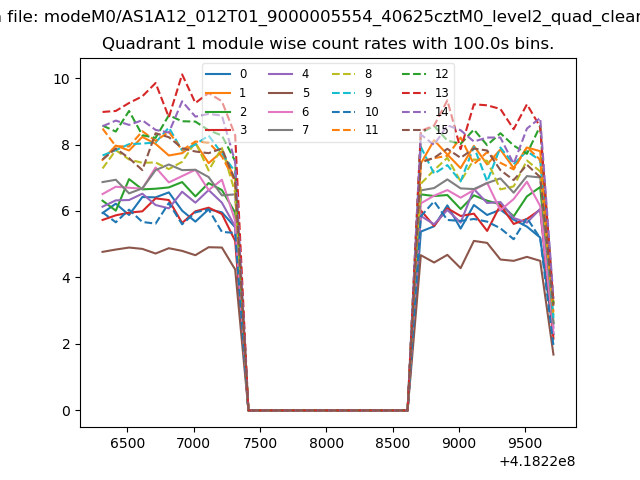
| Module-wise count rates for Quadrant A Data is divided into 100 sec bins |
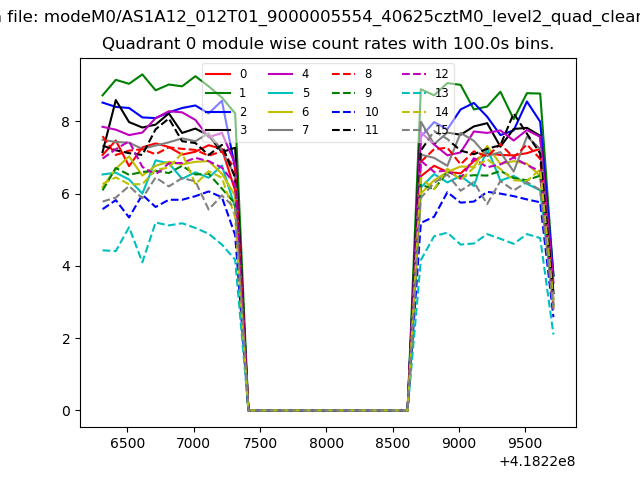 |
 |
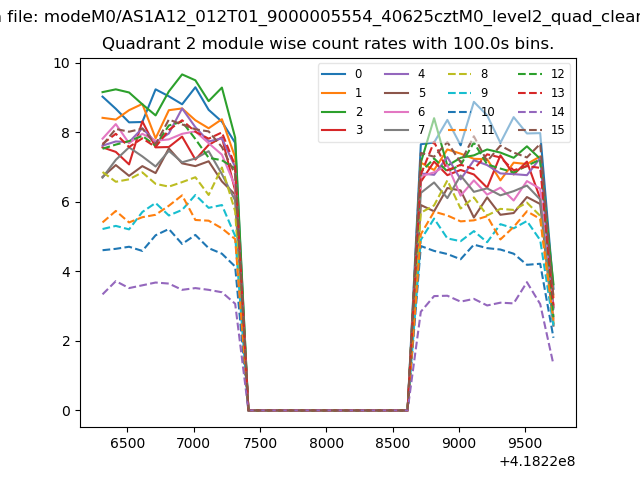
| Module-wise count rates for Quadrant B Data is divided into 100 sec bins |
 |
 |
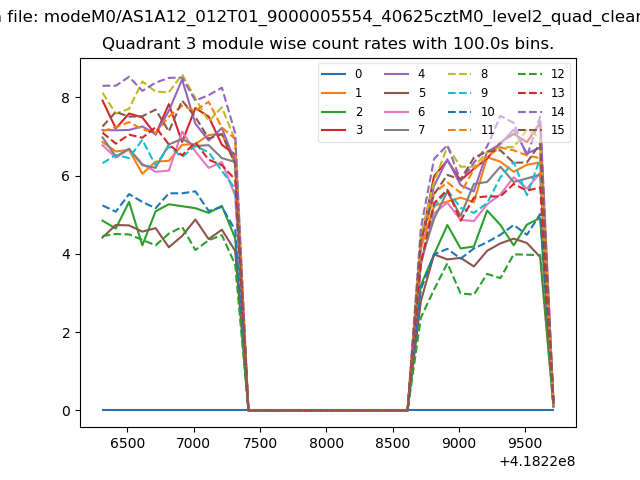
| Module-wise count rates for Quadrant C Data is divided into 100 sec bins |
 |
 |
| Module-wise count rates for Quadrant D Data is divided into 100 sec bins |
 |
 |
| Parameter | Plot |
|---|---|
| CZT HV Monitor | 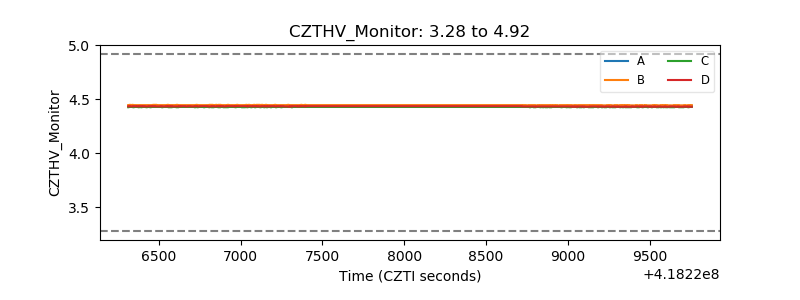 |
| D_VDD | 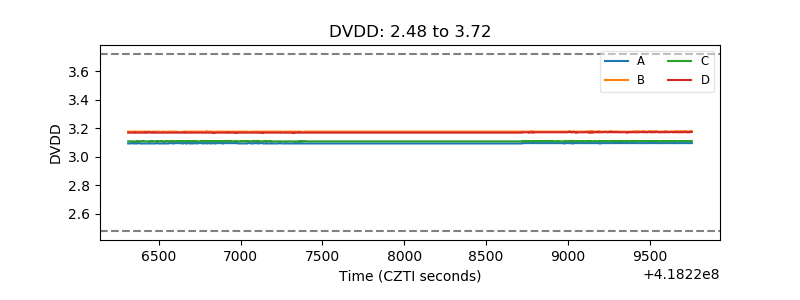 |
| Temperature 1 | 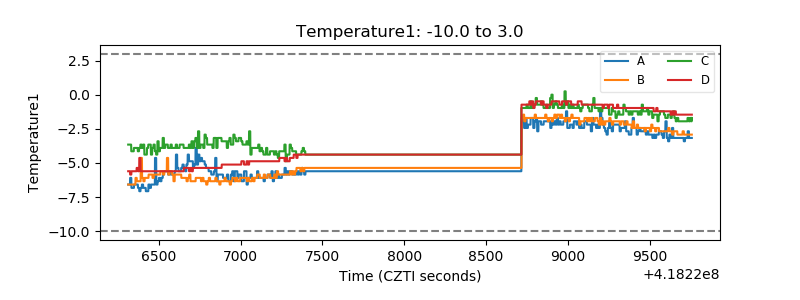 |
| Veto HV Monitor | 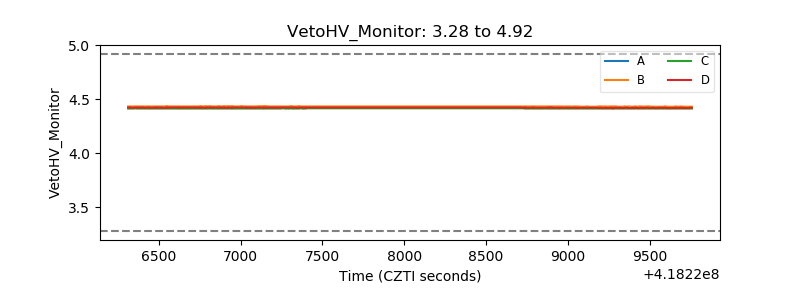 |
| Veto LLD | 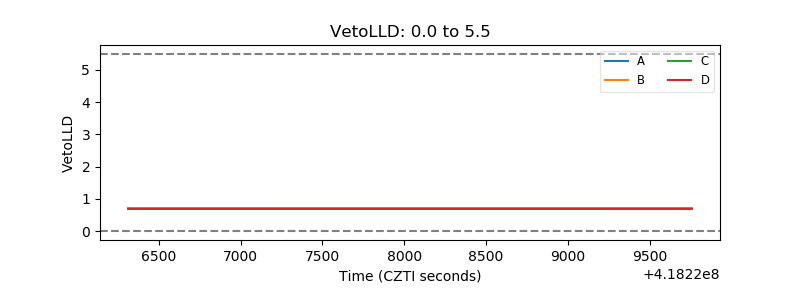 |
| Alpha Counter | 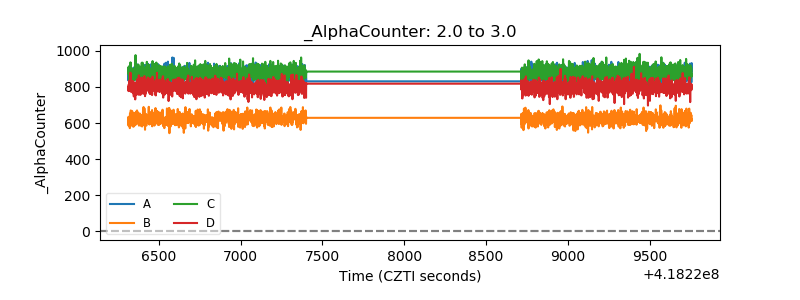 |
| _CPM_Rate | 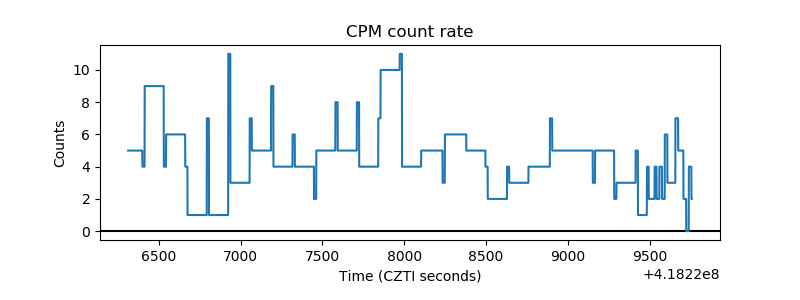 |
| CZT Counter | 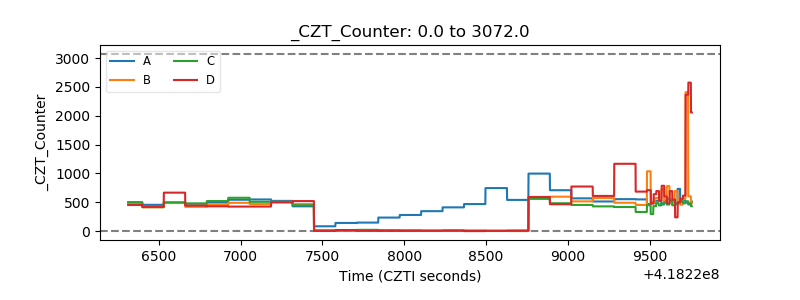 |
| +2.5 Volts monitor | 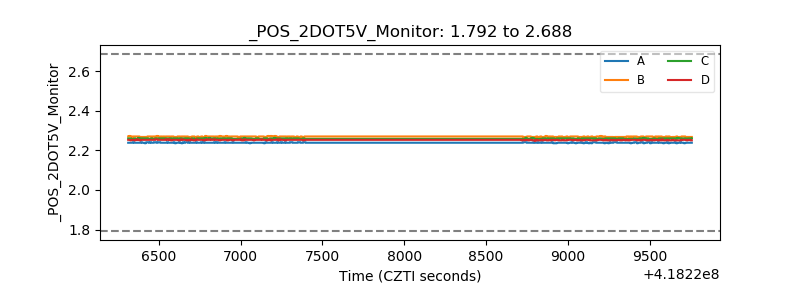 |
| +5 Volts monitor | 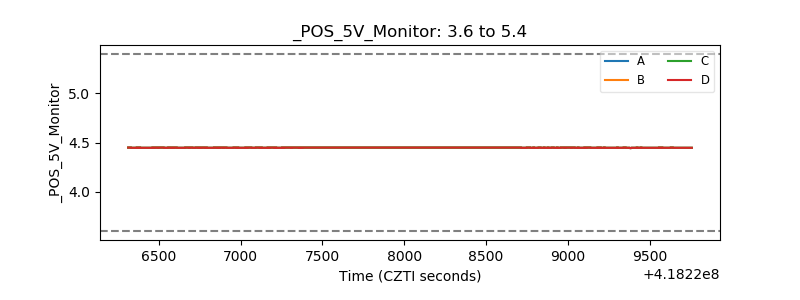 |
| _ROLL_ROT | 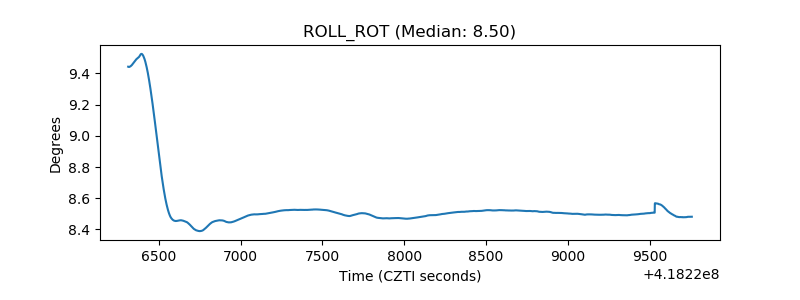 |
| _Roll_DEC | 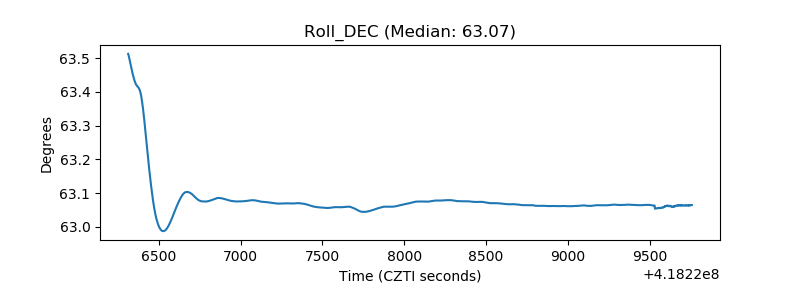 |
| _Roll_RA | 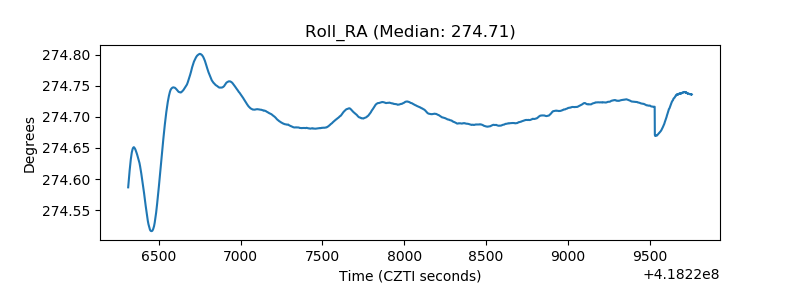 |
| Veto Counter | 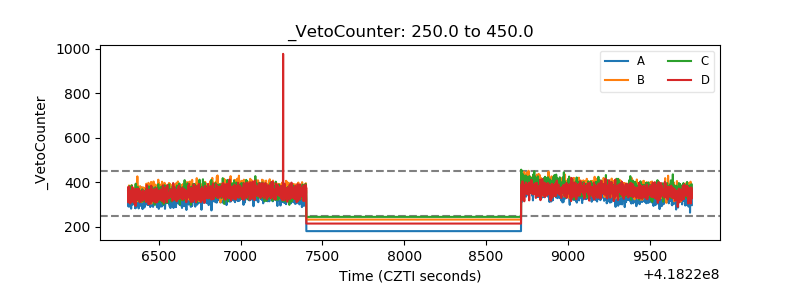 |