| Param | Original file | Final file |
|---|---|---|
| Filename | modeM0/AS1A12_012T01_9000005554_40628cztM0_level2.fits | modeM0/AS1A12_012T01_9000005554_40628cztM0_level2_quad_clean.evt |
| Size (bytes) | 770,817,600 | 185,613,120 |
| Size | 735.1 MB | 177.0 MB |
| Events in quadrant A | 6,190,423 | 1,276,105 |
| Events in quadrant B | 6,645,042 | 1,303,936 |
| Events in quadrant C | 5,860,304 | 1,265,358 |
| Events in quadrant D | 8,908,944 | 947,532 |
| Mode M9 | |||
|---|---|---|---|
| Quadrant | BADHDUFLAG | Total packets | Discarded packets |
| A | 0 | 29 | 0 |
| B | 0 | 29 | 0 |
| C | 0 | 29 | 0 |
| D | 0 | 30 | 0 |
| Mode SS | |||
|---|---|---|---|
| Quadrant | BADHDUFLAG | Total packets | Discarded packets |
| A | 0 | 242 | 0 |
| B | 0 | 242 | 0 |
| C | 0 | 242 | 0 |
| D | 0 | 242 | 0 |
| Mode M0 | |||
|---|---|---|---|
| Quadrant | BADHDUFLAG | Total packets | Discarded packets |
| A | 0 | 25805 | 3 |
| B | 0 | 27628 | 3 |
| C | 0 | 25138 | 3 |
| D | 0 | 34531 | 3 |
| Quadrant | Total seconds | Saturated seconds | Saturation percentage |
|---|---|---|---|
| A | 11952 | 40 | 0.334672% |
| B | 11952 | 141 | 1.179719% |
| C | 11952 | 80 | 0.669344% |
| D | 11952 | 2470 | 20.665997% |
Noise dominated data is calculated using 1-second bins in cleaned event files. If a bin has >2000 counts, and if more than 50% of those come from <1% of pixels, then it is considered to be noise-dominated and hence unusable.
| Quadrant | # 1 sec bins | Bins with >0 counts | Bins with >2000 counts | High rate bins dominated by noise | Noise dominated (total time) | Noise dominated (detector-on time) | Marked lightcurve |
|---|---|---|---|---|---|---|---|
| A | 14637 | 11954 | 14 | 14 | 0.10% | 0.12% | 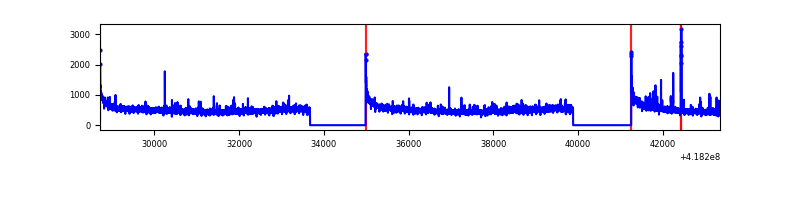 |
| B | 14637 | 11954 | 90 | 90 | 0.61% | 0.75% | 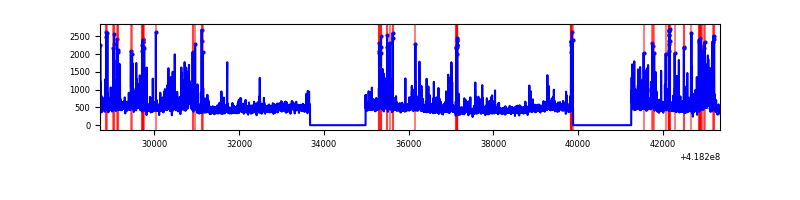 |
| C | 14637 | 11954 | 64 | 64 | 0.44% | 0.54% | 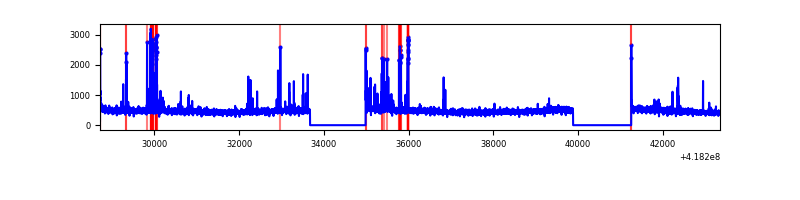 |
| D | 14637 | 11954 | 741 | 741 | 5.06% | 6.20% | 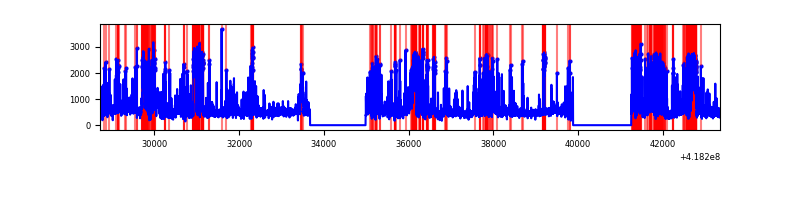 |
Top three noisy pixels from each quadrant. If the there are fewer than three noisy pixels in the level2.evt file, extra rows are filled as -1
| Pixel properties | Quadrant properties | ||||||
|---|---|---|---|---|---|---|---|
| Quadrant | DetID | PixID | Counts | Sigma | Mean | Median | Sigma |
| A | 10 | 83 | 1014930 | 3889.26 | 1284 | 1257 | 260.6 |
| A | 12 | 189 | 83325 | 314.88 | 1284 | 1257 | 260.6 |
| A | 2 | 79 | 50950 | 190.66 | 1284 | 1257 | 260.6 |
| B | 0 | 229 | 589460 | 2371.19 | 1282 | 1242 | 248.1 |
| B | 0 | 190 | 318626 | 1279.42 | 1282 | 1242 | 248.1 |
| B | 5 | 255 | 180899 | 724.22 | 1282 | 1242 | 248.1 |
| C | 15 | 214 | 511511 | 1722.78 | 1265 | 1273 | 296.2 |
| C | 14 | 254 | 330920 | 1113.03 | 1265 | 1273 | 296.2 |
| C | 0 | 10 | 42096 | 137.83 | 1265 | 1273 | 296.2 |
| D | 12 | 227 | 1237443 | 4425.52 | 1132 | 1102 | 279.4 |
| D | 13 | 249 | 682025 | 2437.39 | 1132 | 1102 | 279.4 |
| D | 5 | 32 | 582175 | 2079.97 | 1132 | 1102 | 279.4 |
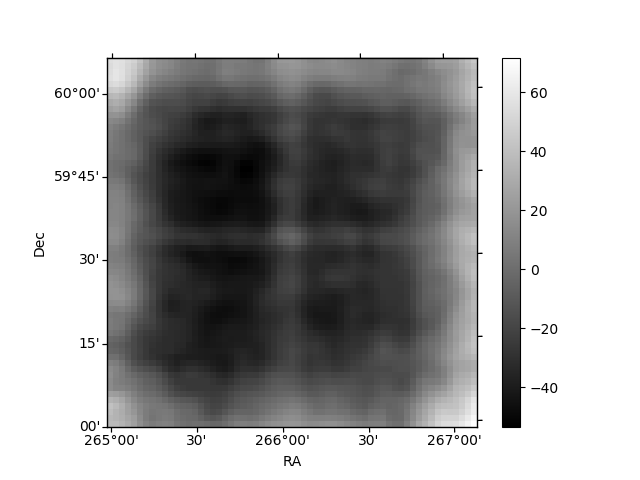
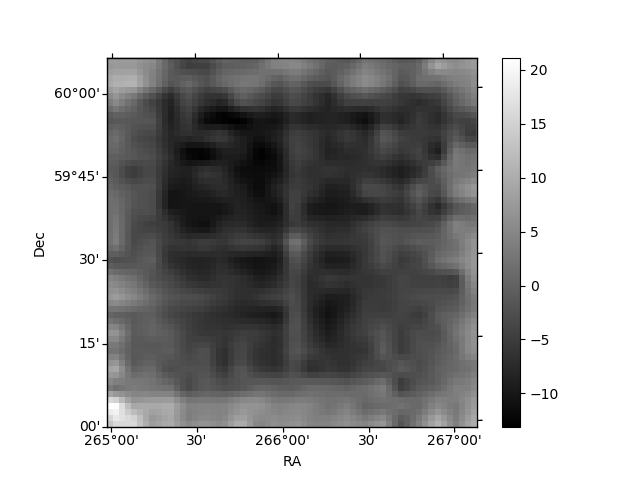
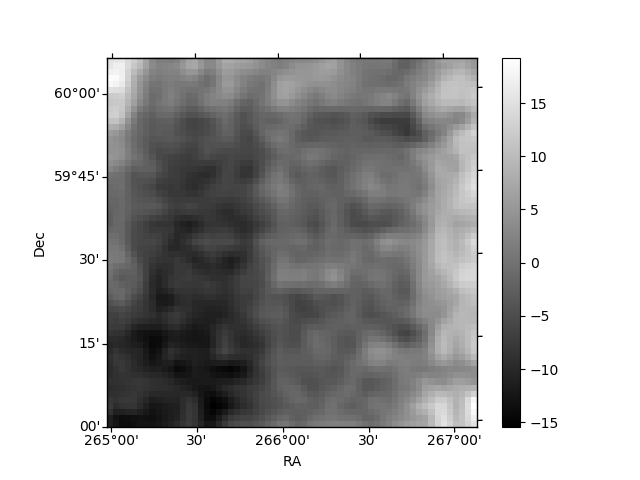
Histogram calculated using DETX and DETY for each event in the final _common_clean file
| Quadrant A | 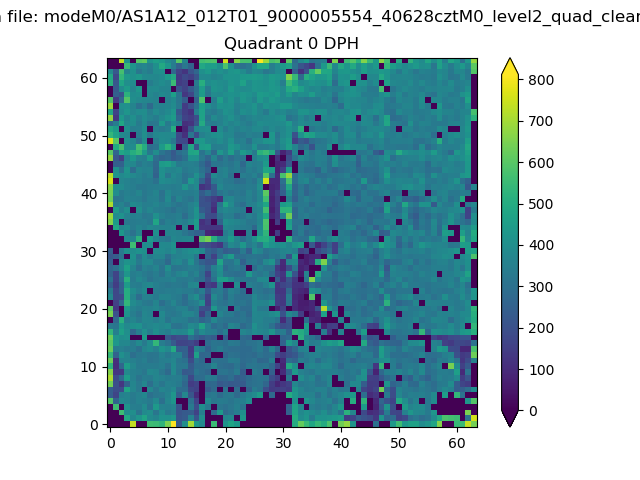 |
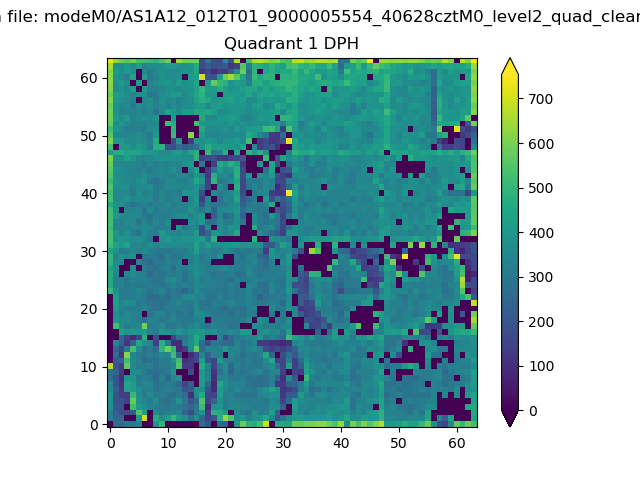 |
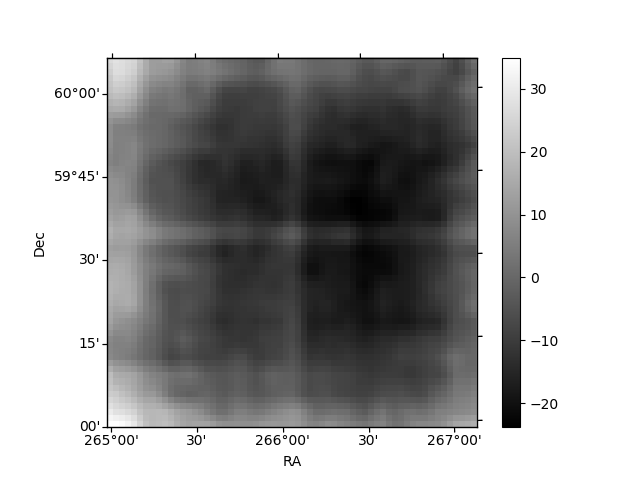
Quadrant B |
|---|---|---|---|
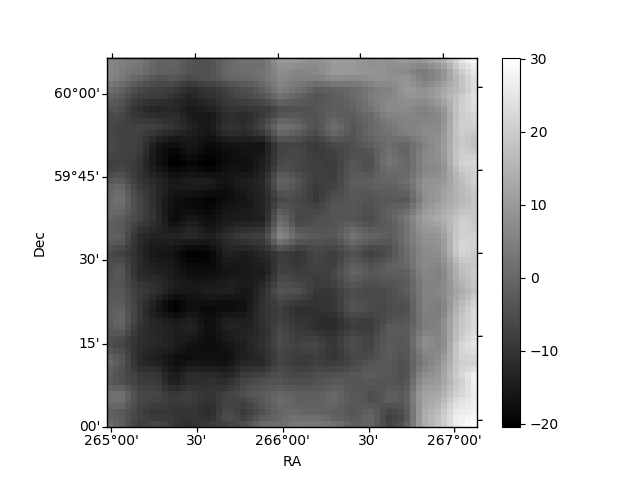
| Quadrant D | 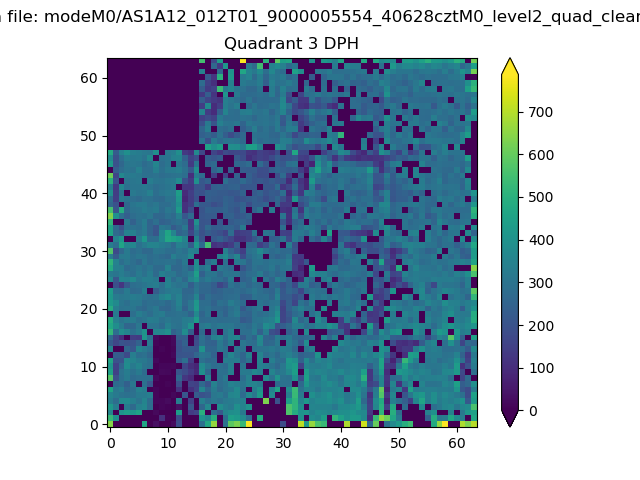 |
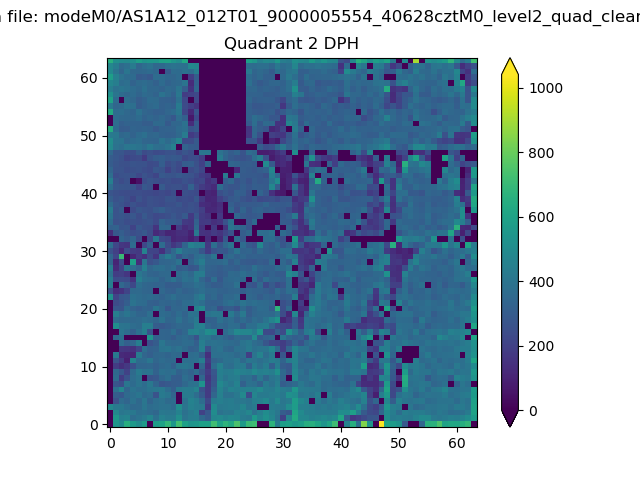 |
Quadrant C |
| Plot type | Count rate plots | Images |
|---|---|---|
| Comparison with Poisson distribution Blue bars denote a histogram of data divided into 1 sec bins. Red curve is a Poisson curve with rate = median count rate of data. |
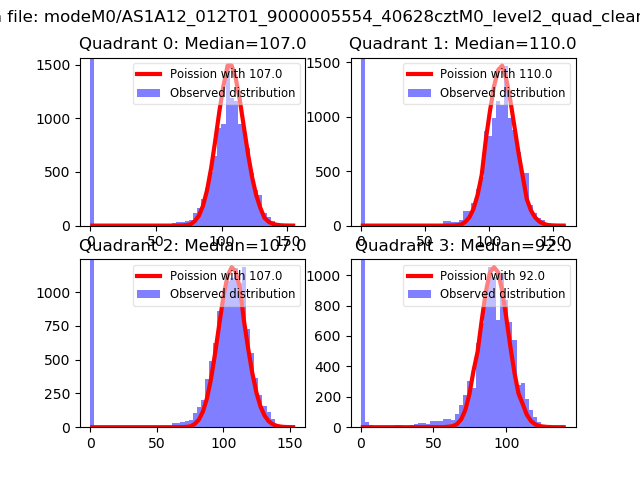 |
 |
| Quadrant-wise count rates Data is divided into 100 sec bins |
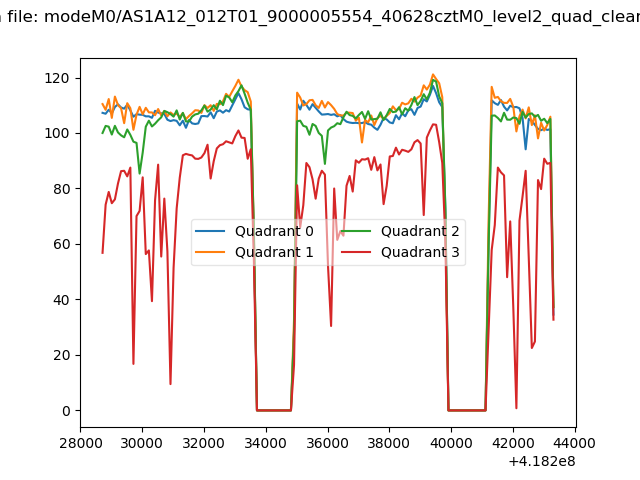 |
|
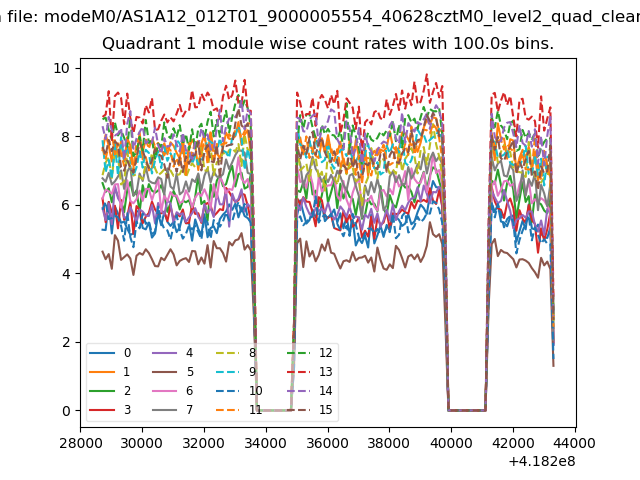
| Module-wise count rates for Quadrant A Data is divided into 100 sec bins |
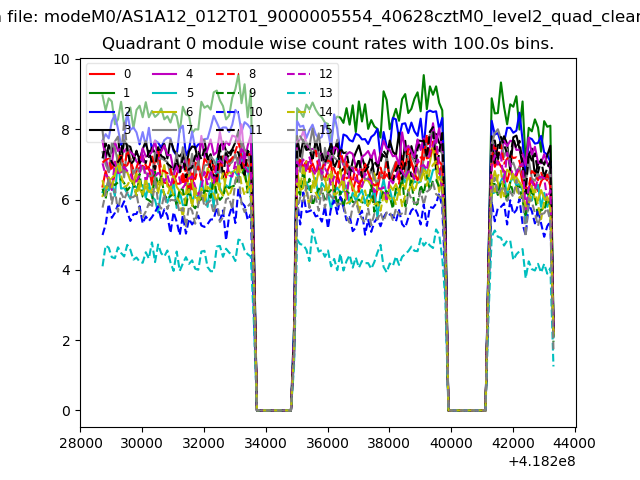 |
 |
| Module-wise count rates for Quadrant B Data is divided into 100 sec bins |
 |
 |
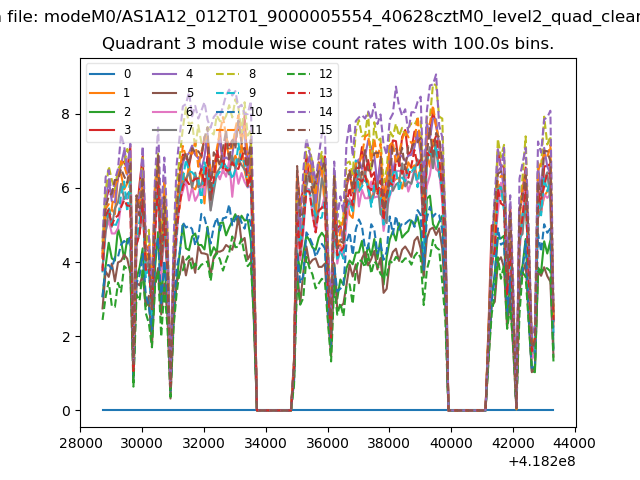
| Module-wise count rates for Quadrant C Data is divided into 100 sec bins |
 |
 |
| Module-wise count rates for Quadrant D Data is divided into 100 sec bins |
 |
 |
| Parameter | Plot |
|---|---|
| CZT HV Monitor | 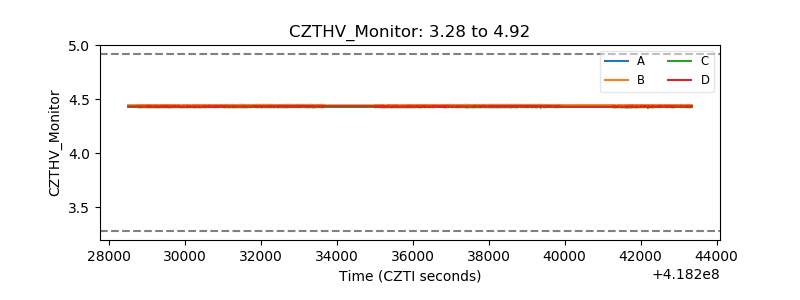 |
| D_VDD | 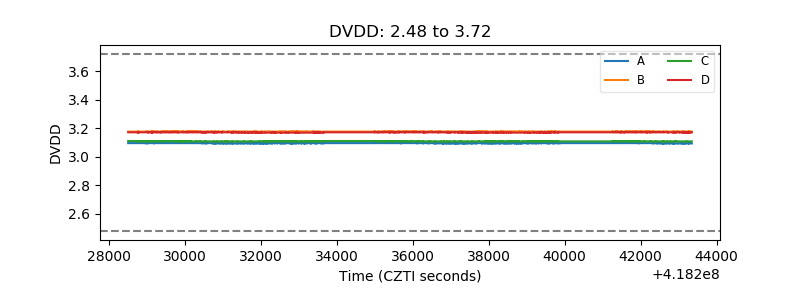 |
| Temperature 1 | 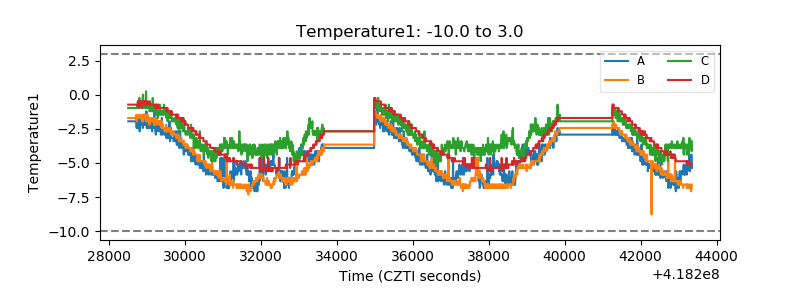 |
| Veto HV Monitor | 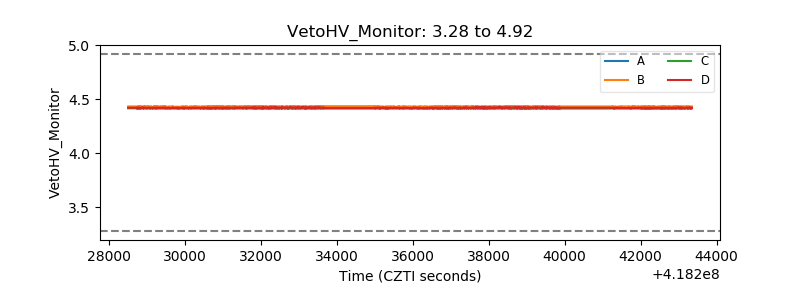 |
| Veto LLD | 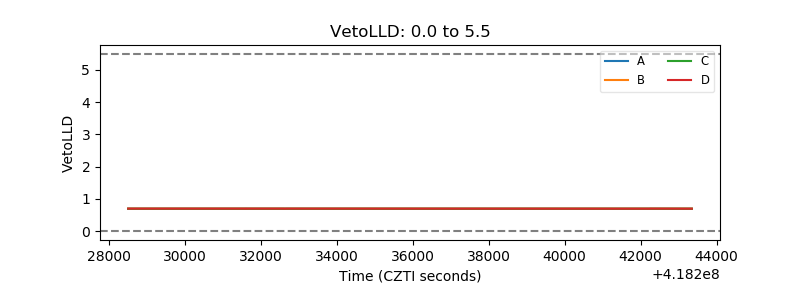 |
| Alpha Counter | 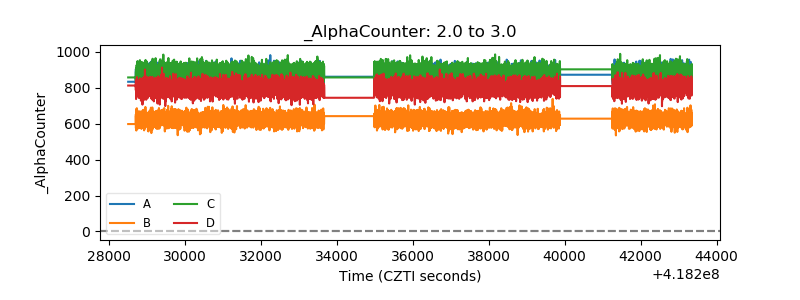 |
| _CPM_Rate | 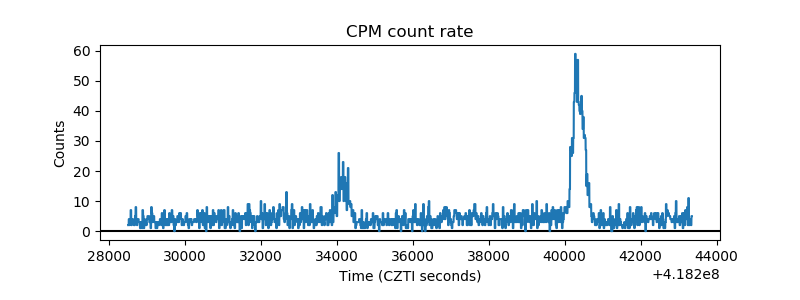 |
| CZT Counter | 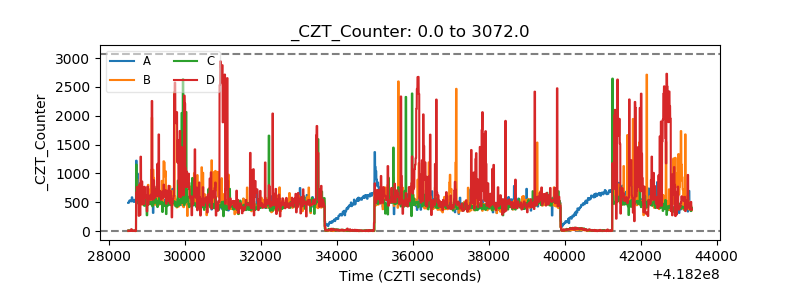 |
| +2.5 Volts monitor | 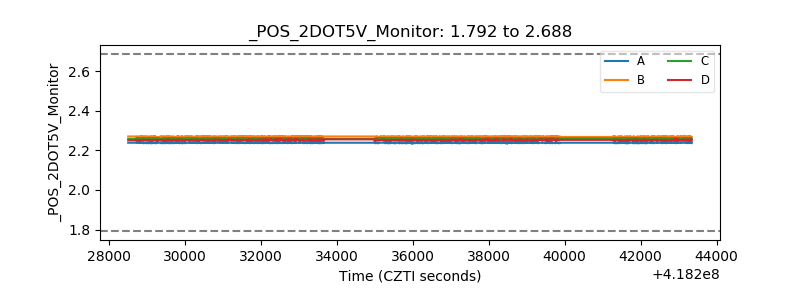 |
| +5 Volts monitor | 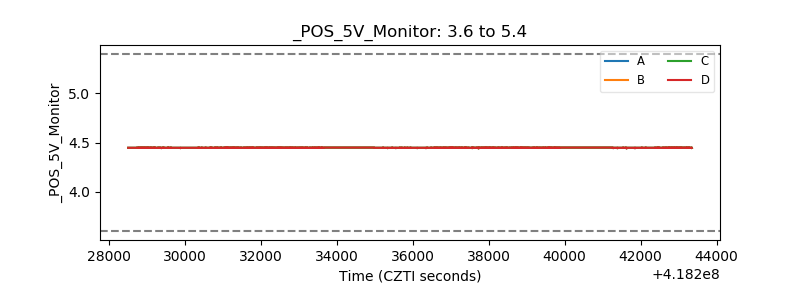 |
| _ROLL_ROT | 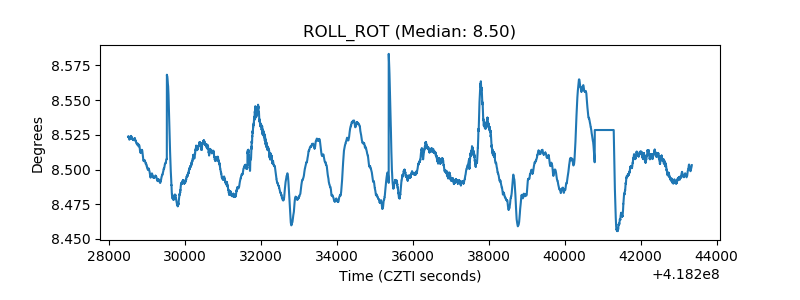 |
| _Roll_DEC | 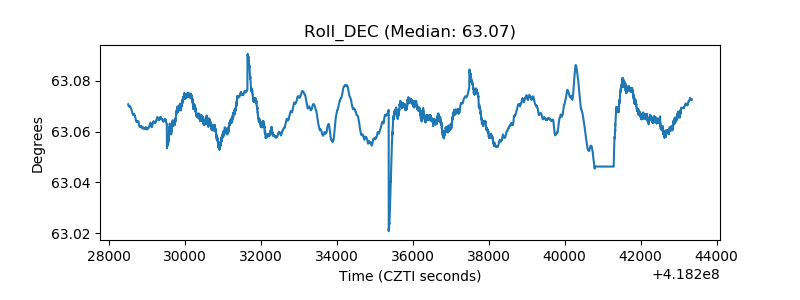 |
| _Roll_RA | 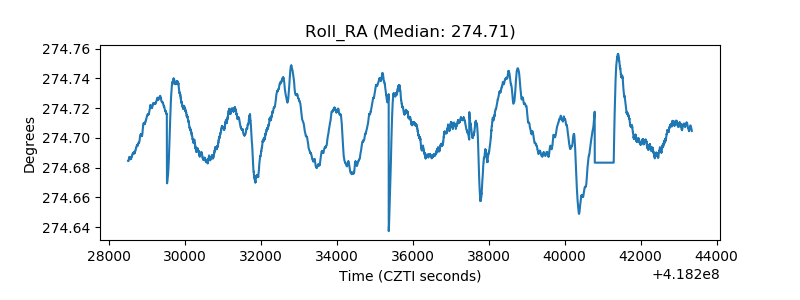 |
| Veto Counter | 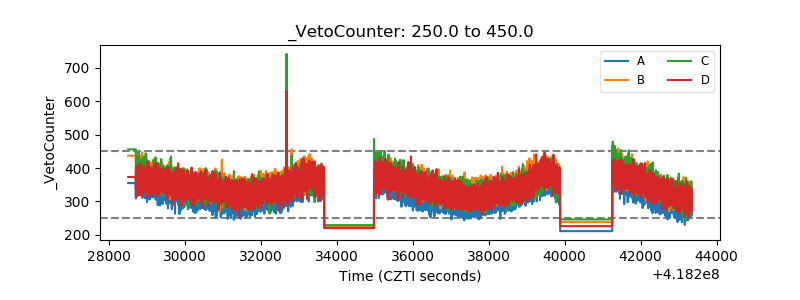 |