| Param | Original file | Final file |
|---|---|---|
| Filename | modeM0/AS1A12_029T01_9000005556_40628cztM0_level2.fits | modeM0/AS1A12_029T01_9000005556_40628cztM0_level2_quad_clean.evt |
| Size (bytes) | 194,656,320 | 49,792,320 |
| Size | 185.6 MB | 47.5 MB |
| Events in quadrant A | 1,612,659 | 335,325 |
| Events in quadrant B | 1,767,730 | 342,065 |
| Events in quadrant C | 1,453,757 | 331,813 |
| Events in quadrant D | 2,134,208 | 282,766 |
| Mode M0 | |||
|---|---|---|---|
| Quadrant | BADHDUFLAG | Total packets | Discarded packets |
| A | 0 | 6573 | 2 |
| B | 0 | 7256 | 1 |
| C | 0 | 6135 | 1 |
| D | 0 | 8382 | 1 |
| Mode M9 | |||
|---|---|---|---|
| Quadrant | BADHDUFLAG | Total packets | Discarded packets |
| A | 0 | 14 | 0 |
| B | 0 | 14 | 0 |
| C | 0 | 14 | 0 |
| D | 0 | 14 | 0 |
| Mode SS | |||
|---|---|---|---|
| Quadrant | BADHDUFLAG | Total packets | Discarded packets |
| A | 0 | 64 | 0 |
| B | 0 | 64 | 0 |
| C | 0 | 64 | 0 |
| D | 0 | 64 | 0 |
| Quadrant | Total seconds | Saturated seconds | Saturation percentage |
|---|---|---|---|
| A | 3023 | 8 | 0.264638% |
| B | 3023 | 54 | 1.786305% |
| C | 3023 | 2 | 0.066159% |
| D | 3023 | 248 | 8.203771% |
Noise dominated data is calculated using 1-second bins in cleaned event files. If a bin has >2000 counts, and if more than 50% of those come from <1% of pixels, then it is considered to be noise-dominated and hence unusable.
| Quadrant | # 1 sec bins | Bins with >0 counts | Bins with >2000 counts | High rate bins dominated by noise | Noise dominated (total time) | Noise dominated (detector-on time) | Marked lightcurve |
|---|---|---|---|---|---|---|---|
| A | 4485 | 3024 | 3 | 3 | 0.07% | 0.10% | 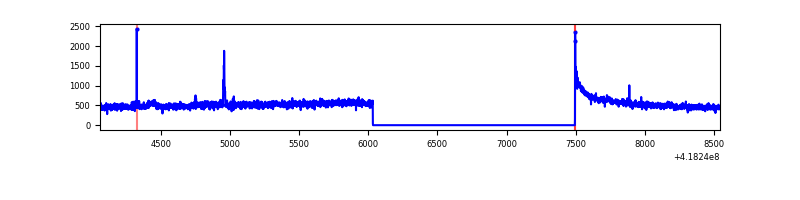 |
| B | 4485 | 3024 | 11 | 11 | 0.25% | 0.36% | 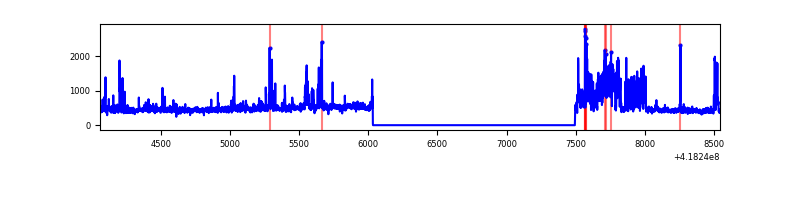 |
| C | 4485 | 3024 | 0 | 0 | 0.00% | 0.00% | 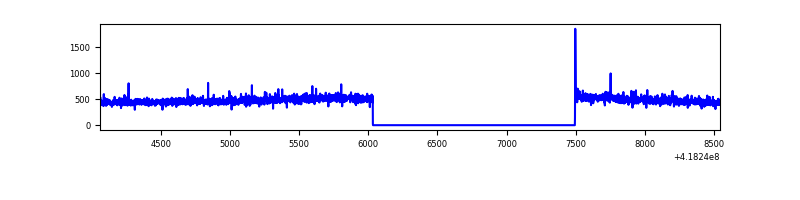 |
| D | 4485 | 3024 | 53 | 53 | 1.18% | 1.75% | 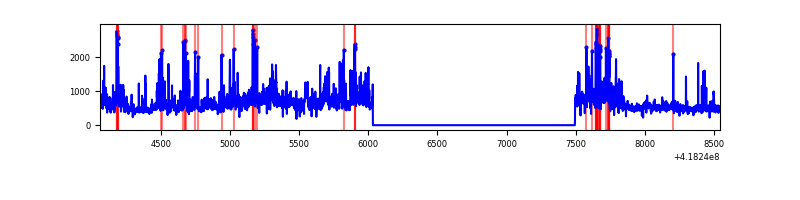 |
Top three noisy pixels from each quadrant. If the there are fewer than three noisy pixels in the level2.evt file, extra rows are filled as -1
| Pixel properties | Quadrant properties | ||||||
|---|---|---|---|---|---|---|---|
| Quadrant | DetID | PixID | Counts | Sigma | Mean | Median | Sigma |
| A | 10 | 83 | 247372 | 3396.48 | 344 | 337 | 72.7 |
| A | 12 | 189 | 16849 | 227.02 | 344 | 337 | 72.7 |
| A | 15 | 223 | 11412 | 152.27 | 344 | 337 | 72.7 |
| B | 4 | 171 | 296862 | 4385.0 | 340 | 330 | 67.6 |
| B | 0 | 229 | 64376 | 947.09 | 340 | 330 | 67.6 |
| B | 0 | 190 | 45981 | 675.07 | 340 | 330 | 67.6 |
| C | 15 | 214 | 131217 | 1650.55 | 335 | 337 | 79.3 |
| C | 0 | 10 | 6129 | 73.04 | 335 | 337 | 79.3 |
| C | 14 | 254 | 5842 | 69.42 | 335 | 337 | 79.3 |
| D | 12 | 227 | 639146 | 7893.77 | 321 | 311 | 80.9 |
| D | 2 | 250 | 138625 | 1709.08 | 321 | 311 | 80.9 |
| D | 12 | 191 | 83815 | 1031.82 | 321 | 311 | 80.9 |
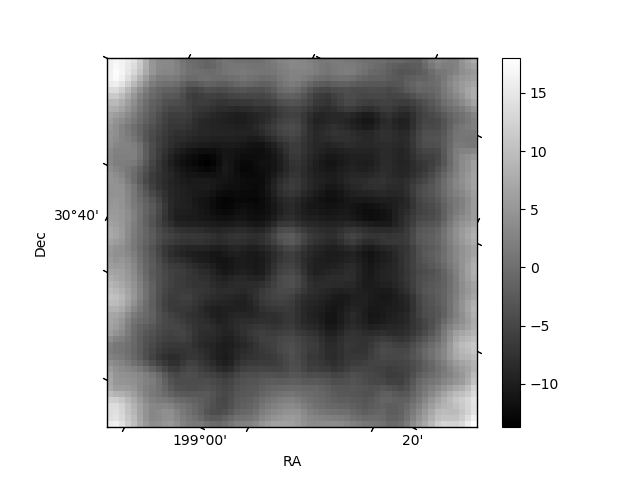
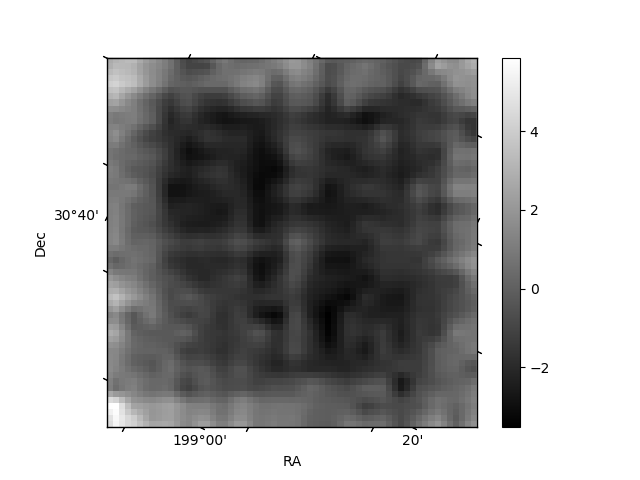
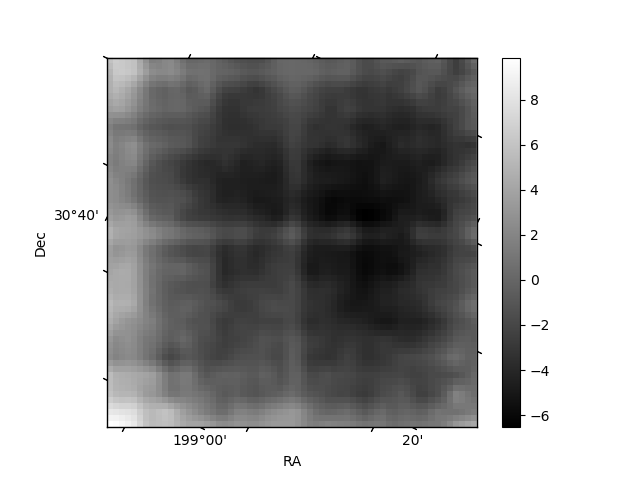
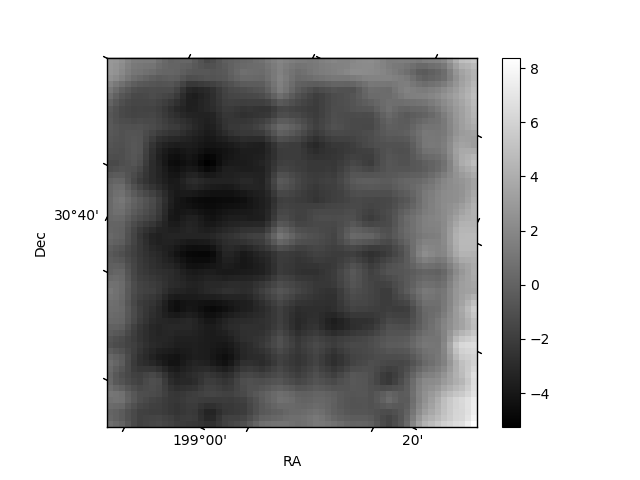
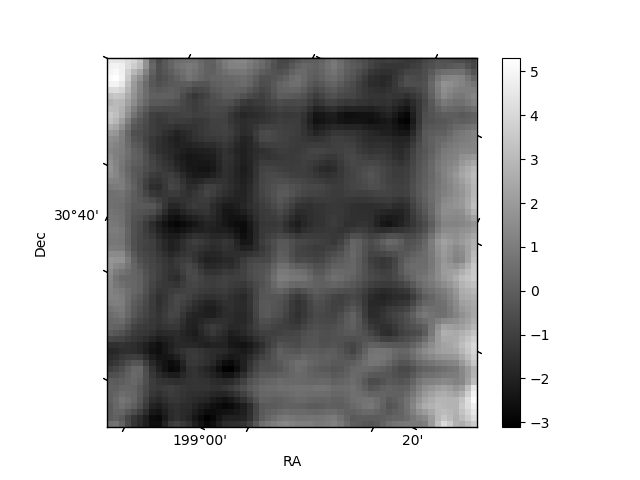
Histogram calculated using DETX and DETY for each event in the final _common_clean file
| Quadrant A | 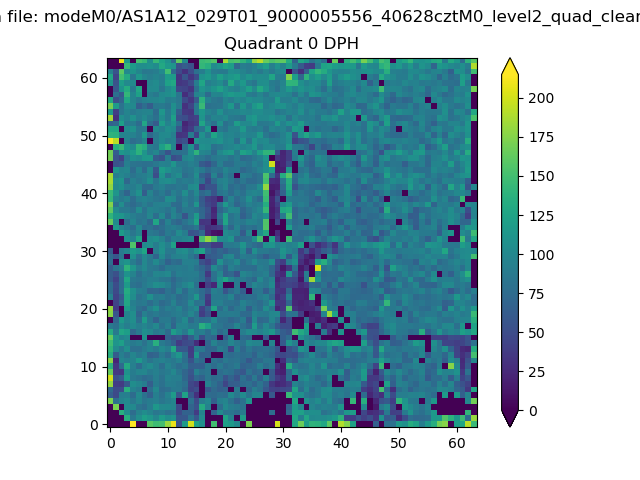 |
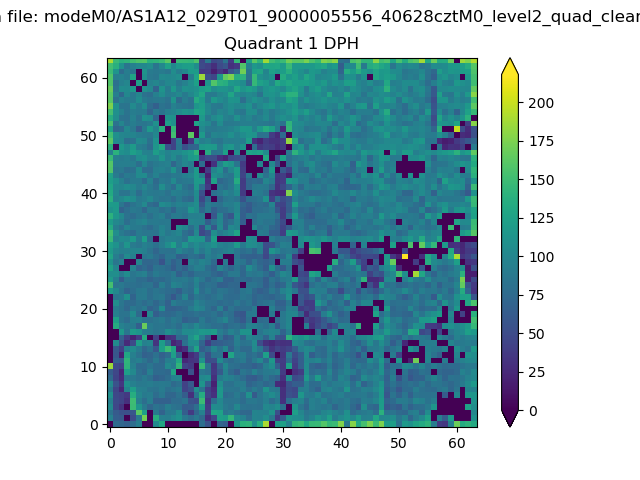 |
Quadrant B |
|---|---|---|---|
| Quadrant D | 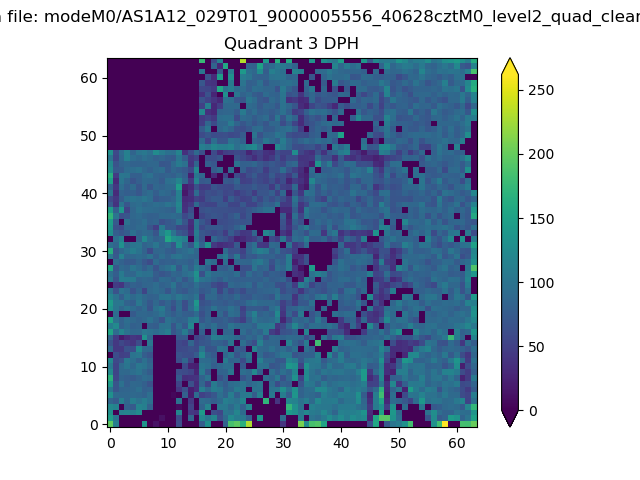 |
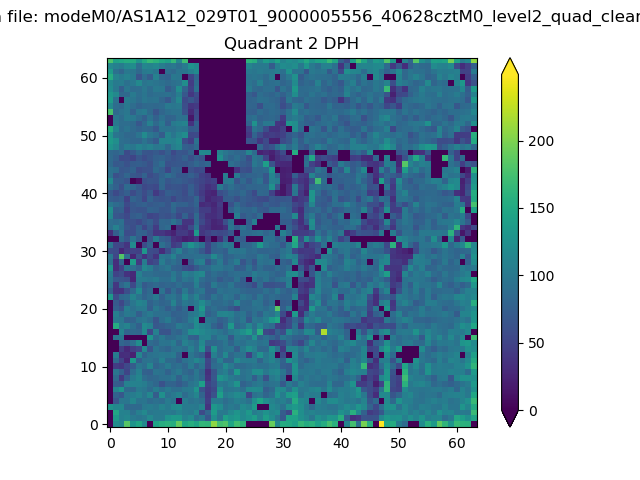 |
Quadrant C |
| Plot type | Count rate plots | Images |
|---|---|---|
| Comparison with Poisson distribution Blue bars denote a histogram of data divided into 1 sec bins. Red curve is a Poisson curve with rate = median count rate of data. |
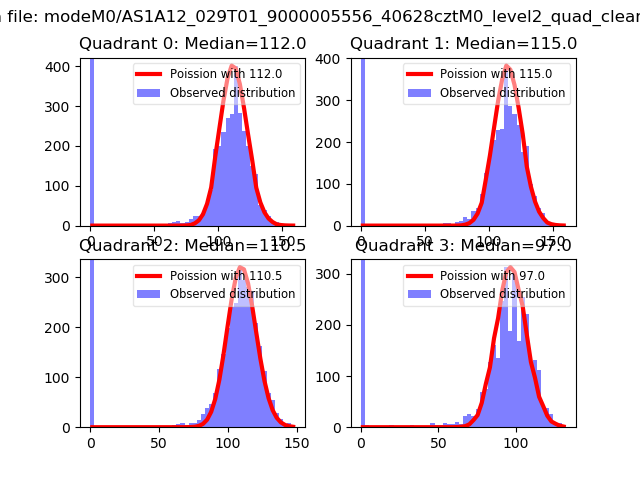 |
 |
| Quadrant-wise count rates Data is divided into 100 sec bins |
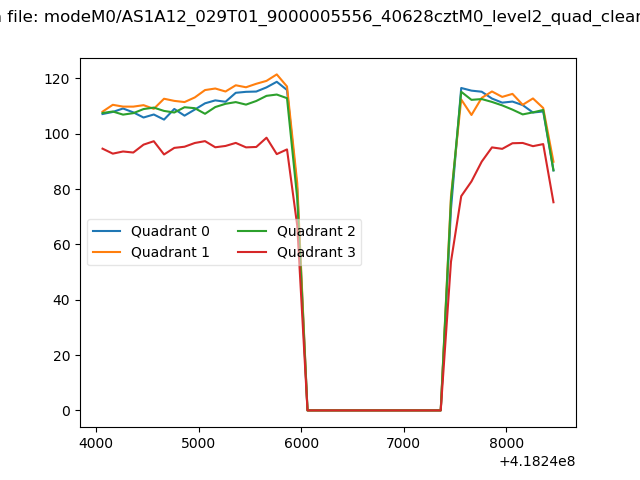 |
|
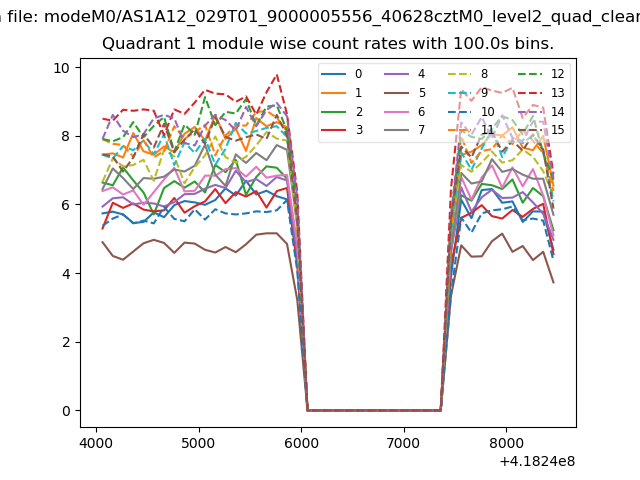
| Module-wise count rates for Quadrant A Data is divided into 100 sec bins |
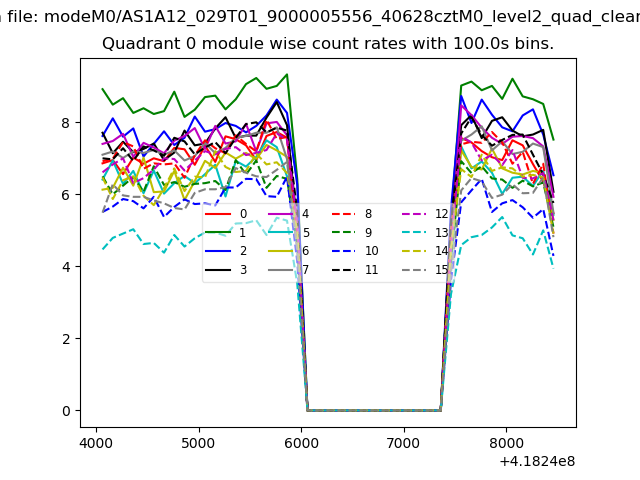 |
 |
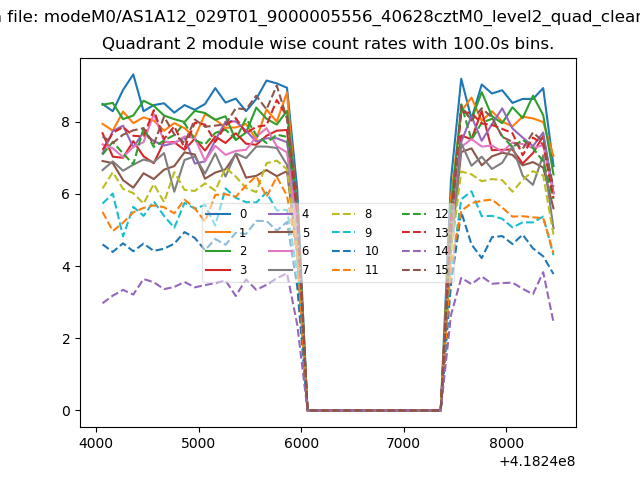
| Module-wise count rates for Quadrant B Data is divided into 100 sec bins |
 |
 |
| Module-wise count rates for Quadrant C Data is divided into 100 sec bins |
 |
 |
| Module-wise count rates for Quadrant D Data is divided into 100 sec bins |
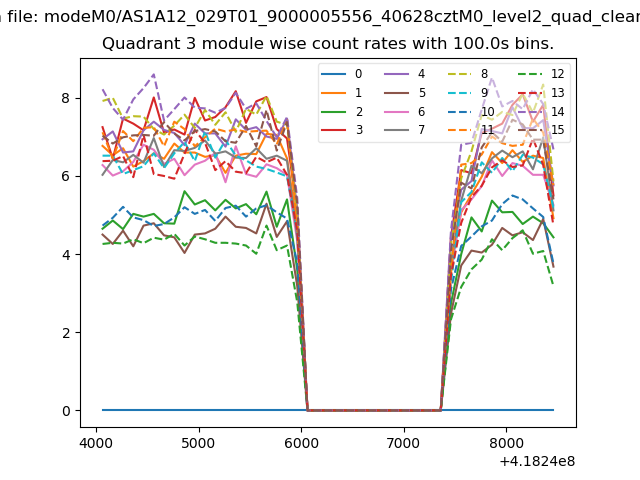 |
 |
| Parameter | Plot |
|---|---|
| CZT HV Monitor | 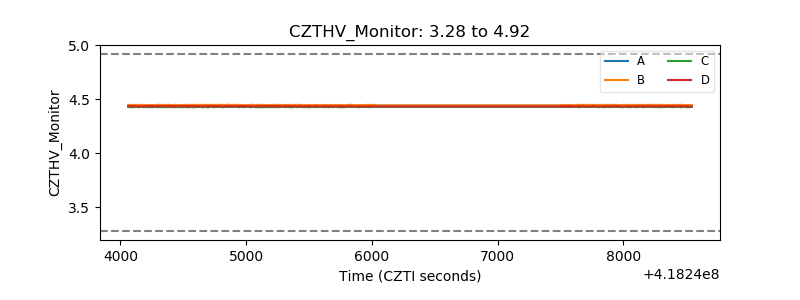 |
| D_VDD | 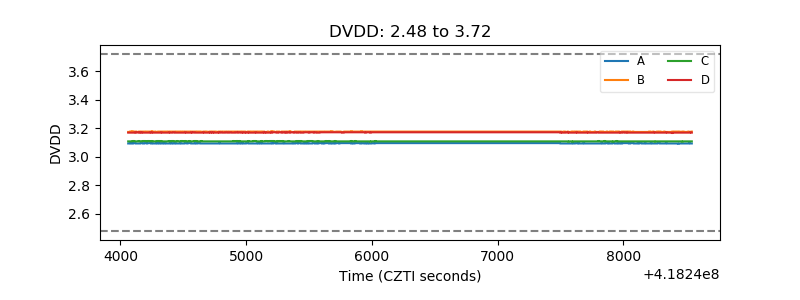 |
| Temperature 1 | 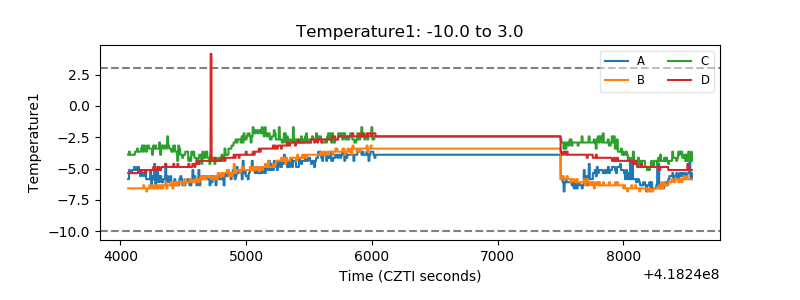 |
| Veto HV Monitor | 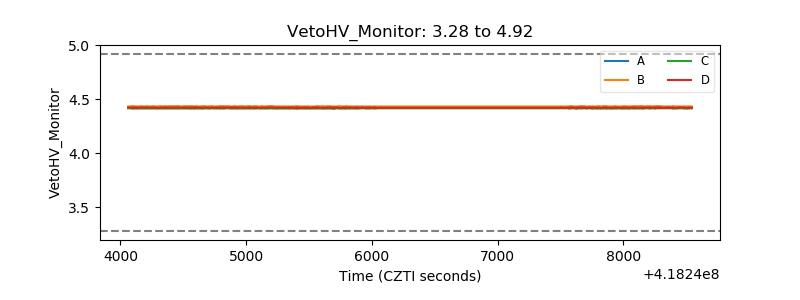 |
| Veto LLD | 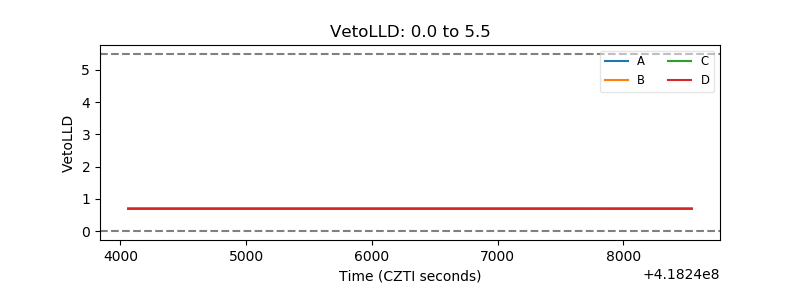 |
| Alpha Counter | 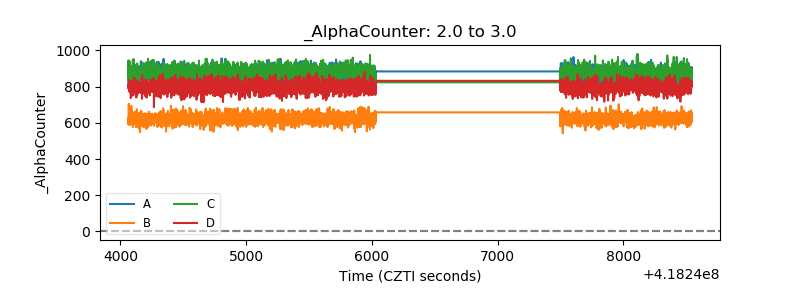 |
| _CPM_Rate | 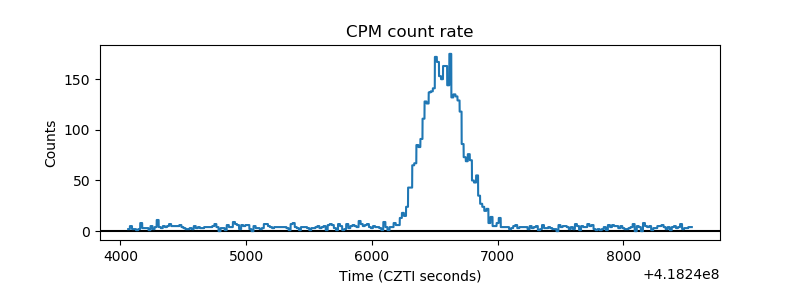 |
| CZT Counter | 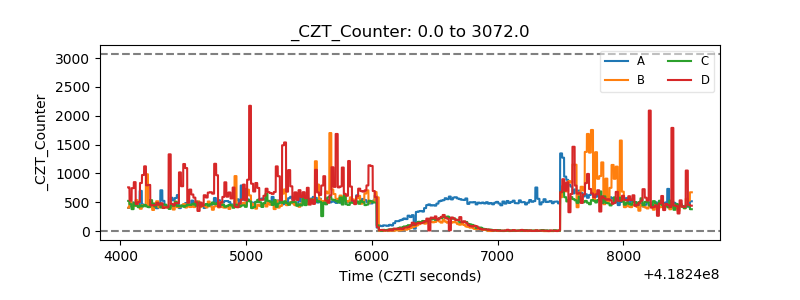 |
| +2.5 Volts monitor | 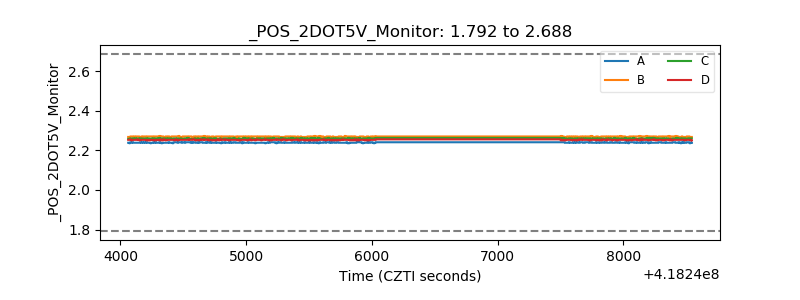 |
| +5 Volts monitor | 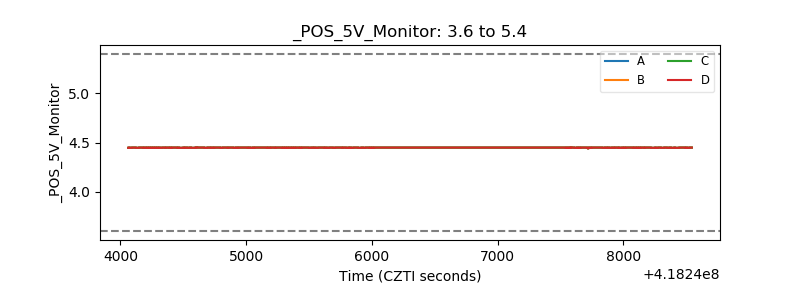 |
| _ROLL_ROT | 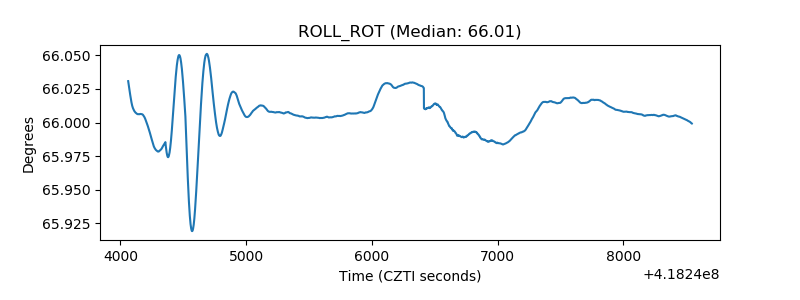 |
| _Roll_DEC | 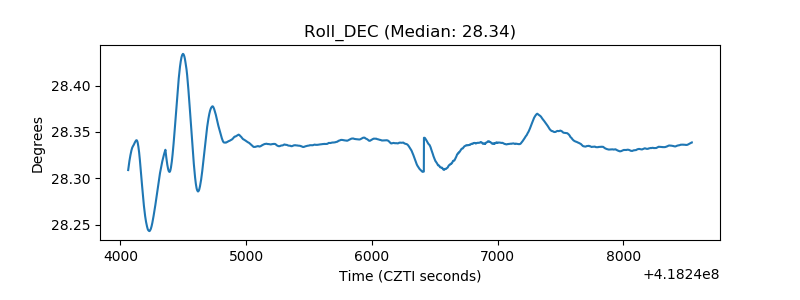 |
| _Roll_RA | 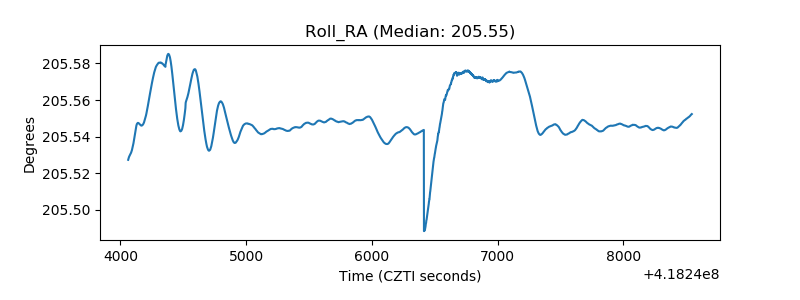 |
| Veto Counter | 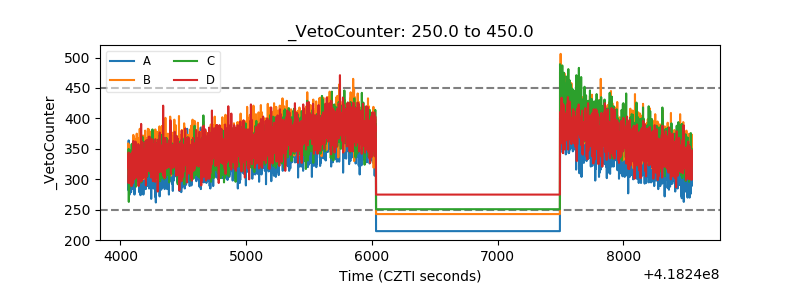 |