| Param | Original file | Final file |
|---|---|---|
| Filename | modeM0/AS1A12_029T01_9000005556_40629cztM0_level2.fits | modeM0/AS1A12_029T01_9000005556_40629cztM0_level2_quad_clean.evt |
| Size (bytes) | 347,820,480 | 95,287,680 |
| Size | 331.7 MB | 90.9 MB |
| Events in quadrant A | 2,988,965 | 639,107 |
| Events in quadrant B | 3,257,982 | 652,020 |
| Events in quadrant C | 2,741,935 | 633,027 |
| Events in quadrant D | 3,425,955 | 547,794 |
| Mode M0 | |||
|---|---|---|---|
| Quadrant | BADHDUFLAG | Total packets | Discarded packets |
| A | 0 | 12651 | 3 |
| B | 0 | 13699 | 2 |
| C | 0 | 11972 | 2 |
| D | 0 | 14133 | 2 |
| Mode M9 | |||
|---|---|---|---|
| Quadrant | BADHDUFLAG | Total packets | Discarded packets |
| A | 0 | 30 | 0 |
| B | 0 | 30 | 0 |
| C | 0 | 30 | 0 |
| D | 0 | 30 | 0 |
| Mode SS | |||
|---|---|---|---|
| Quadrant | BADHDUFLAG | Total packets | Discarded packets |
| A | 0 | 124 | 0 |
| B | 0 | 124 | 0 |
| C | 0 | 124 | 0 |
| D | 0 | 124 | 0 |
| Quadrant | Total seconds | Saturated seconds | Saturation percentage |
|---|---|---|---|
| A | 5906 | 12 | 0.203183% |
| B | 5906 | 88 | 1.490010% |
| C | 5906 | 5 | 0.084660% |
| D | 5906 | 421 | 7.128344% |
Noise dominated data is calculated using 1-second bins in cleaned event files. If a bin has >2000 counts, and if more than 50% of those come from <1% of pixels, then it is considered to be noise-dominated and hence unusable.
| Quadrant | # 1 sec bins | Bins with >0 counts | Bins with >2000 counts | High rate bins dominated by noise | Noise dominated (total time) | Noise dominated (detector-on time) | Marked lightcurve |
|---|---|---|---|---|---|---|---|
| A | 8952 | 5908 | 4 | 4 | 0.04% | 0.07% | 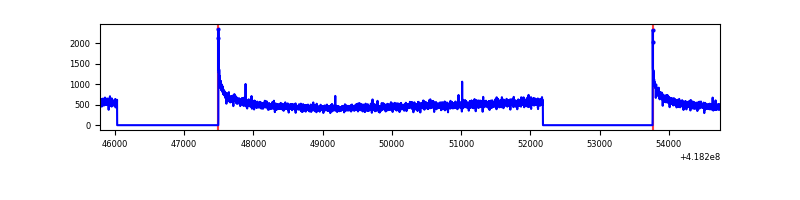 |
| B | 8952 | 5908 | 32 | 32 | 0.36% | 0.54% | 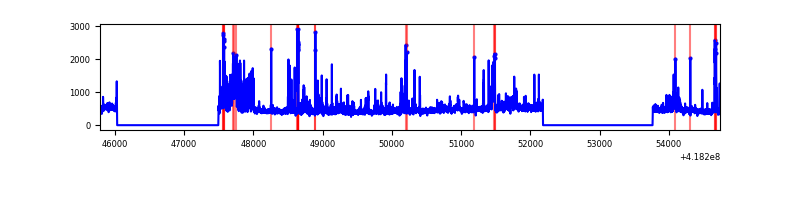 |
| C | 8952 | 5908 | 1 | 1 | 0.01% | 0.02% | 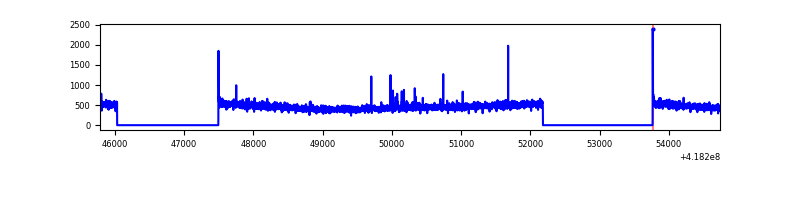 |
| D | 8952 | 5908 | 69 | 69 | 0.77% | 1.17% | 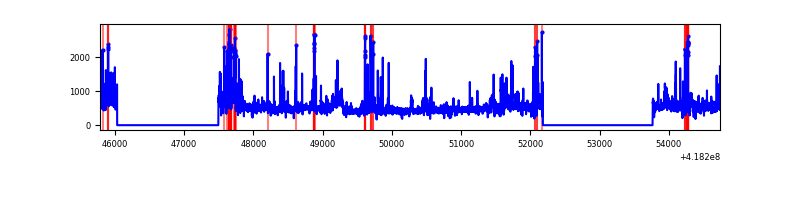 |
Top three noisy pixels from each quadrant. If the there are fewer than three noisy pixels in the level2.evt file, extra rows are filled as -1
| Pixel properties | Quadrant properties | ||||||
|---|---|---|---|---|---|---|---|
| Quadrant | DetID | PixID | Counts | Sigma | Mean | Median | Sigma |
| A | 10 | 83 | 494546 | 3774.71 | 639 | 626 | 130.8 |
| A | 13 | 252 | 18856 | 139.32 | 639 | 626 | 130.8 |
| A | 3 | 137 | 7118 | 49.61 | 639 | 626 | 130.8 |
| B | 4 | 171 | 309018 | 2497.35 | 634 | 614 | 123.5 |
| B | 0 | 190 | 265592 | 2145.7 | 634 | 614 | 123.5 |
| B | 0 | 229 | 75191 | 603.9 | 634 | 614 | 123.5 |
| C | 15 | 214 | 256737 | 1736.35 | 628 | 633 | 147.5 |
| C | 14 | 254 | 14184 | 91.87 | 628 | 633 | 147.5 |
| C | 0 | 10 | 13843 | 89.56 | 628 | 633 | 147.5 |
| D | 12 | 227 | 545225 | 3640.33 | 601 | 582 | 149.6 |
| D | 2 | 250 | 242365 | 1616.05 | 601 | 582 | 149.6 |
| D | 12 | 191 | 183685 | 1223.84 | 601 | 582 | 149.6 |
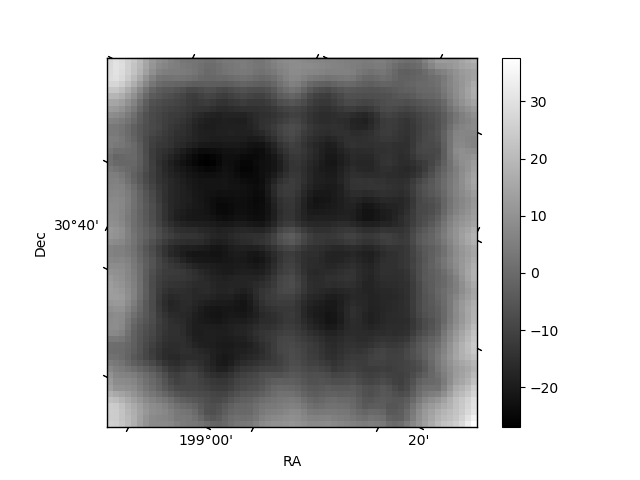
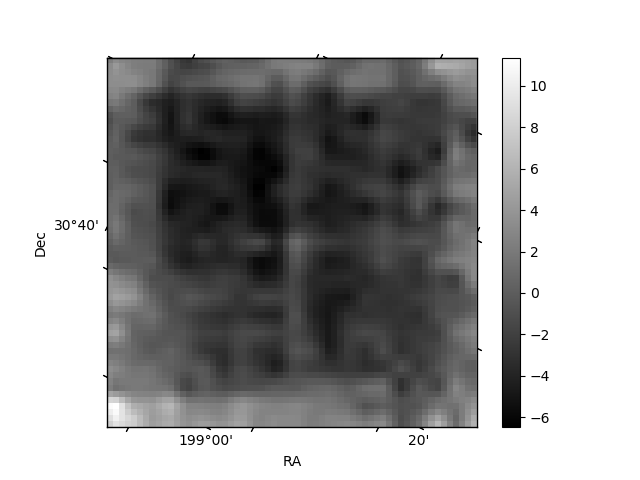
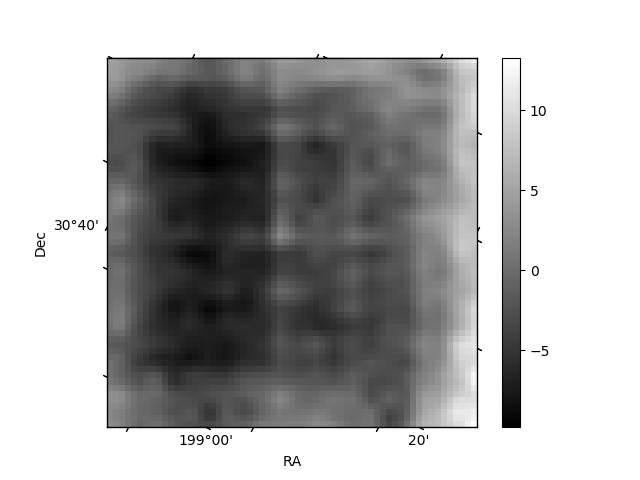
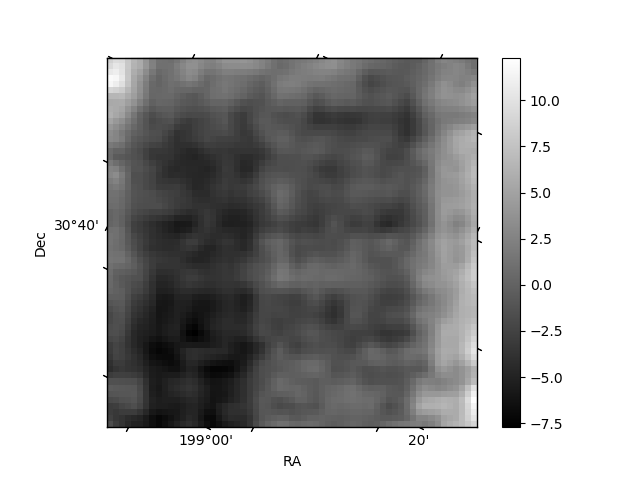
Histogram calculated using DETX and DETY for each event in the final _common_clean file
| Quadrant A | 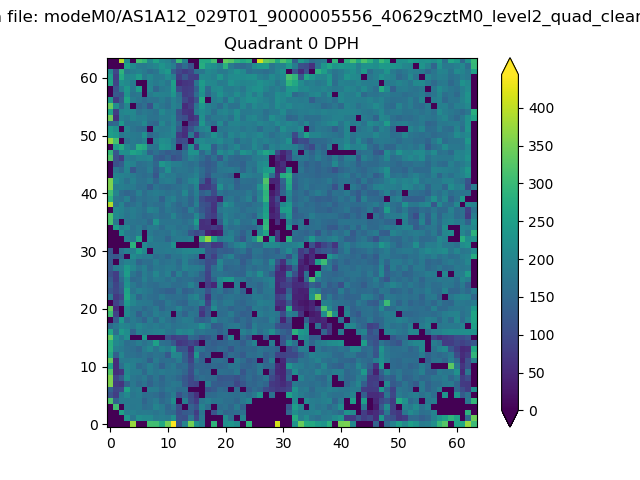 |
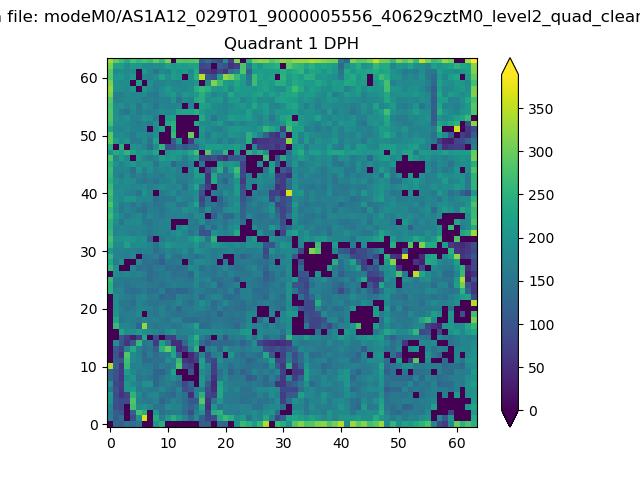 |
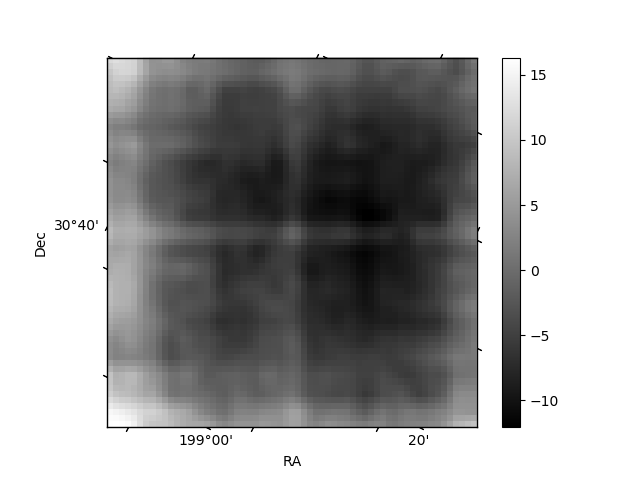
Quadrant B |
|---|---|---|---|
| Quadrant D | 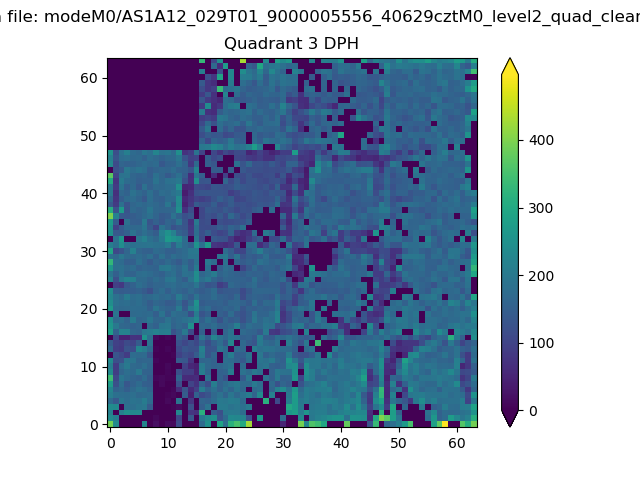 |
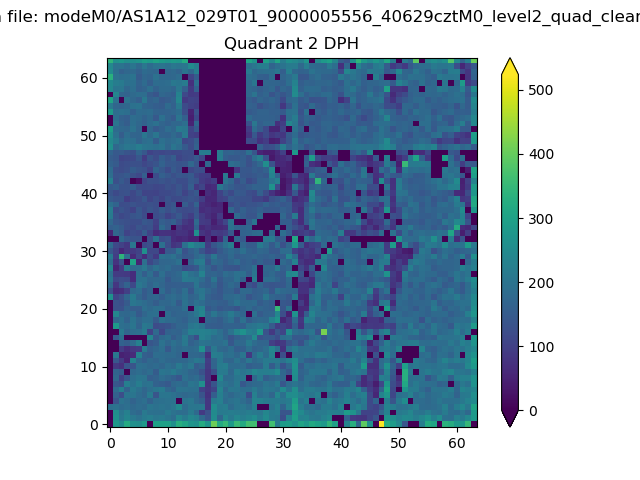 |
Quadrant C |
| Plot type | Count rate plots | Images |
|---|---|---|
| Comparison with Poisson distribution Blue bars denote a histogram of data divided into 1 sec bins. Red curve is a Poisson curve with rate = median count rate of data. |
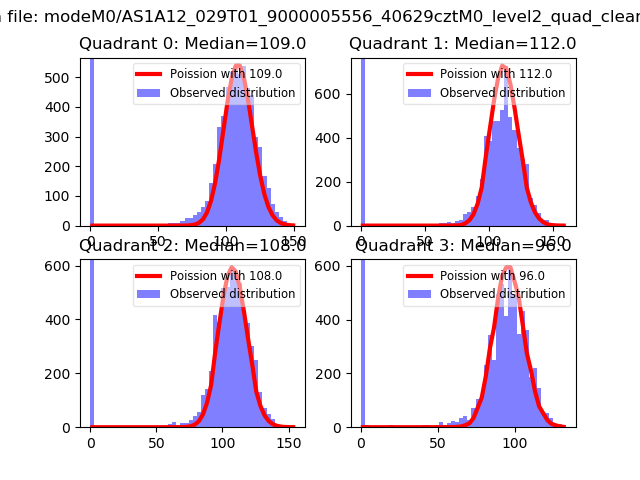 |
 |
| Quadrant-wise count rates Data is divided into 100 sec bins |
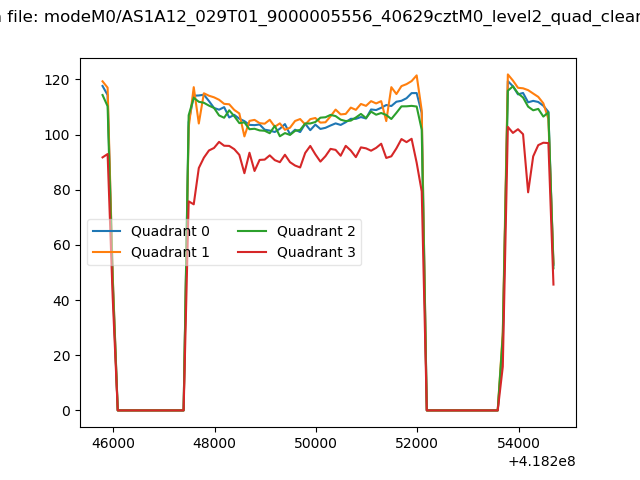 |
|
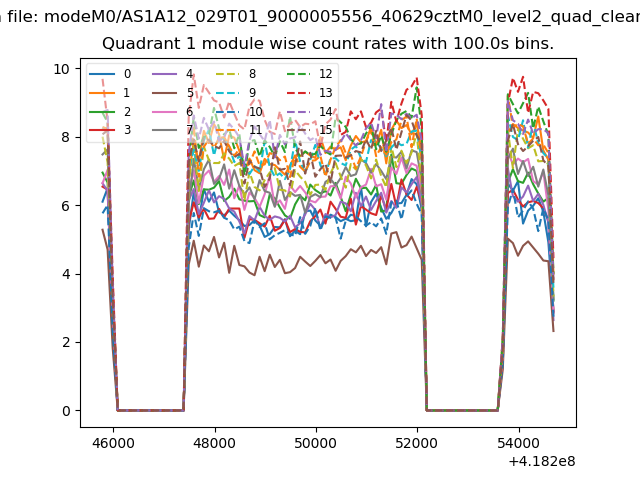
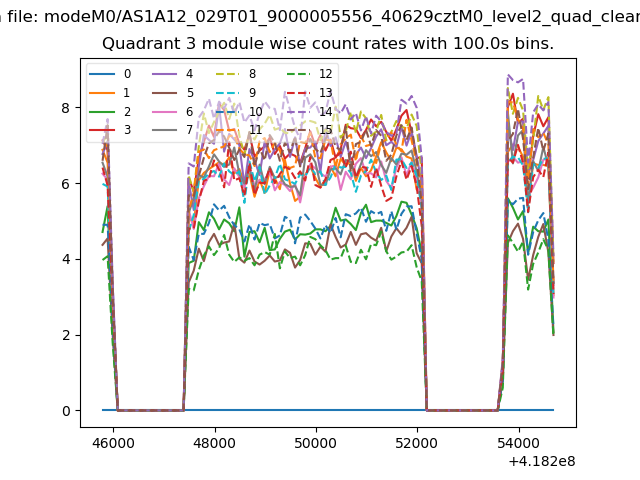
| Module-wise count rates for Quadrant A Data is divided into 100 sec bins |
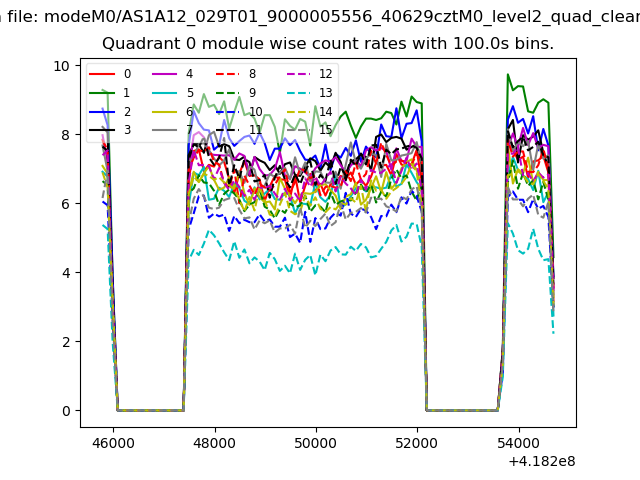 |
 |
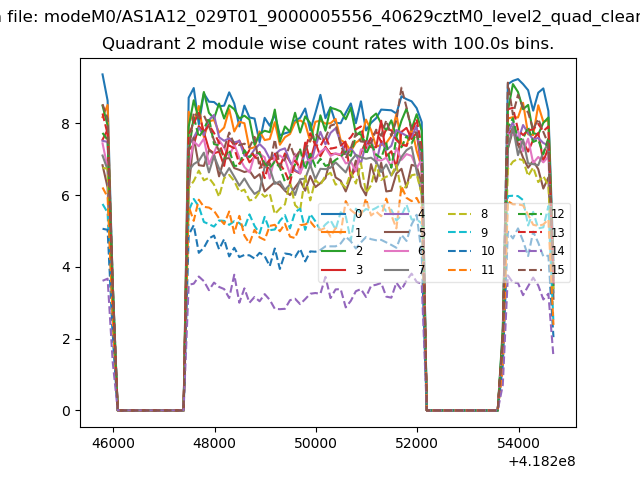
| Module-wise count rates for Quadrant B Data is divided into 100 sec bins |
 |
 |
| Module-wise count rates for Quadrant C Data is divided into 100 sec bins |
 |
 |
| Module-wise count rates for Quadrant D Data is divided into 100 sec bins |
 |
 |
| Parameter | Plot |
|---|---|
| CZT HV Monitor |  |
| D_VDD | 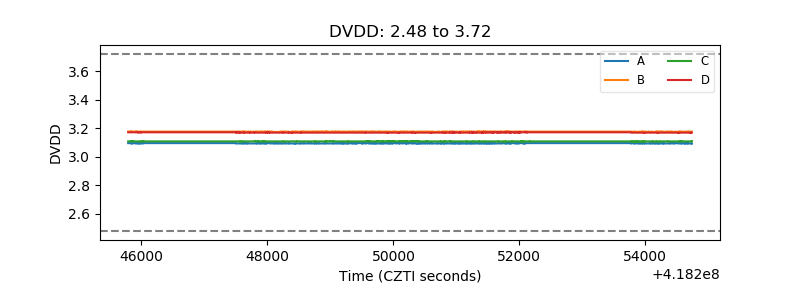 |
| Temperature 1 | 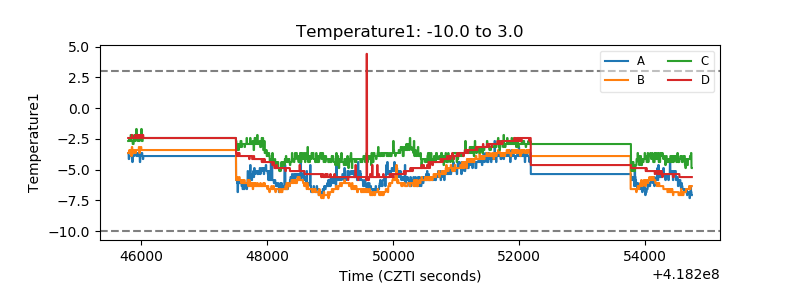 |
| Veto HV Monitor | 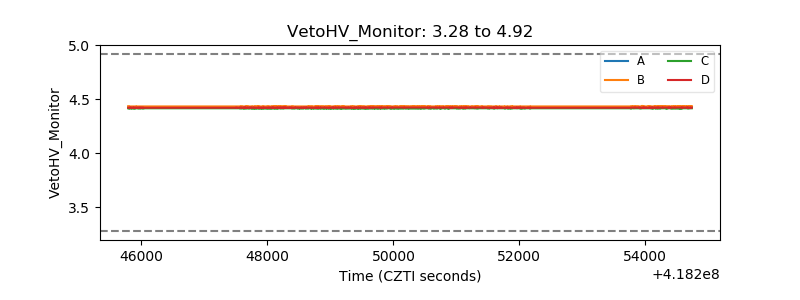 |
| Veto LLD | 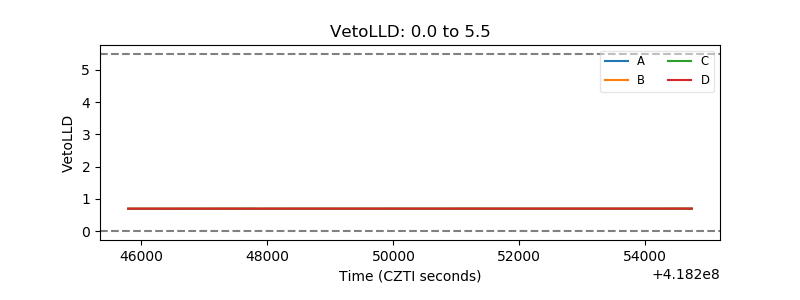 |
| Alpha Counter | 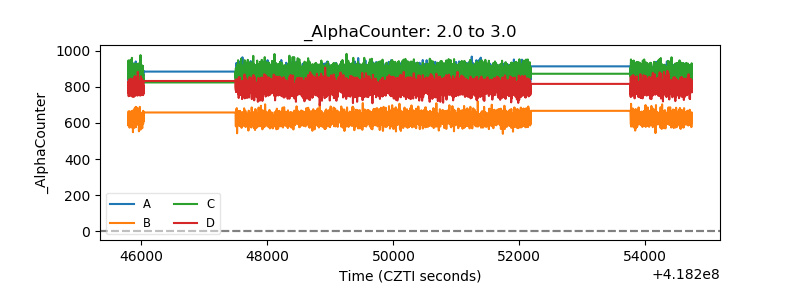 |
| _CPM_Rate | 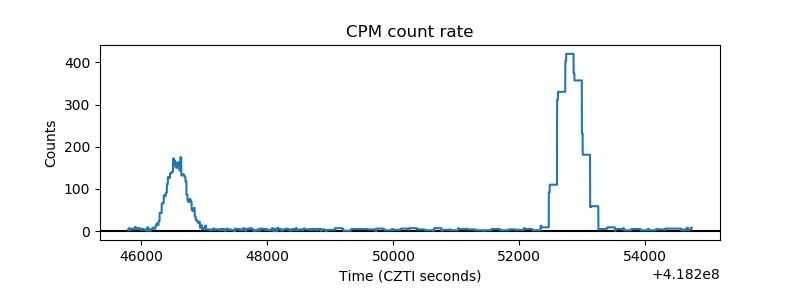 |
| CZT Counter | 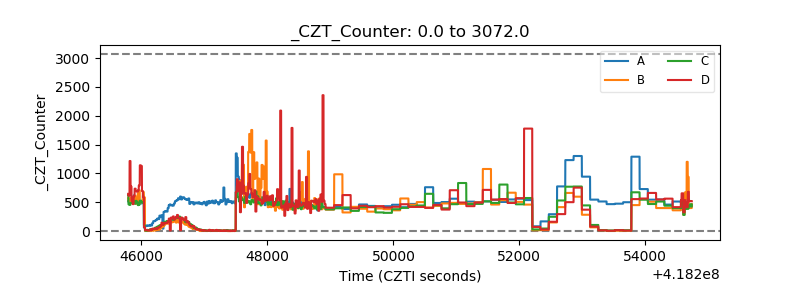 |
| +2.5 Volts monitor | 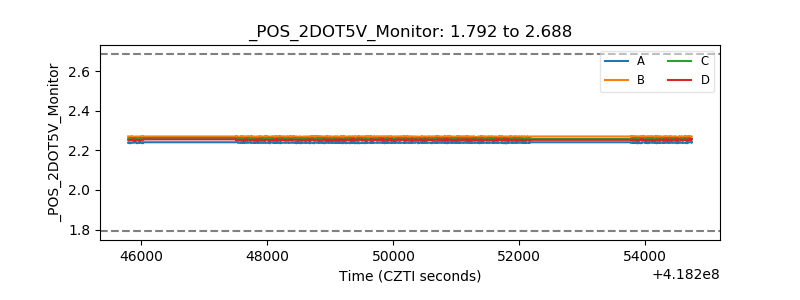 |
| +5 Volts monitor | 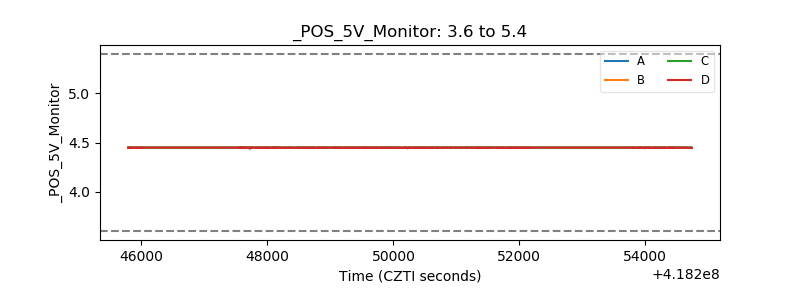 |
| _ROLL_ROT | 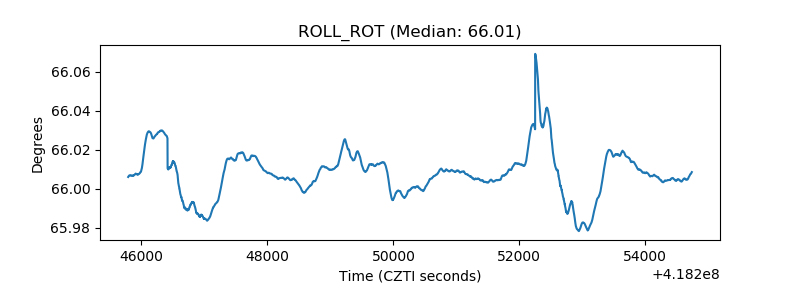 |
| _Roll_DEC | 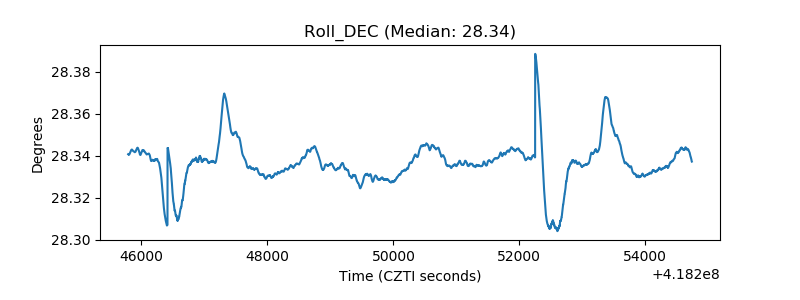 |
| _Roll_RA | 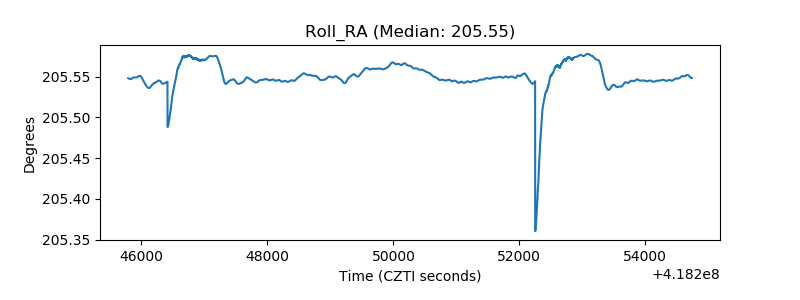 |
| Veto Counter | 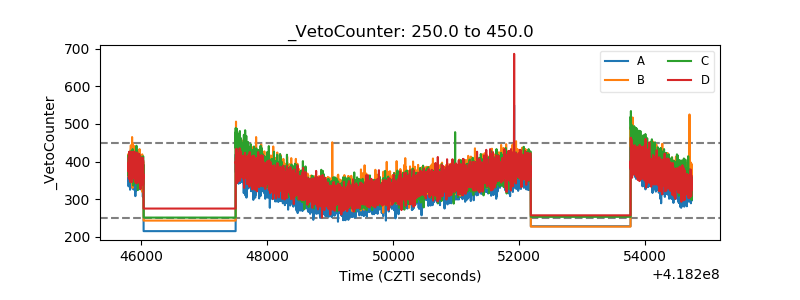 |