| Param | Original file | Final file |
|---|---|---|
| Filename | modeM0/AS1A12_029T01_9000005556_40631cztM0_level2.fits | modeM0/AS1A12_029T01_9000005556_40631cztM0_level2_quad_clean.evt |
| Size (bytes) | 312,791,040 | 91,722,240 |
| Size | 298.3 MB | 87.5 MB |
| Events in quadrant A | 2,897,863 | 612,978 |
| Events in quadrant B | 2,706,707 | 634,756 |
| Events in quadrant C | 2,599,833 | 608,754 |
| Events in quadrant D | 2,937,746 | 529,908 |
| Mode M0 | |||
|---|---|---|---|
| Quadrant | BADHDUFLAG | Total packets | Discarded packets |
| A | 0 | 12140 | 3 |
| B | 0 | 11931 | 2 |
| C | 0 | 11360 | 2 |
| D | 0 | 12528 | 2 |
| Mode M9 | |||
|---|---|---|---|
| Quadrant | BADHDUFLAG | Total packets | Discarded packets |
| A | 0 | 34 | 0 |
| B | 0 | 34 | 0 |
| C | 0 | 34 | 0 |
| D | 0 | 34 | 0 |
| Mode SS | |||
|---|---|---|---|
| Quadrant | BADHDUFLAG | Total packets | Discarded packets |
| A | 0 | 114 | 0 |
| B | 0 | 114 | 0 |
| C | 0 | 114 | 0 |
| D | 0 | 114 | 0 |
| Quadrant | Total seconds | Saturated seconds | Saturation percentage |
|---|---|---|---|
| A | 5593 | 32 | 0.572144% |
| B | 5593 | 37 | 0.661541% |
| C | 5593 | 8 | 0.143036% |
| D | 5593 | 304 | 5.435366% |
Noise dominated data is calculated using 1-second bins in cleaned event files. If a bin has >2000 counts, and if more than 50% of those come from <1% of pixels, then it is considered to be noise-dominated and hence unusable.
| Quadrant | # 1 sec bins | Bins with >0 counts | Bins with >2000 counts | High rate bins dominated by noise | Noise dominated (total time) | Noise dominated (detector-on time) | Marked lightcurve |
|---|---|---|---|---|---|---|---|
| A | 8909 | 5595 | 19 | 19 | 0.21% | 0.34% | 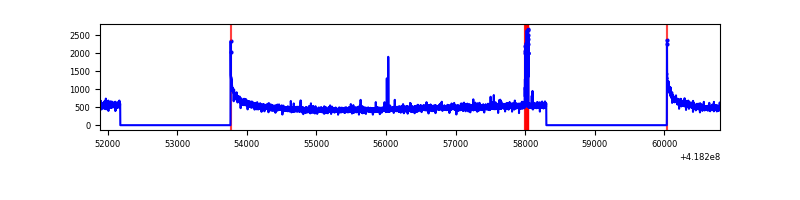 |
| B | 8909 | 5595 | 16 | 16 | 0.18% | 0.29% | 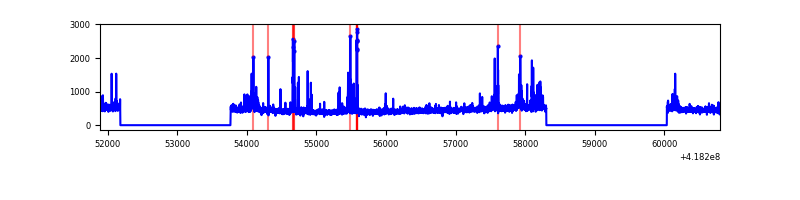 |
| C | 8909 | 5595 | 2 | 2 | 0.02% | 0.04% | 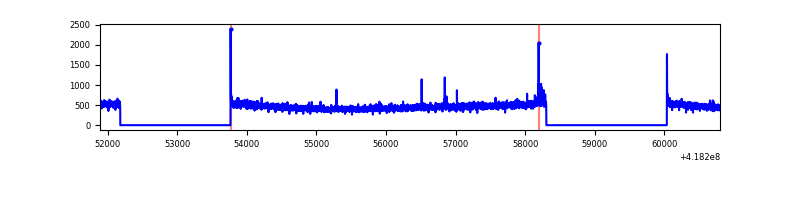 |
| D | 8909 | 5595 | 31 | 31 | 0.35% | 0.55% | 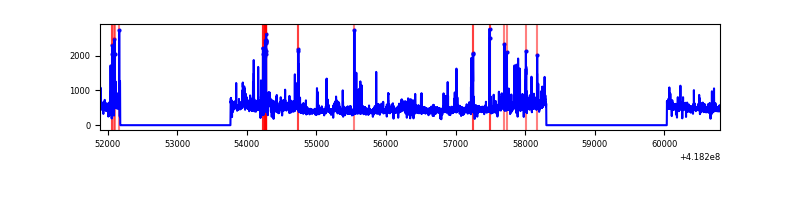 |
Top three noisy pixels from each quadrant. If the there are fewer than three noisy pixels in the level2.evt file, extra rows are filled as -1
| Pixel properties | Quadrant properties | ||||||
|---|---|---|---|---|---|---|---|
| Quadrant | DetID | PixID | Counts | Sigma | Mean | Median | Sigma |
| A | 10 | 83 | 479062 | 3832.47 | 606 | 594 | 124.8 |
| A | 15 | 223 | 60489 | 479.75 | 606 | 594 | 124.8 |
| A | 13 | 254 | 6960 | 50.99 | 606 | 594 | 124.8 |
| B | 0 | 190 | 113384 | 950.2 | 607 | 589 | 118.7 |
| B | 5 | 255 | 111931 | 937.96 | 607 | 589 | 118.7 |
| B | 0 | 229 | 76006 | 635.32 | 607 | 589 | 118.7 |
| C | 15 | 214 | 244090 | 1747.75 | 595 | 598 | 139.3 |
| C | 14 | 254 | 16175 | 111.81 | 595 | 598 | 139.3 |
| C | 0 | 10 | 13416 | 92.01 | 595 | 598 | 139.3 |
| D | 12 | 227 | 369216 | 2611.16 | 572 | 557 | 141.2 |
| D | 12 | 191 | 161464 | 1139.68 | 572 | 557 | 141.2 |
| D | 2 | 250 | 117417 | 827.7 | 572 | 557 | 141.2 |
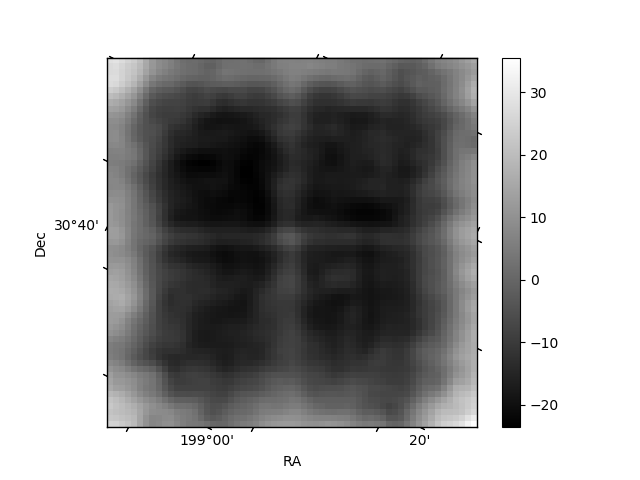
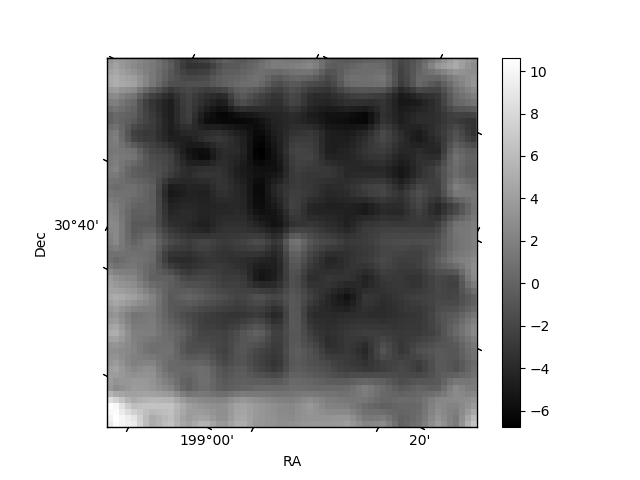
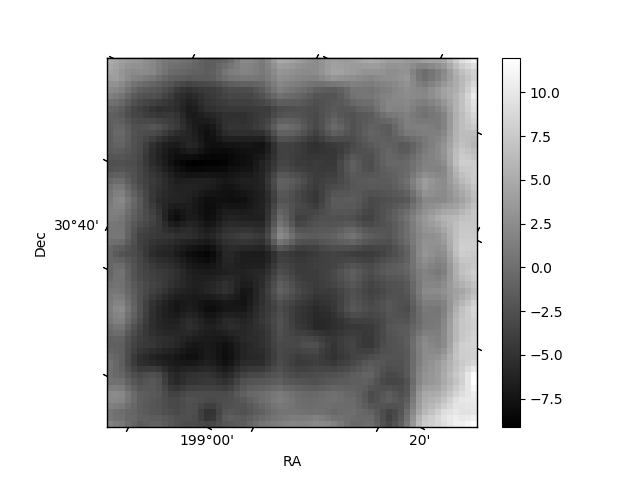
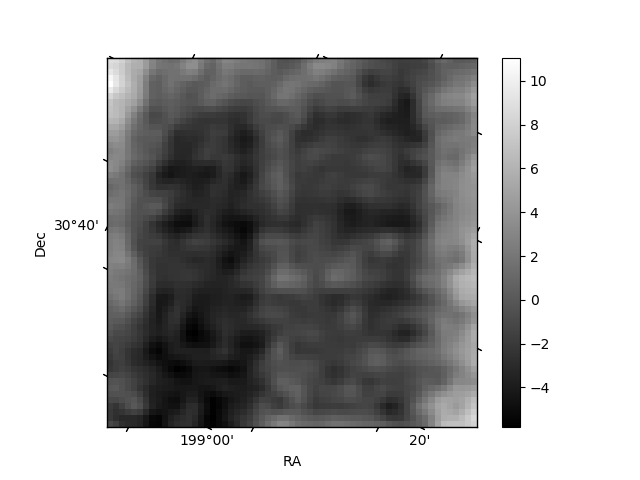
Histogram calculated using DETX and DETY for each event in the final _common_clean file
| Quadrant A | 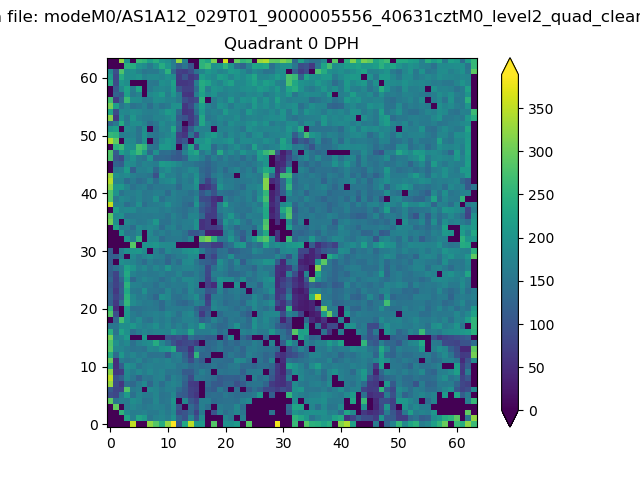 |
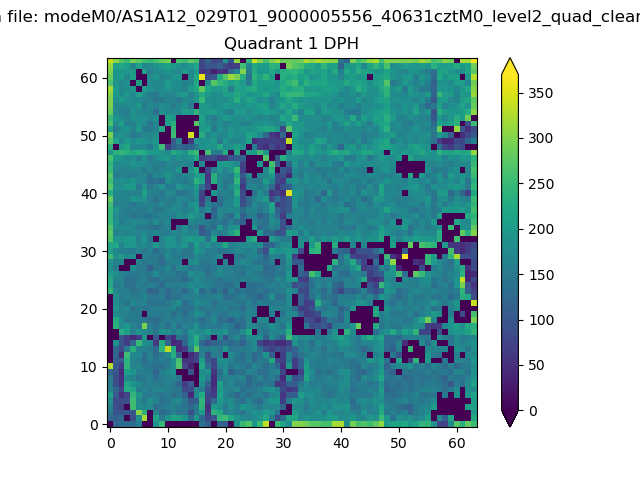 |
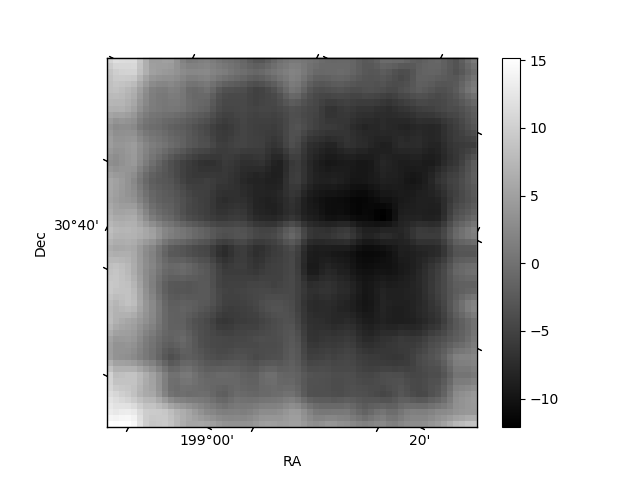
Quadrant B |
|---|---|---|---|
| Quadrant D | 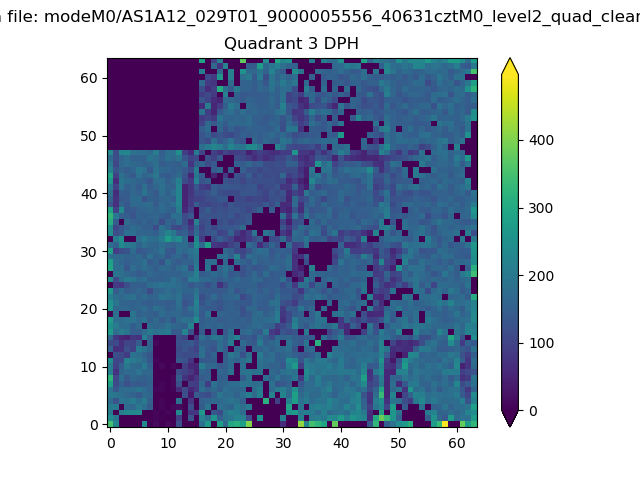 |
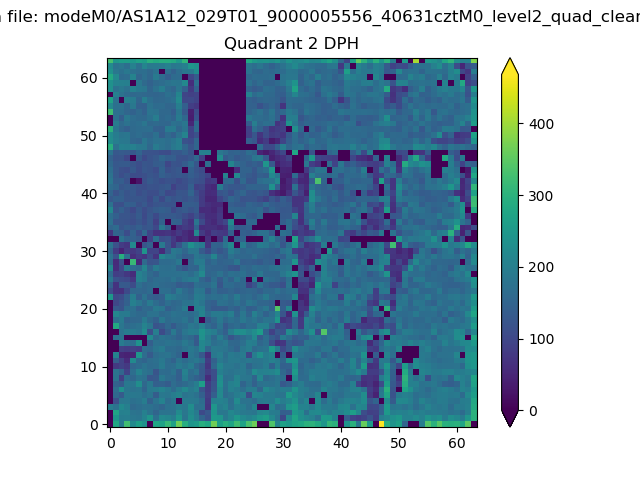 |
Quadrant C |
| Plot type | Count rate plots | Images |
|---|---|---|
| Comparison with Poisson distribution Blue bars denote a histogram of data divided into 1 sec bins. Red curve is a Poisson curve with rate = median count rate of data. |
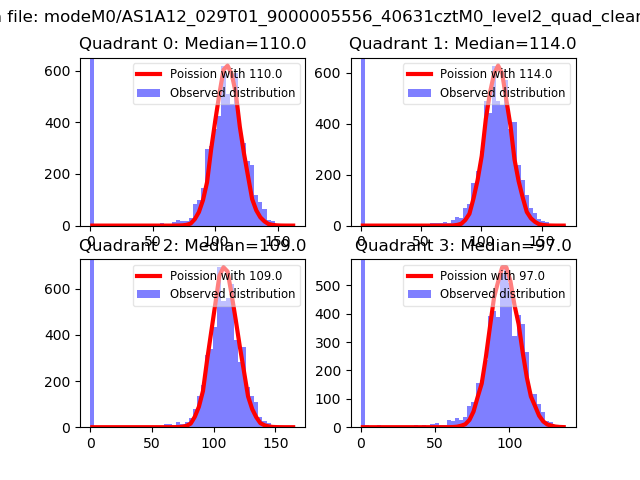 |
 |
| Quadrant-wise count rates Data is divided into 100 sec bins |
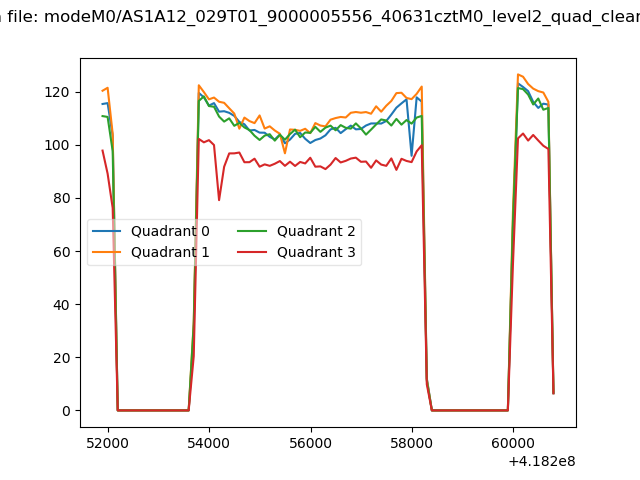 |
|
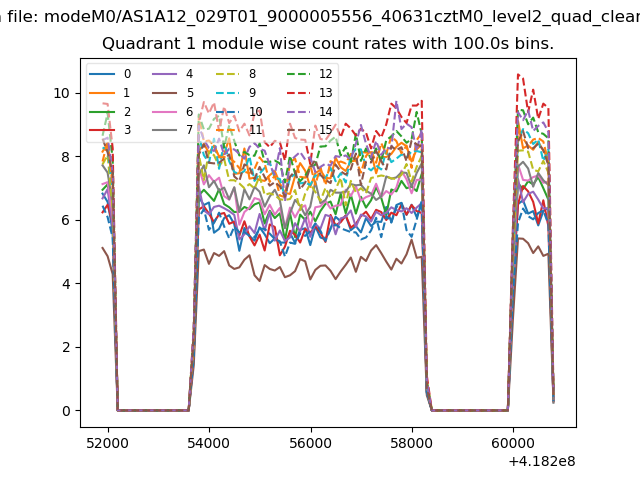
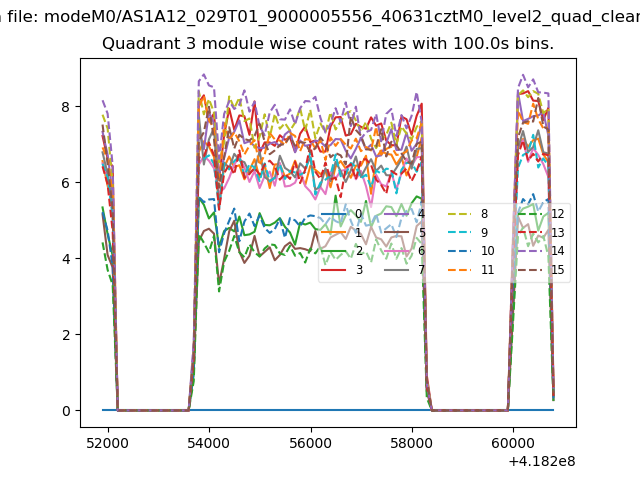
| Module-wise count rates for Quadrant A Data is divided into 100 sec bins |
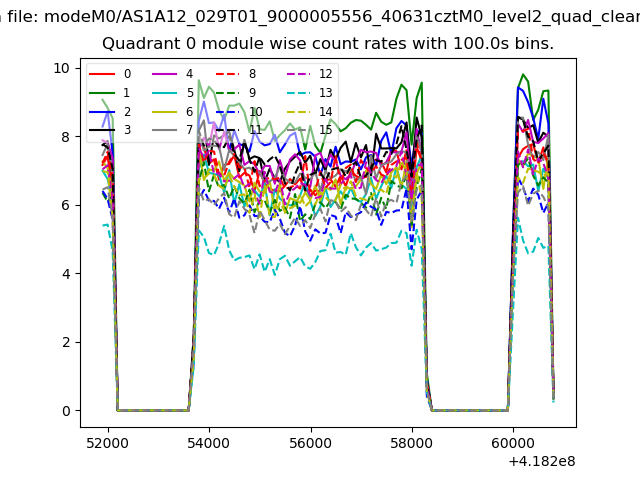 |
 |
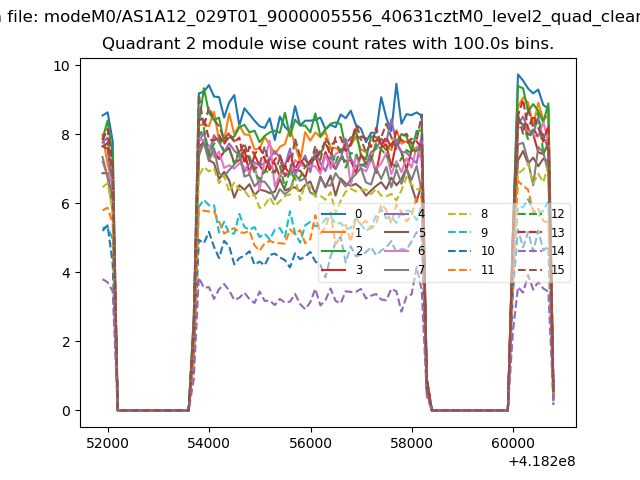
| Module-wise count rates for Quadrant B Data is divided into 100 sec bins |
 |
 |
| Module-wise count rates for Quadrant C Data is divided into 100 sec bins |
 |
 |
| Module-wise count rates for Quadrant D Data is divided into 100 sec bins |
 |
 |
| Parameter | Plot |
|---|---|
| CZT HV Monitor | 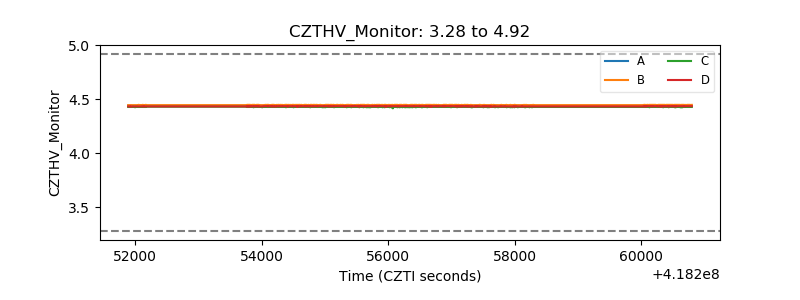 |
| D_VDD | 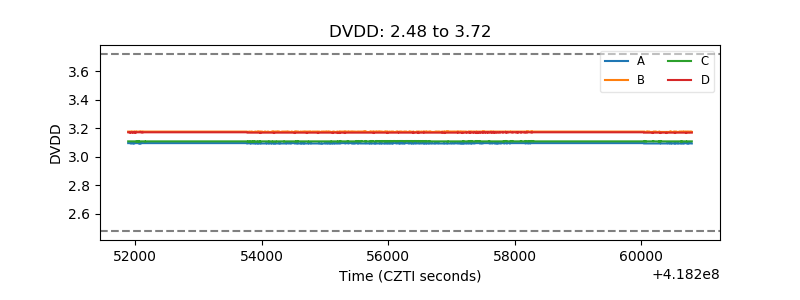 |
| Temperature 1 | 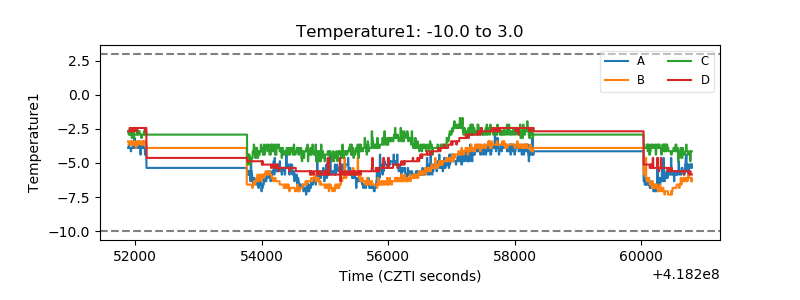 |
| Veto HV Monitor | 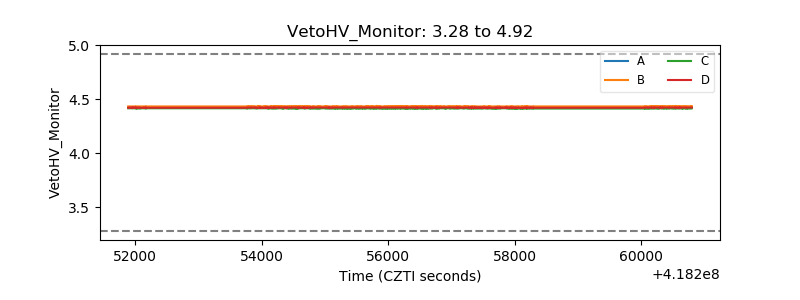 |
| Veto LLD | 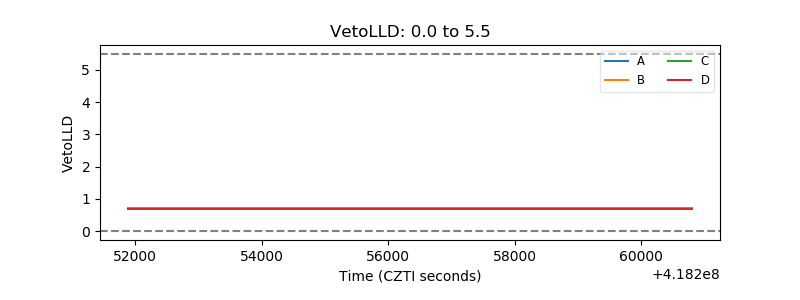 |
| Alpha Counter | 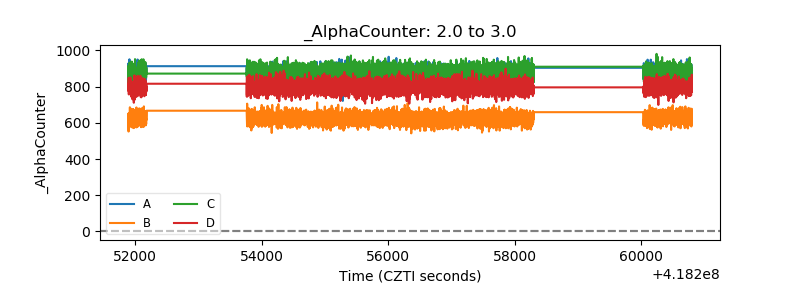 |
| _CPM_Rate | 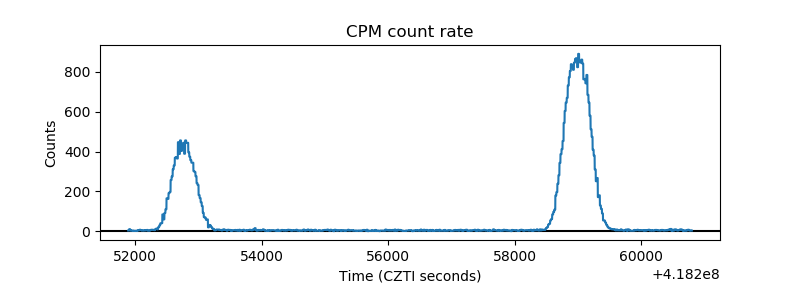 |
| CZT Counter | 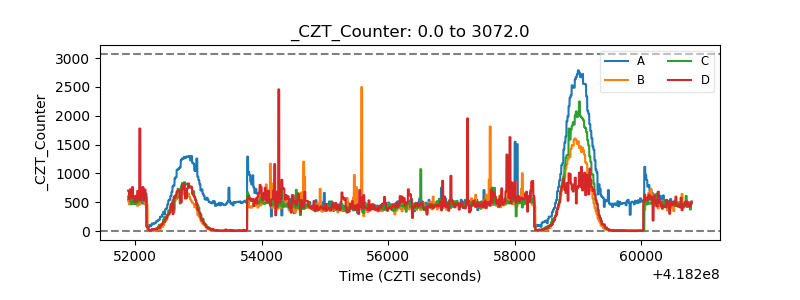 |
| +2.5 Volts monitor | 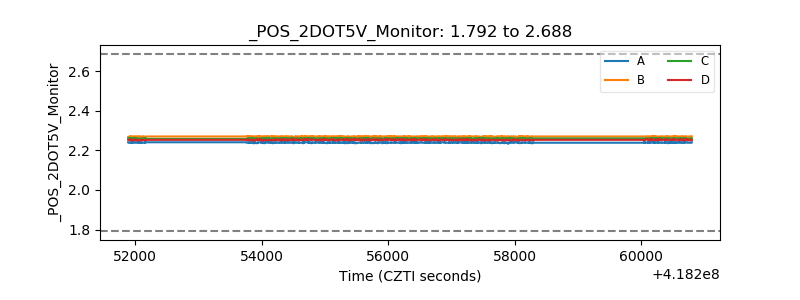 |
| +5 Volts monitor | 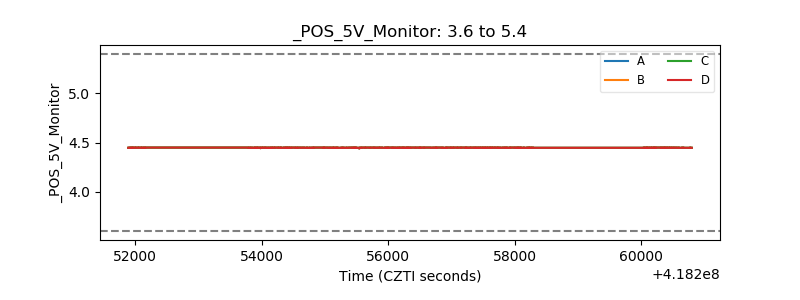 |
| _ROLL_ROT | 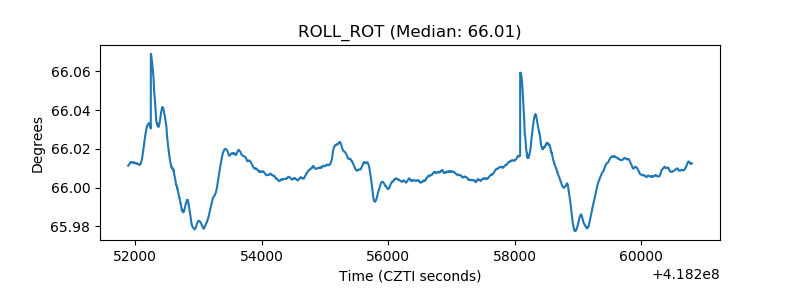 |
| _Roll_DEC | 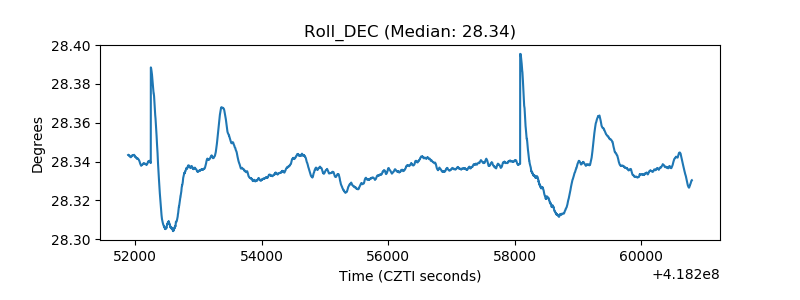 |
| _Roll_RA | 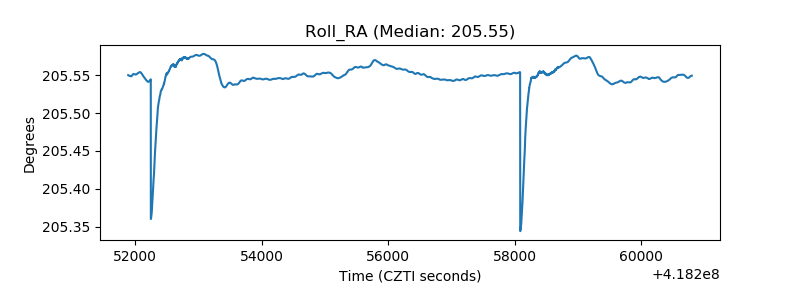 |
| Veto Counter | 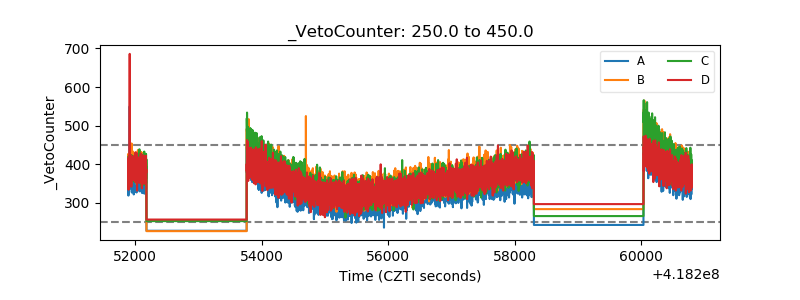 |