| Param | Original file | Final file |
|---|---|---|
| Filename | modeM0/AS1A12_029T01_9000005556_40632cztM0_level2.fits | modeM0/AS1A12_029T01_9000005556_40632cztM0_level2_quad_clean.evt |
| Size (bytes) | 317,972,160 | 93,643,200 |
| Size | 303.2 MB | 89.3 MB |
| Events in quadrant A | 2,996,114 | 629,210 |
| Events in quadrant B | 2,812,162 | 656,020 |
| Events in quadrant C | 2,637,950 | 623,386 |
| Events in quadrant D | 2,889,006 | 537,133 |
| Mode M0 | |||
|---|---|---|---|
| Quadrant | BADHDUFLAG | Total packets | Discarded packets |
| A | 0 | 12290 | 3 |
| B | 0 | 11962 | 2 |
| C | 0 | 11353 | 2 |
| D | 0 | 12416 | 2 |
| Mode M9 | |||
|---|---|---|---|
| Quadrant | BADHDUFLAG | Total packets | Discarded packets |
| A | 0 | 36 | 0 |
| B | 0 | 36 | 0 |
| C | 0 | 36 | 0 |
| D | 0 | 36 | 0 |
| Mode SS | |||
|---|---|---|---|
| Quadrant | BADHDUFLAG | Total packets | Discarded packets |
| A | 0 | 114 | 0 |
| B | 0 | 114 | 0 |
| C | 0 | 114 | 0 |
| D | 0 | 114 | 0 |
| Quadrant | Total seconds | Saturated seconds | Saturation percentage |
|---|---|---|---|
| A | 5577 | 33 | 0.591716% |
| B | 5577 | 31 | 0.555854% |
| C | 5577 | 9 | 0.161377% |
| D | 5577 | 384 | 6.885422% |
Noise dominated data is calculated using 1-second bins in cleaned event files. If a bin has >2000 counts, and if more than 50% of those come from <1% of pixels, then it is considered to be noise-dominated and hence unusable.
| Quadrant | # 1 sec bins | Bins with >0 counts | Bins with >2000 counts | High rate bins dominated by noise | Noise dominated (total time) | Noise dominated (detector-on time) | Marked lightcurve |
|---|---|---|---|---|---|---|---|
| A | 9162 | 5579 | 24 | 24 | 0.26% | 0.43% | 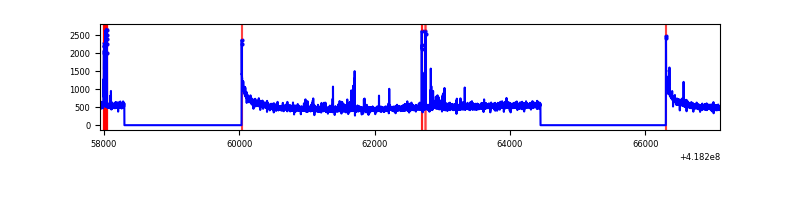 |
| B | 9162 | 5579 | 9 | 9 | 0.10% | 0.16% | 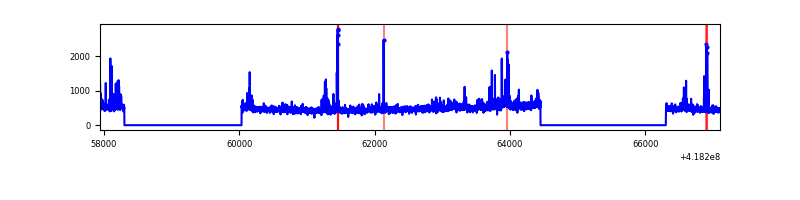 |
| C | 9162 | 5579 | 3 | 3 | 0.03% | 0.05% | 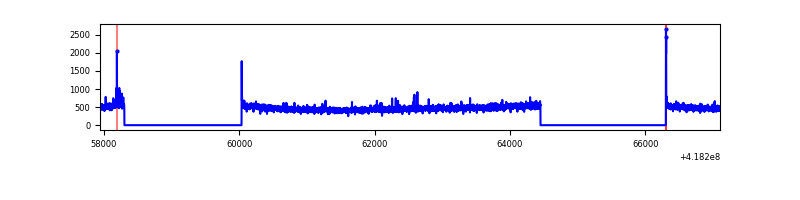 |
| D | 9162 | 5579 | 37 | 37 | 0.40% | 0.66% | 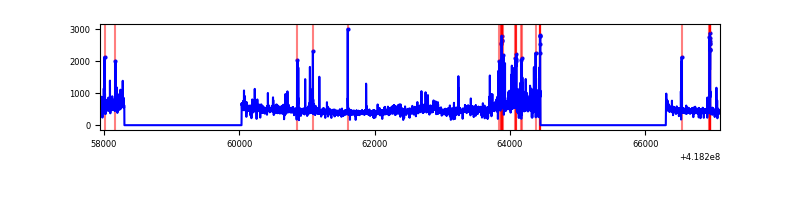 |
Top three noisy pixels from each quadrant. If the there are fewer than three noisy pixels in the level2.evt file, extra rows are filled as -1
| Pixel properties | Quadrant properties | ||||||
|---|---|---|---|---|---|---|---|
| Quadrant | DetID | PixID | Counts | Sigma | Mean | Median | Sigma |
| A | 10 | 83 | 488772 | 3840.69 | 618 | 606 | 127.1 |
| A | 15 | 223 | 85597 | 668.67 | 618 | 606 | 127.1 |
| A | 2 | 79 | 18475 | 140.59 | 618 | 606 | 127.1 |
| B | 5 | 255 | 117545 | 966.94 | 617 | 599 | 120.9 |
| B | 3 | 112 | 105023 | 863.41 | 617 | 599 | 120.9 |
| B | 0 | 229 | 93661 | 769.46 | 617 | 599 | 120.9 |
| C | 15 | 214 | 243168 | 1717.72 | 604 | 608 | 141.2 |
| C | 0 | 10 | 16004 | 109.03 | 604 | 608 | 141.2 |
| C | 14 | 254 | 15980 | 108.86 | 604 | 608 | 141.2 |
| D | 12 | 227 | 196946 | 1389.43 | 576 | 561 | 141.3 |
| D | 12 | 191 | 180481 | 1272.94 | 576 | 561 | 141.3 |
| D | 6 | 239 | 73245 | 514.24 | 576 | 561 | 141.3 |
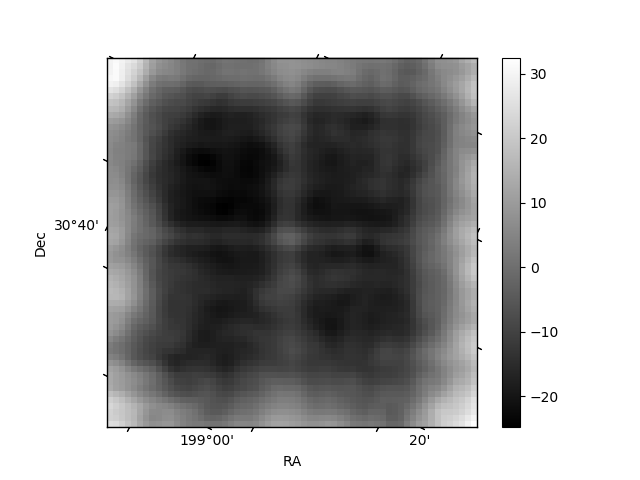
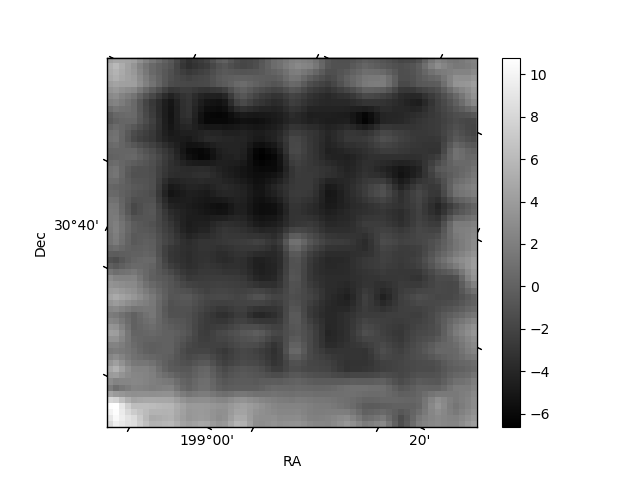
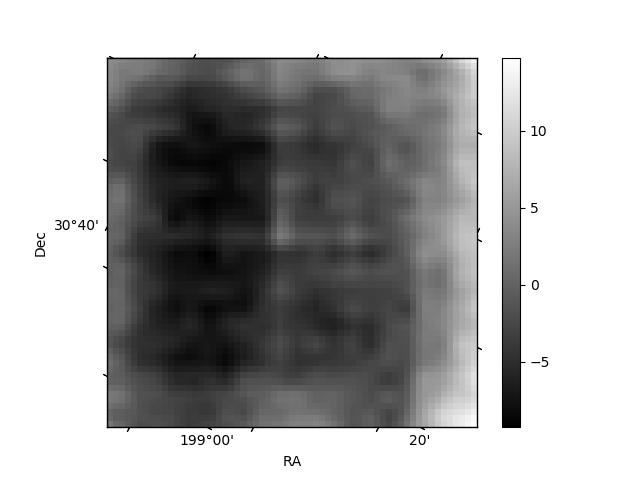
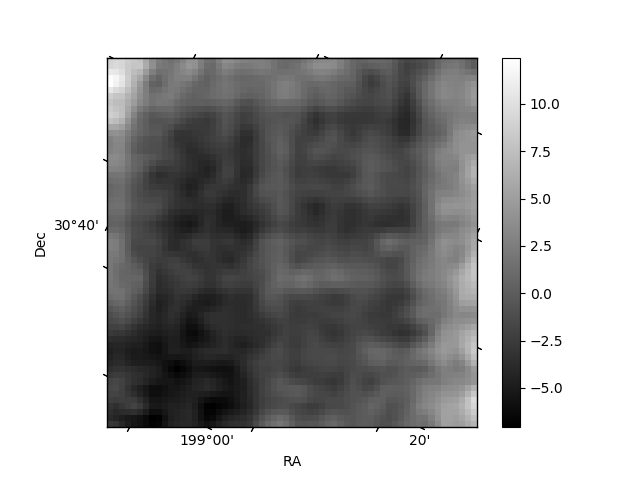
Histogram calculated using DETX and DETY for each event in the final _common_clean file
| Quadrant A | 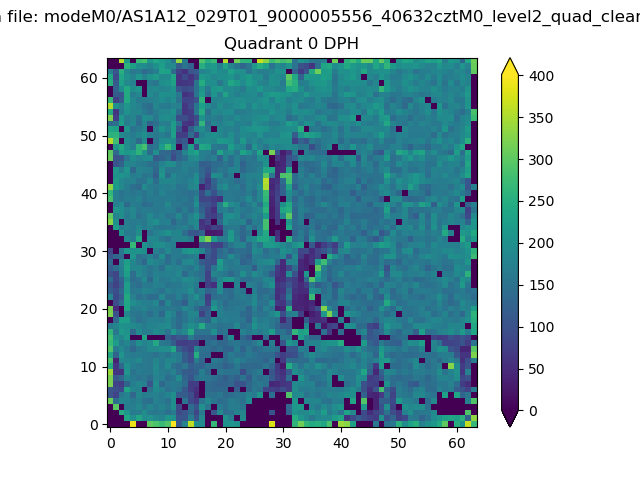 |
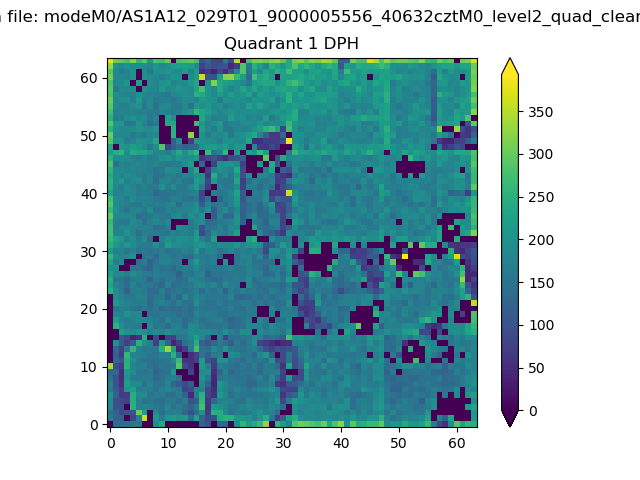 |
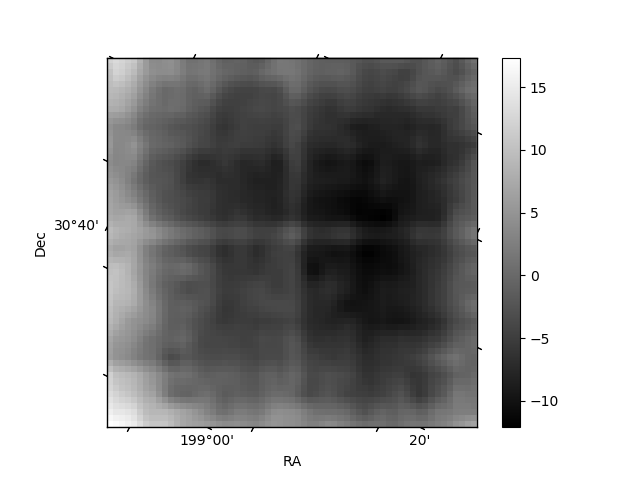
Quadrant B |
|---|---|---|---|
| Quadrant D | 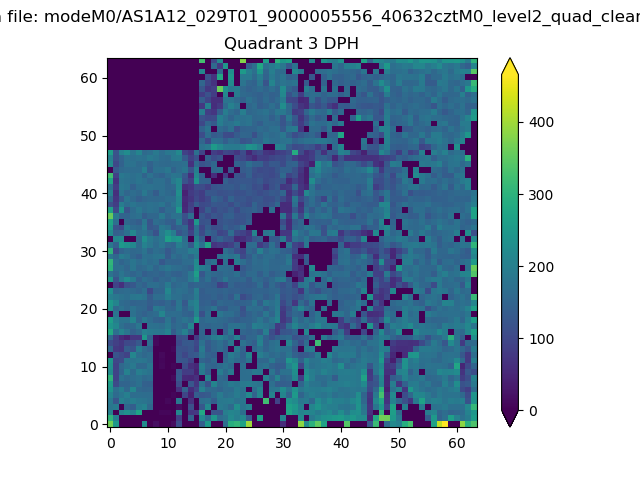 |
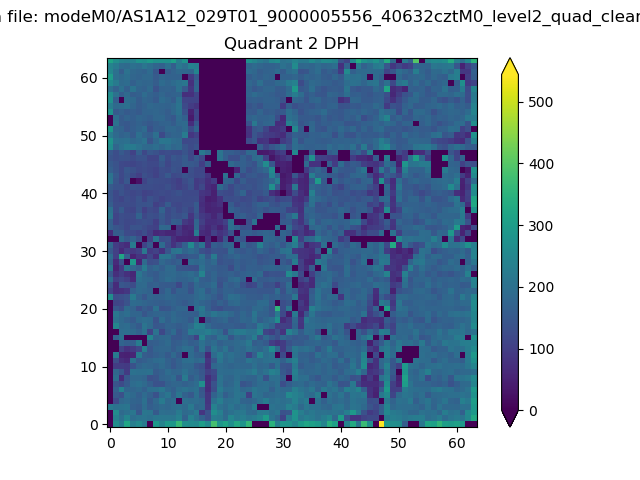 |
Quadrant C |
| Plot type | Count rate plots | Images |
|---|---|---|
| Comparison with Poisson distribution Blue bars denote a histogram of data divided into 1 sec bins. Red curve is a Poisson curve with rate = median count rate of data. |
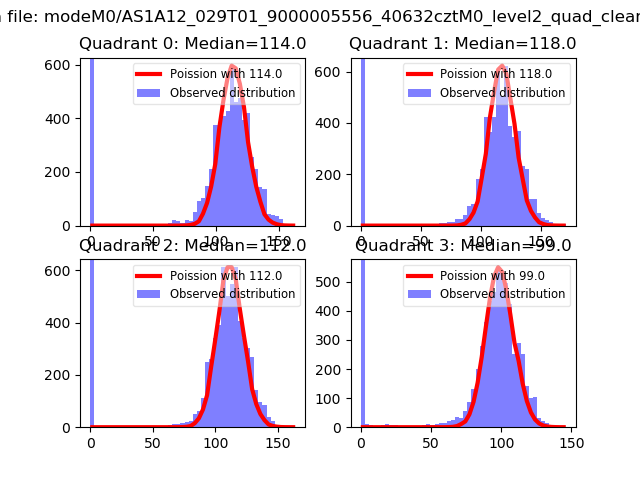 |
 |
| Quadrant-wise count rates Data is divided into 100 sec bins |
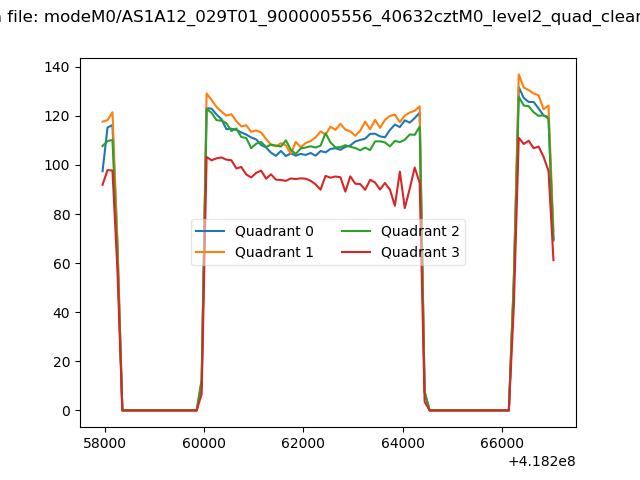 |
|
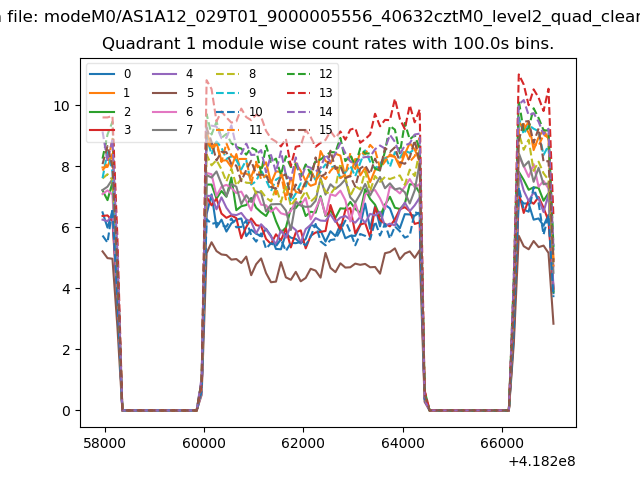
| Module-wise count rates for Quadrant A Data is divided into 100 sec bins |
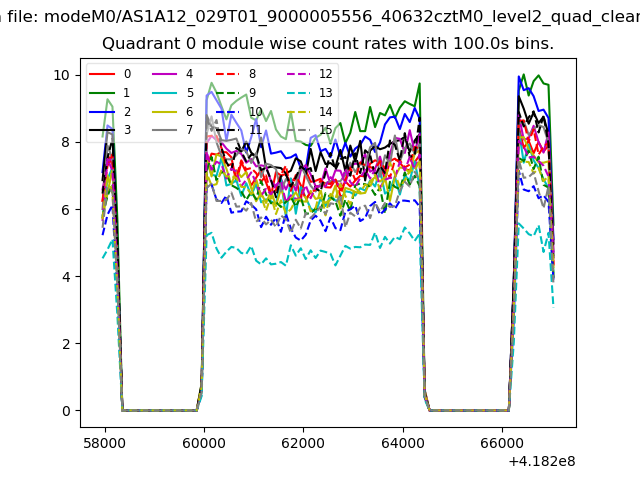 |
 |
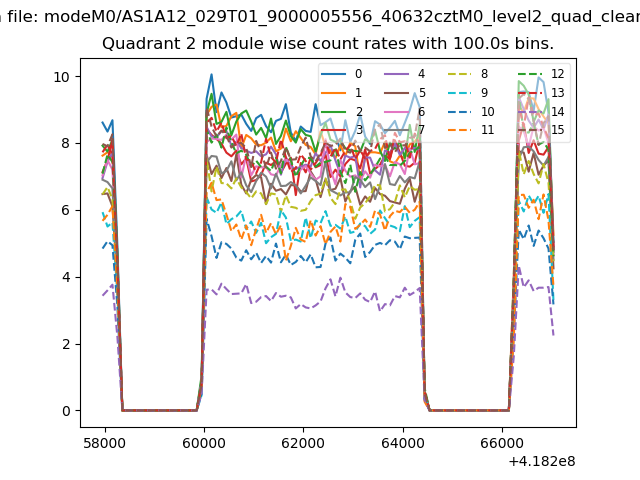
| Module-wise count rates for Quadrant B Data is divided into 100 sec bins |
 |
 |
| Module-wise count rates for Quadrant C Data is divided into 100 sec bins |
 |
 |
| Module-wise count rates for Quadrant D Data is divided into 100 sec bins |
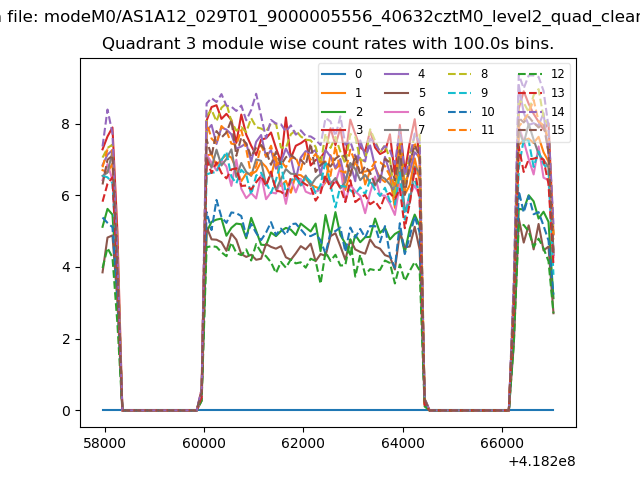 |
 |
| Parameter | Plot |
|---|---|
| CZT HV Monitor | 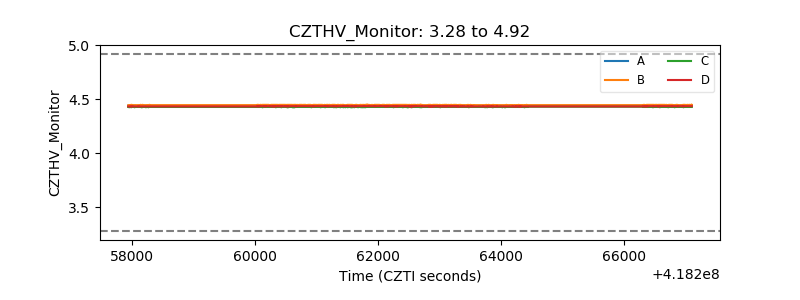 |
| D_VDD | 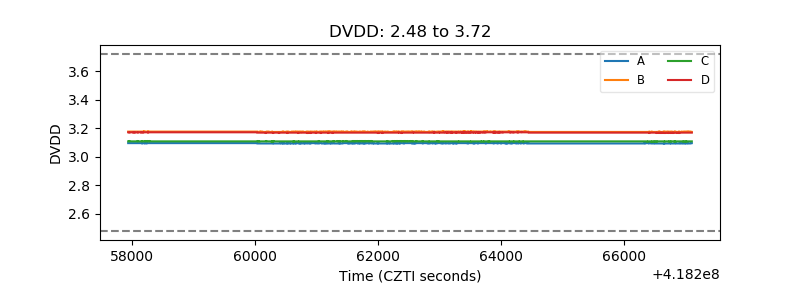 |
| Temperature 1 | 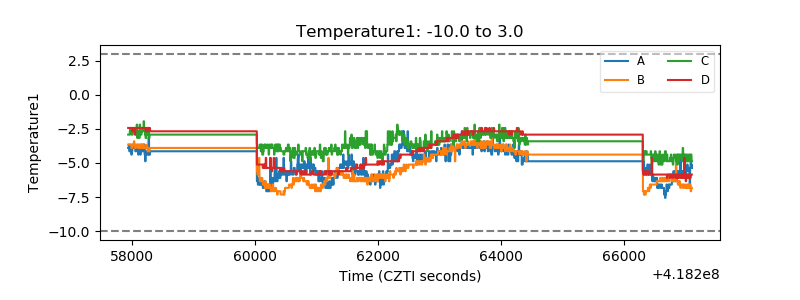 |
| Veto HV Monitor | 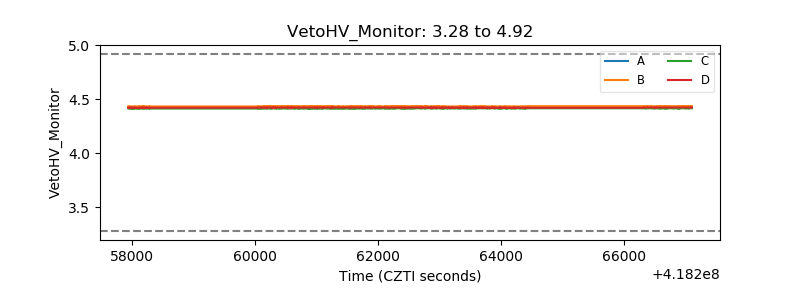 |
| Veto LLD | 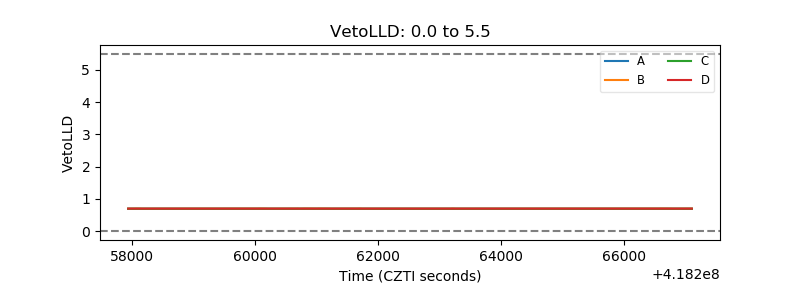 |
| Alpha Counter | 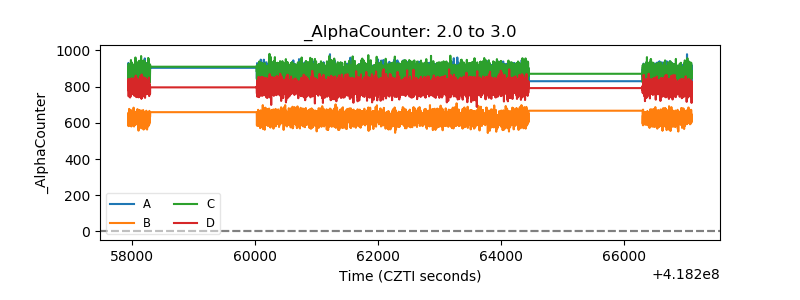 |
| _CPM_Rate | 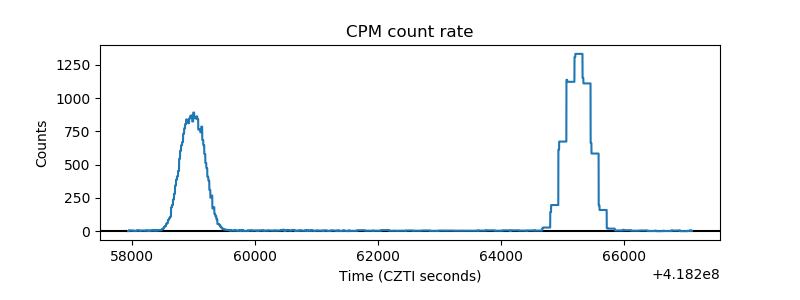 |
| CZT Counter | 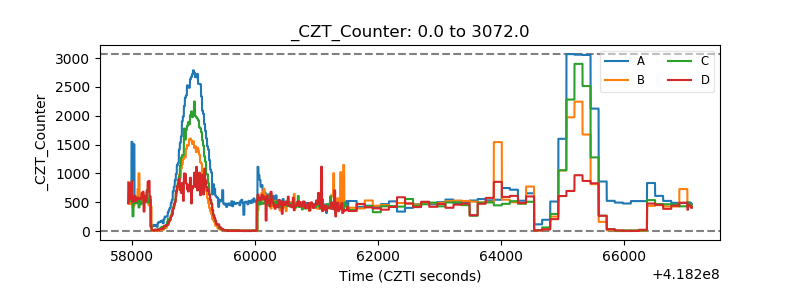 |
| +2.5 Volts monitor | 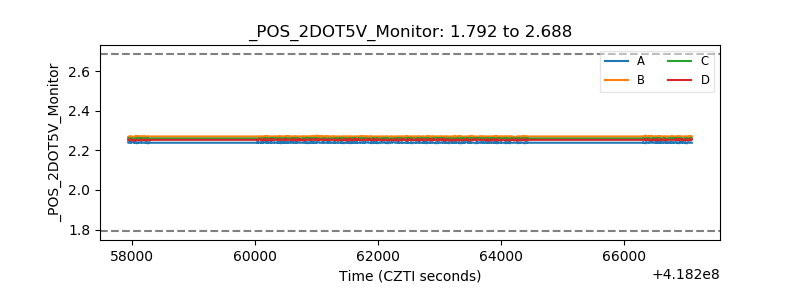 |
| +5 Volts monitor | 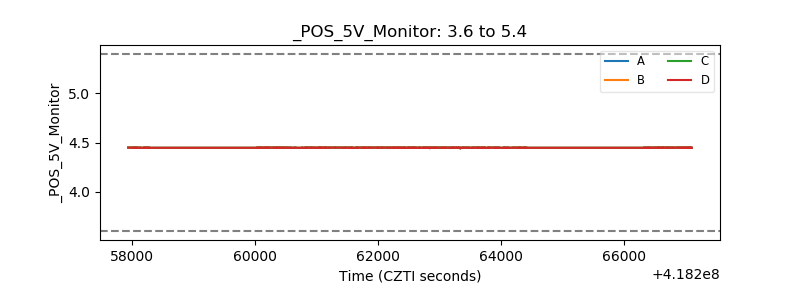 |
| _ROLL_ROT | 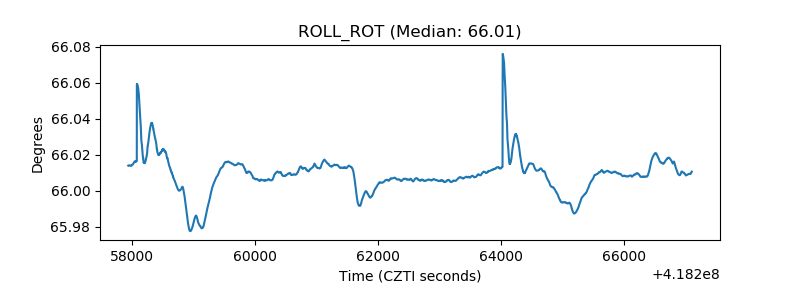 |
| _Roll_DEC | 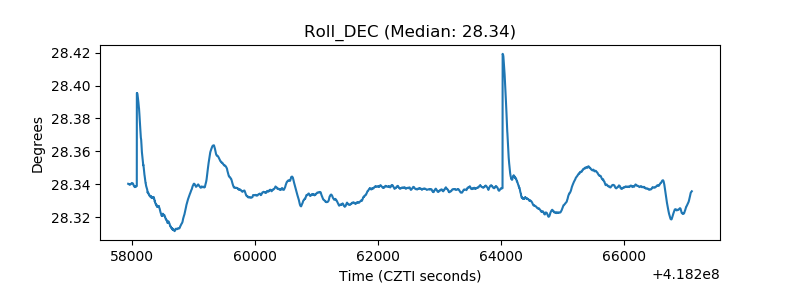 |
| _Roll_RA | 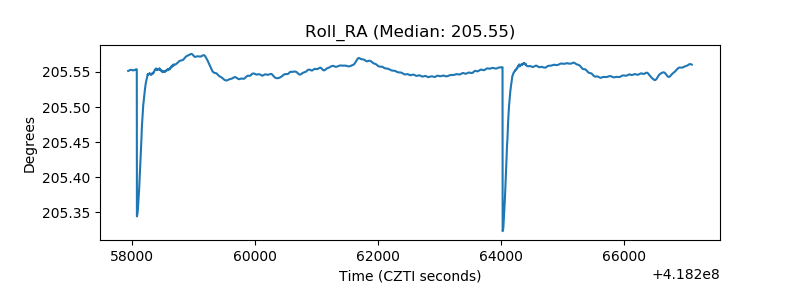 |
| Veto Counter | 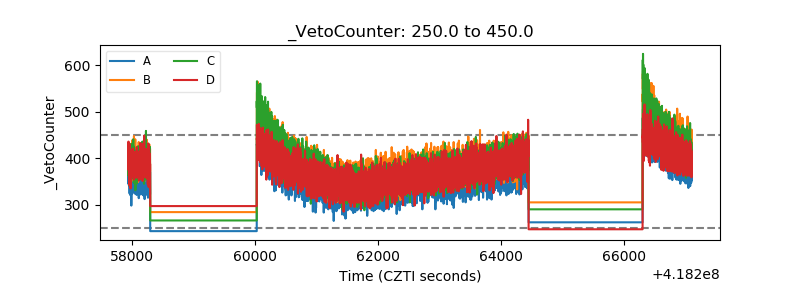 |