| Param | Original file | Final file |
|---|---|---|
| Filename | modeM0/AS1A12_029T01_9000005556_40633cztM0_level2.fits | modeM0/AS1A12_029T01_9000005556_40633cztM0_level2_quad_clean.evt |
| Size (bytes) | 287,095,680 | 87,638,400 |
| Size | 273.8 MB | 83.6 MB |
| Events in quadrant A | 2,719,033 | 595,383 |
| Events in quadrant B | 2,531,198 | 618,084 |
| Events in quadrant C | 2,470,961 | 580,626 |
| Events in quadrant D | 2,510,239 | 504,016 |
| Mode M0 | |||
|---|---|---|---|
| Quadrant | BADHDUFLAG | Total packets | Discarded packets |
| A | 0 | 10985 | 3 |
| B | 0 | 10791 | 2 |
| C | 0 | 10467 | 2 |
| D | 0 | 10886 | 2 |
| Mode M9 | |||
|---|---|---|---|
| Quadrant | BADHDUFLAG | Total packets | Discarded packets |
| A | 0 | 32 | 0 |
| B | 0 | 32 | 0 |
| C | 0 | 32 | 0 |
| D | 0 | 33 | 0 |
| Mode SS | |||
|---|---|---|---|
| Quadrant | BADHDUFLAG | Total packets | Discarded packets |
| A | 0 | 104 | 0 |
| B | 0 | 104 | 0 |
| C | 0 | 104 | 0 |
| D | 0 | 104 | 0 |
| Quadrant | Total seconds | Saturated seconds | Saturation percentage |
|---|---|---|---|
| A | 5071 | 8 | 0.157760% |
| B | 5071 | 25 | 0.492999% |
| C | 5071 | 8 | 0.157760% |
| D | 5071 | 347 | 6.842832% |
Noise dominated data is calculated using 1-second bins in cleaned event files. If a bin has >2000 counts, and if more than 50% of those come from <1% of pixels, then it is considered to be noise-dominated and hence unusable.
| Quadrant | # 1 sec bins | Bins with >0 counts | Bins with >2000 counts | High rate bins dominated by noise | Noise dominated (total time) | Noise dominated (detector-on time) | Marked lightcurve |
|---|---|---|---|---|---|---|---|
| A | 7044 | 5072 | 4 | 4 | 0.06% | 0.08% | 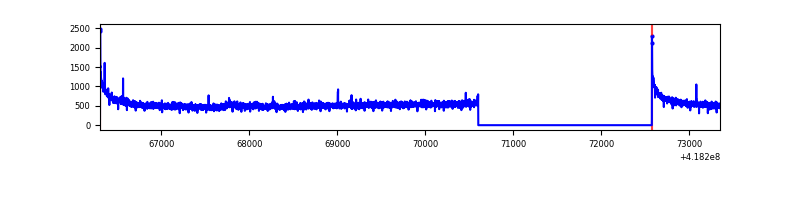 |
| B | 7044 | 5072 | 17 | 17 | 0.24% | 0.34% | 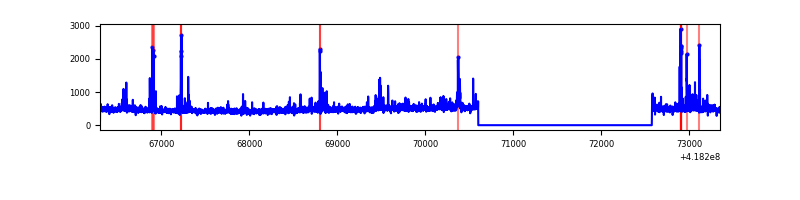 |
| C | 7044 | 5072 | 3 | 3 | 0.04% | 0.06% | 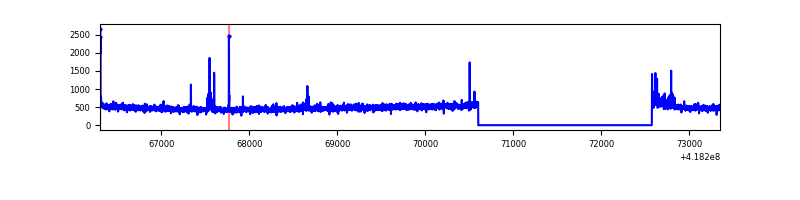 |
| D | 7043 | 5070 | 28 | 28 | 0.40% | 0.55% | 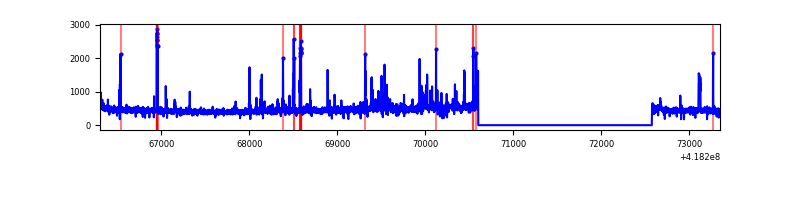 |
Top three noisy pixels from each quadrant. If the there are fewer than three noisy pixels in the level2.evt file, extra rows are filled as -1
| Pixel properties | Quadrant properties | ||||||
|---|---|---|---|---|---|---|---|
| Quadrant | DetID | PixID | Counts | Sigma | Mean | Median | Sigma |
| A | 10 | 83 | 453149 | 3842.11 | 576 | 566 | 117.8 |
| A | 15 | 223 | 33082 | 276.04 | 576 | 566 | 117.8 |
| A | 3 | 137 | 6262 | 48.35 | 576 | 566 | 117.8 |
| B | 0 | 229 | 117040 | 1054.61 | 574 | 559 | 110.4 |
| B | 5 | 255 | 76746 | 689.79 | 574 | 559 | 110.4 |
| B | 0 | 190 | 45873 | 410.27 | 574 | 559 | 110.4 |
| C | 15 | 214 | 223614 | 1726.37 | 555 | 558 | 129.2 |
| C | 14 | 254 | 63854 | 489.89 | 555 | 558 | 129.2 |
| C | 0 | 10 | 11521 | 84.85 | 555 | 558 | 129.2 |
| D | 12 | 191 | 161659 | 1235.17 | 534 | 520 | 130.5 |
| D | 2 | 250 | 81348 | 619.56 | 534 | 520 | 130.5 |
| D | 13 | 249 | 50484 | 382.99 | 534 | 520 | 130.5 |
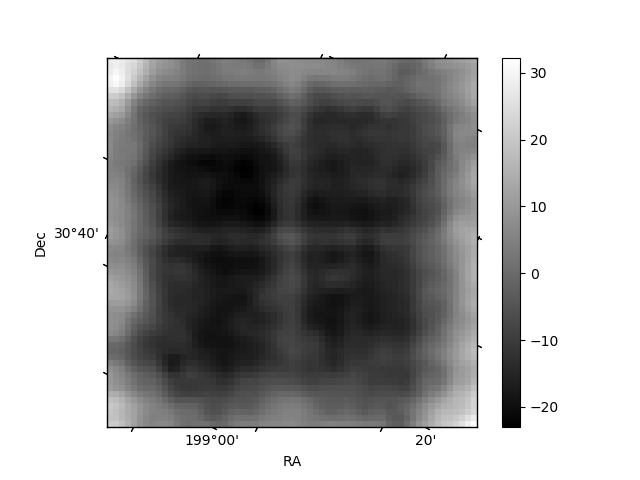
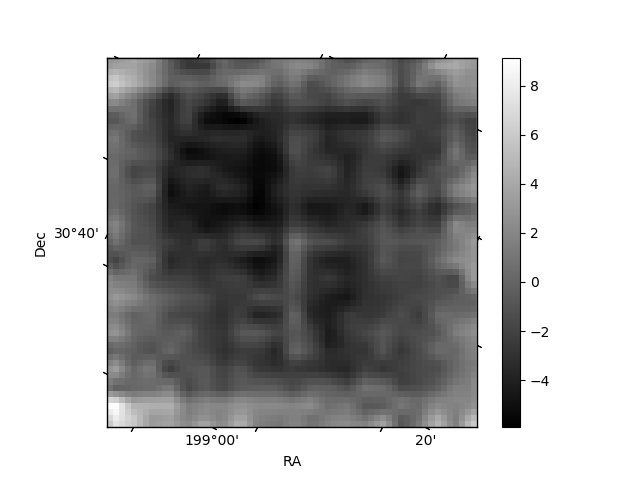
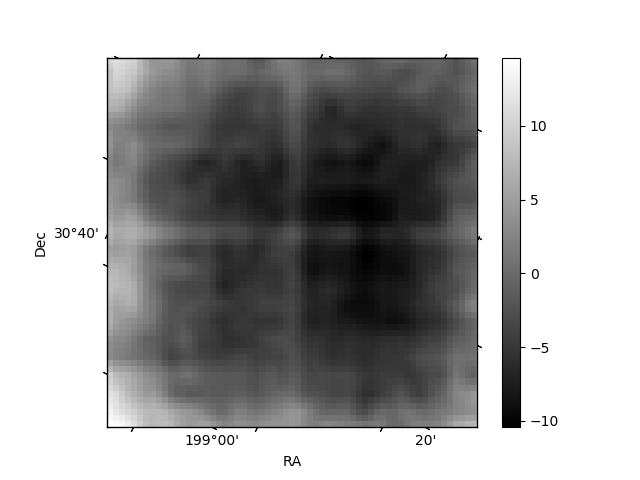
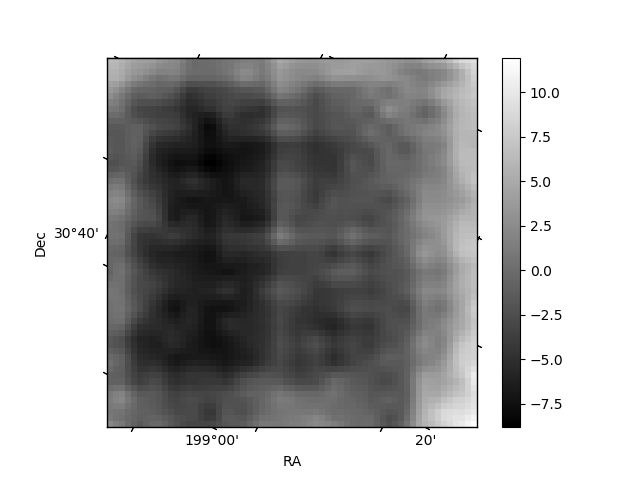
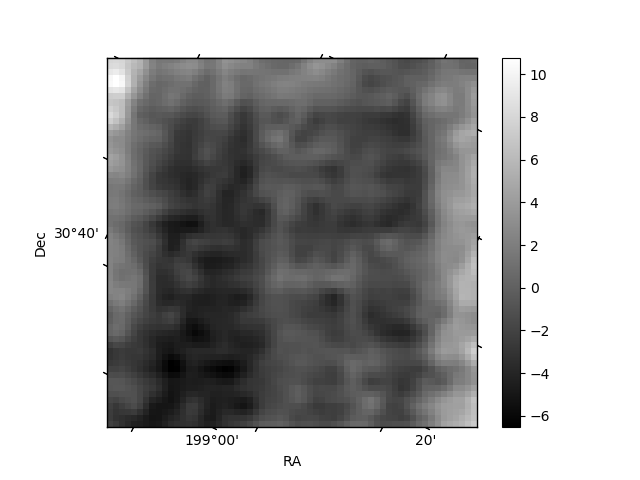
Histogram calculated using DETX and DETY for each event in the final _common_clean file
| Quadrant A | 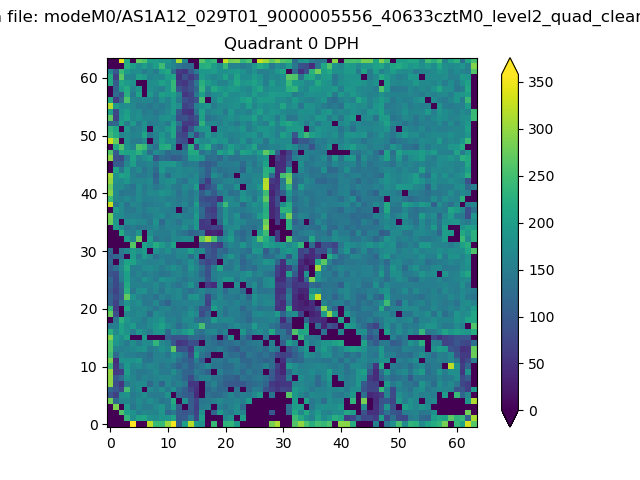 |
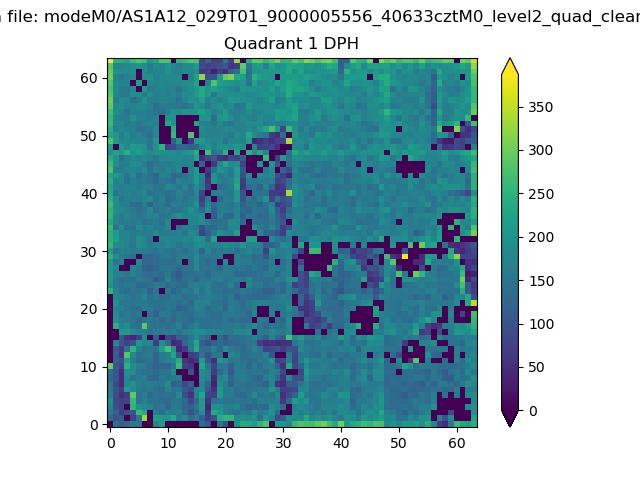 |
Quadrant B |
|---|---|---|---|
| Quadrant D | 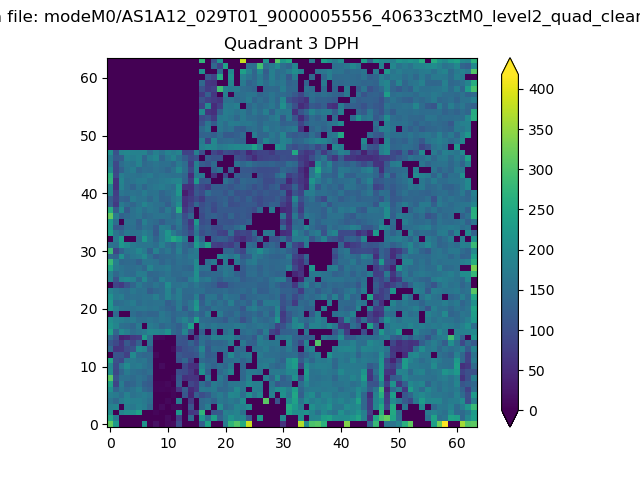 |
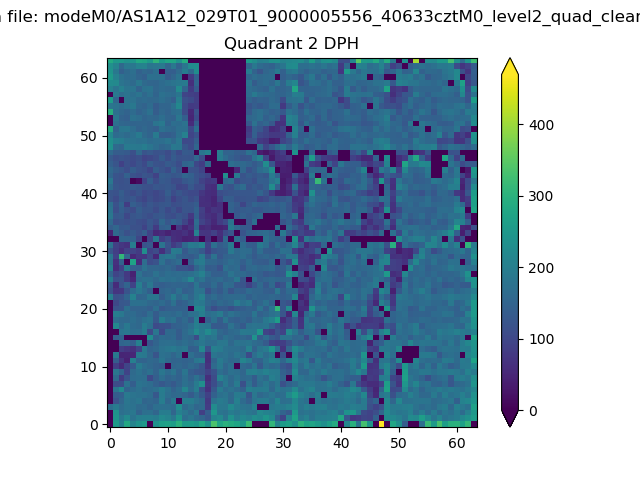 |
Quadrant C |
| Plot type | Count rate plots | Images |
|---|---|---|
| Comparison with Poisson distribution Blue bars denote a histogram of data divided into 1 sec bins. Red curve is a Poisson curve with rate = median count rate of data. |
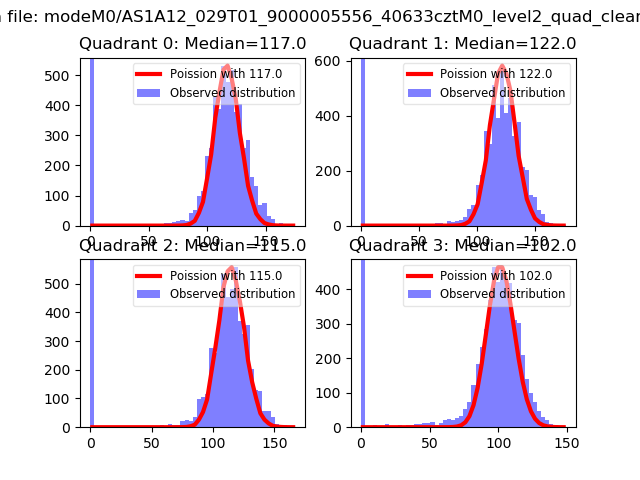 |
 |
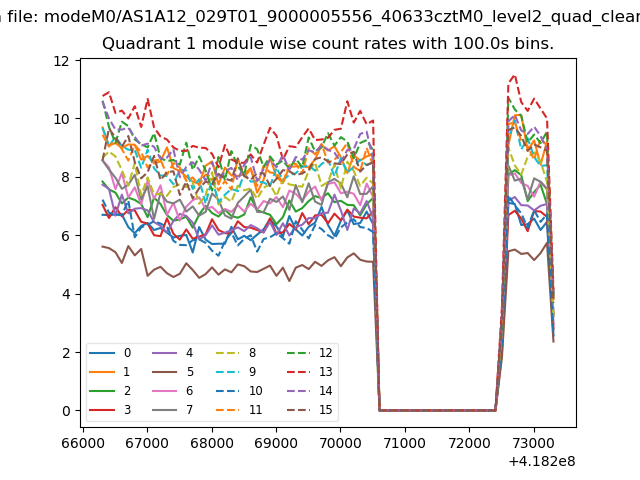
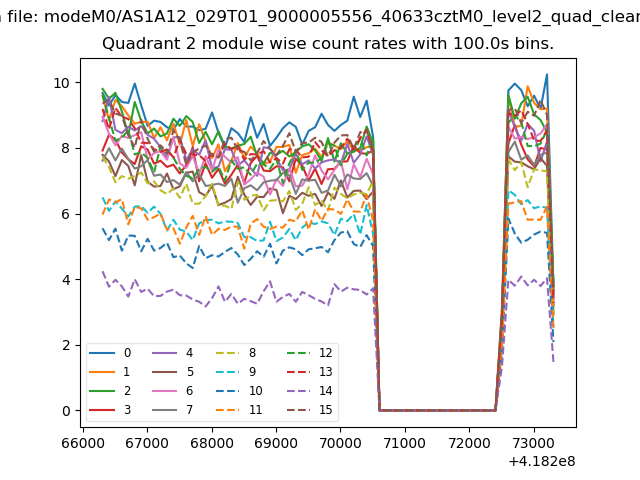
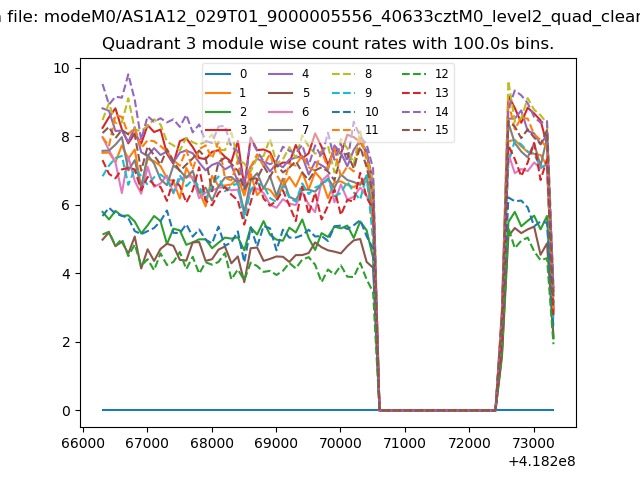
| Quadrant-wise count rates Data is divided into 100 sec bins |
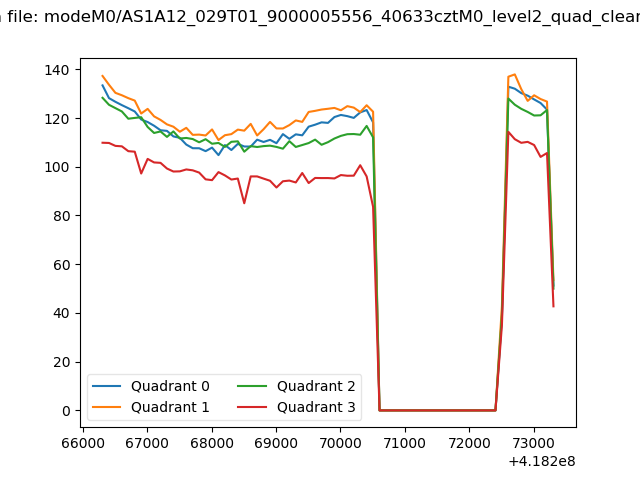 |
|
| Module-wise count rates for Quadrant A Data is divided into 100 sec bins |
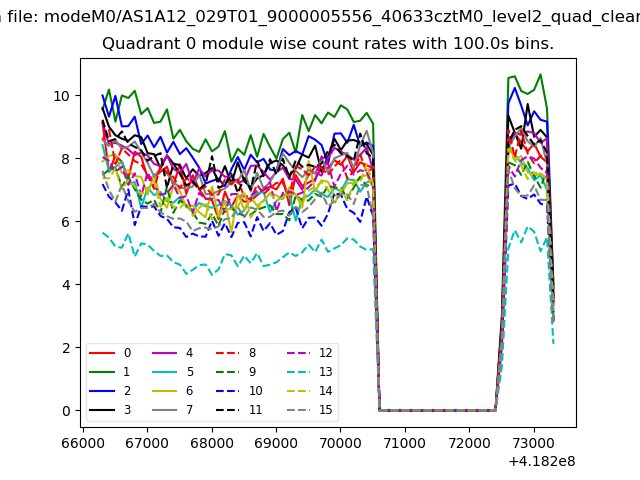 |
 |
| Module-wise count rates for Quadrant B Data is divided into 100 sec bins |
 |
 |
| Module-wise count rates for Quadrant C Data is divided into 100 sec bins |
 |
 |
| Module-wise count rates for Quadrant D Data is divided into 100 sec bins |
 |
 |
| Parameter | Plot |
|---|---|
| CZT HV Monitor | 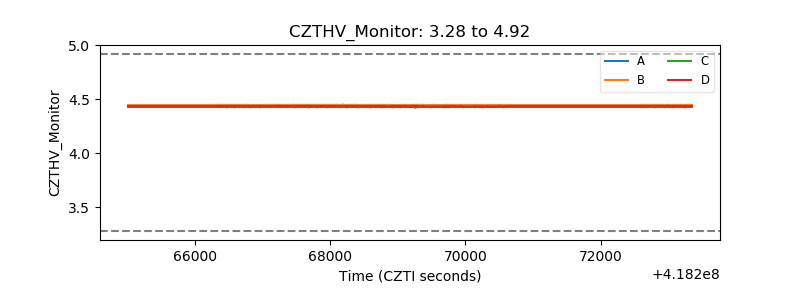 |
| D_VDD | 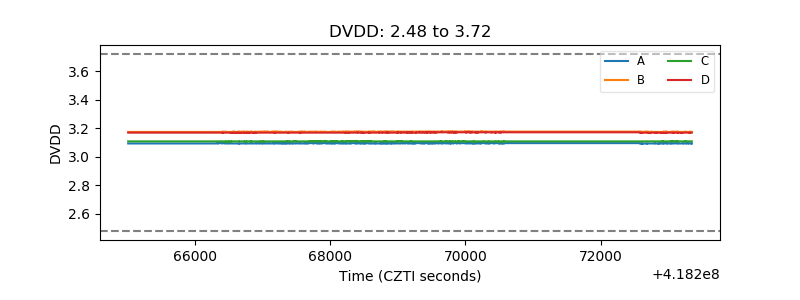 |
| Temperature 1 | 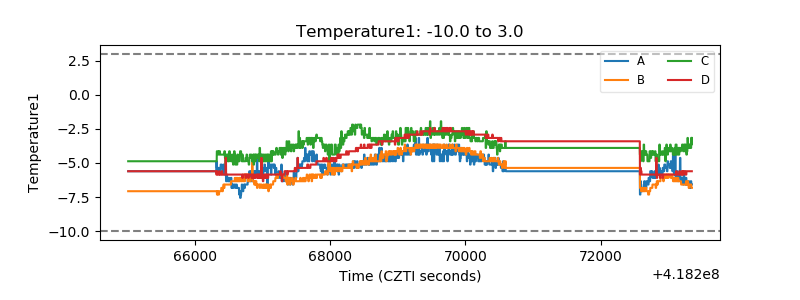 |
| Veto HV Monitor | 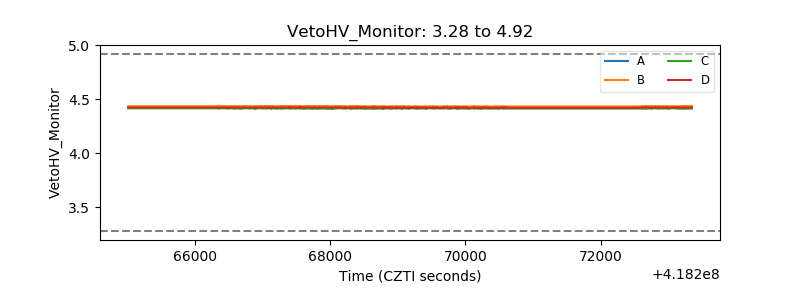 |
| Veto LLD | 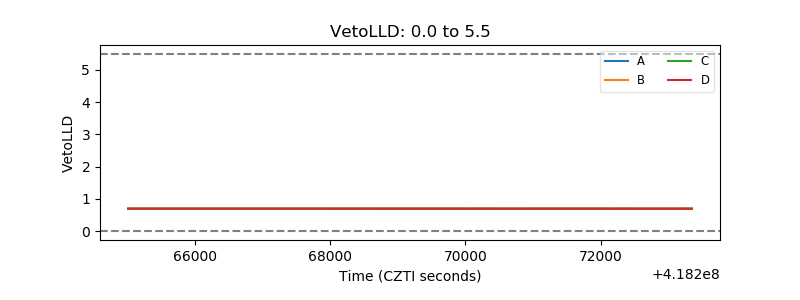 |
| Alpha Counter | 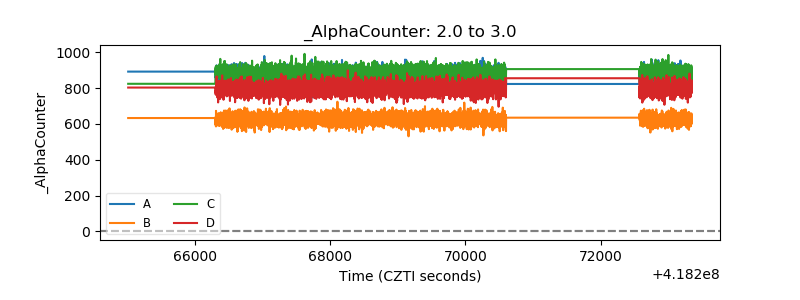 |
| _CPM_Rate | 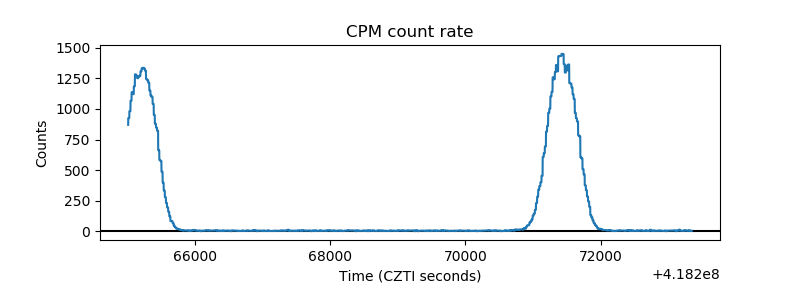 |
| CZT Counter | 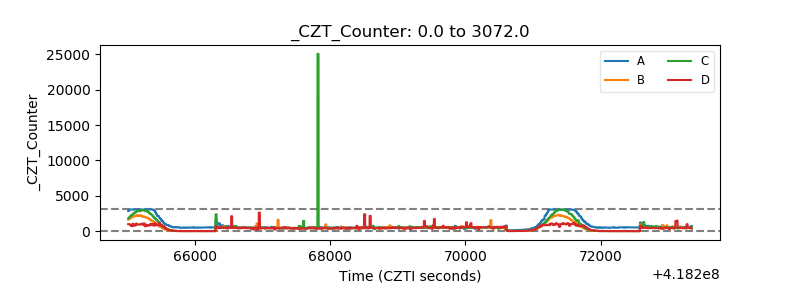 |
| +2.5 Volts monitor | 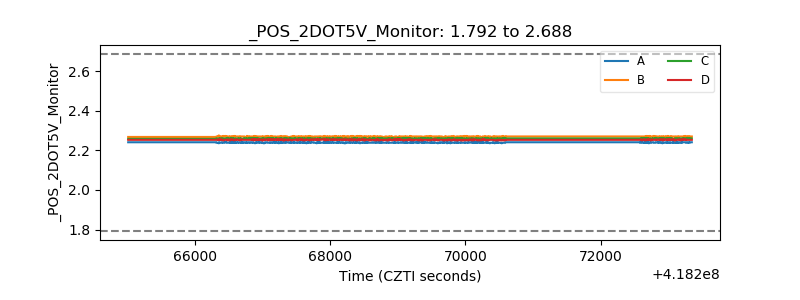 |
| +5 Volts monitor | 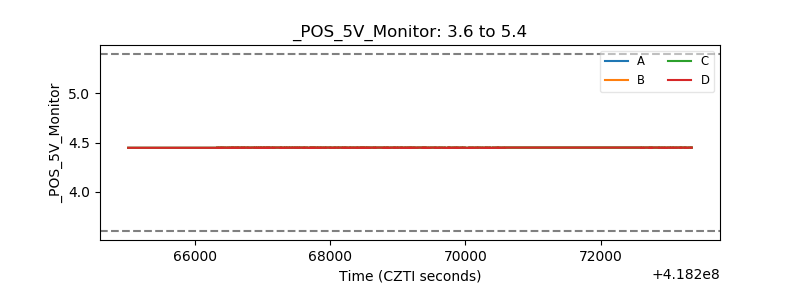 |
| _ROLL_ROT | 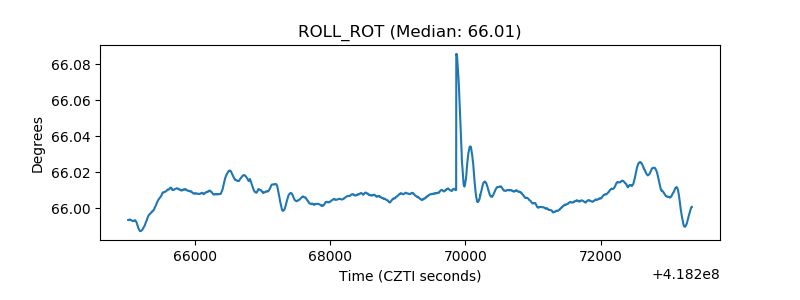 |
| _Roll_DEC | 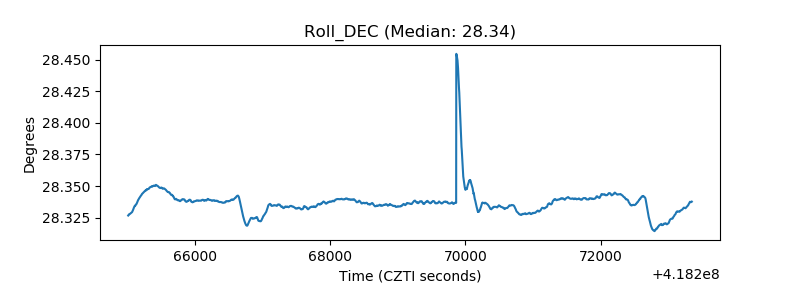 |
| _Roll_RA | 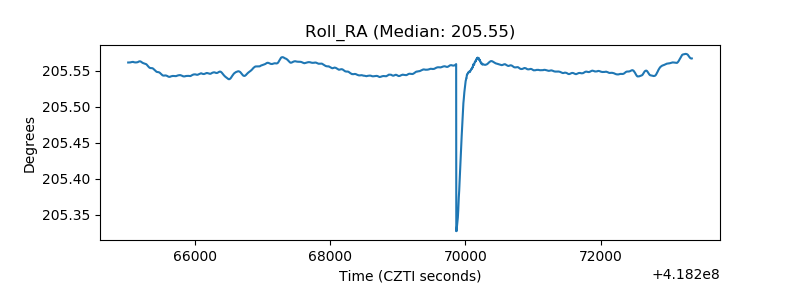 |
| Veto Counter | 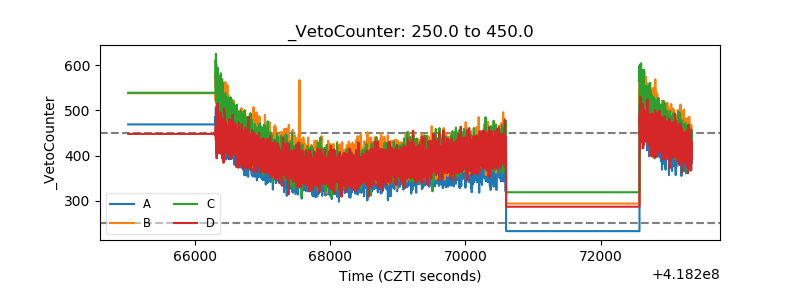 |