| Param | Original file | Final file |
|---|---|---|
| Filename | modeM0/AS1A12_029T01_9000005556_40634cztM0_level2.fits | modeM0/AS1A12_029T01_9000005556_40634cztM0_level2_quad_clean.evt |
| Size (bytes) | 296,524,800 | 87,531,840 |
| Size | 282.8 MB | 83.5 MB |
| Events in quadrant A | 2,713,753 | 599,923 |
| Events in quadrant B | 2,706,198 | 618,287 |
| Events in quadrant C | 2,464,505 | 580,060 |
| Events in quadrant D | 2,702,736 | 502,546 |
| Mode M0 | |||
|---|---|---|---|
| Quadrant | BADHDUFLAG | Total packets | Discarded packets |
| A | 0 | 10917 | 3 |
| B | 0 | 11226 | 2 |
| C | 0 | 10304 | 2 |
| D | 0 | 11348 | 2 |
| Mode M9 | |||
|---|---|---|---|
| Quadrant | BADHDUFLAG | Total packets | Discarded packets |
| A | 0 | 28 | 0 |
| B | 0 | 28 | 0 |
| C | 0 | 28 | 0 |
| D | 0 | 29 | 0 |
| Mode SS | |||
|---|---|---|---|
| Quadrant | BADHDUFLAG | Total packets | Discarded packets |
| A | 0 | 102 | 0 |
| B | 0 | 102 | 0 |
| C | 0 | 102 | 0 |
| D | 0 | 102 | 0 |
| Quadrant | Total seconds | Saturated seconds | Saturation percentage |
|---|---|---|---|
| A | 4986 | 10 | 0.200562% |
| B | 4986 | 46 | 0.922583% |
| C | 4986 | 2 | 0.040112% |
| D | 4986 | 366 | 7.340554% |
Noise dominated data is calculated using 1-second bins in cleaned event files. If a bin has >2000 counts, and if more than 50% of those come from <1% of pixels, then it is considered to be noise-dominated and hence unusable.
| Quadrant | # 1 sec bins | Bins with >0 counts | Bins with >2000 counts | High rate bins dominated by noise | Noise dominated (total time) | Noise dominated (detector-on time) | Marked lightcurve |
|---|---|---|---|---|---|---|---|
| A | 7049 | 4987 | 4 | 4 | 0.06% | 0.08% | 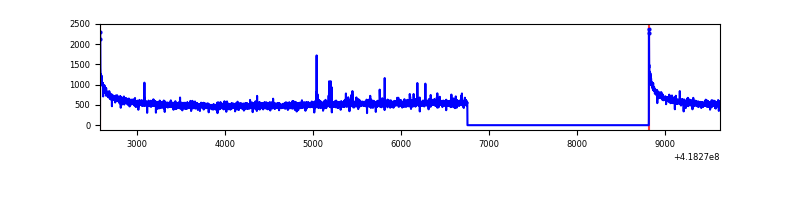 |
| B | 7049 | 4987 | 27 | 27 | 0.38% | 0.54% | 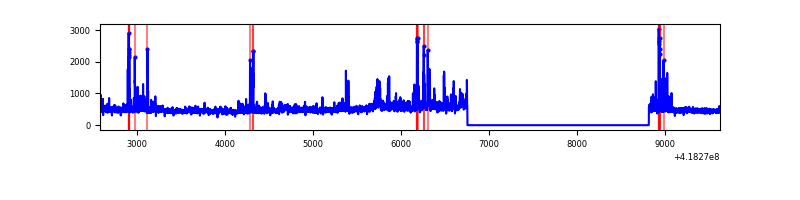 |
| C | 7049 | 4987 | 0 | 0 | 0.00% | 0.00% | 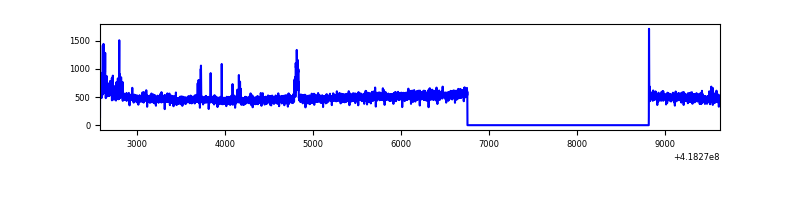 |
| D | 7049 | 4987 | 51 | 51 | 0.72% | 1.02% | 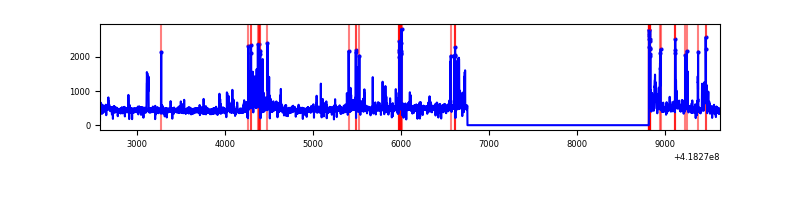 |
Top three noisy pixels from each quadrant. If the there are fewer than three noisy pixels in the level2.evt file, extra rows are filled as -1
| Pixel properties | Quadrant properties | ||||||
|---|---|---|---|---|---|---|---|
| Quadrant | DetID | PixID | Counts | Sigma | Mean | Median | Sigma |
| A | 10 | 83 | 450419 | 3815.38 | 580 | 568 | 117.9 |
| A | 2 | 79 | 26375 | 218.88 | 580 | 568 | 117.9 |
| A | 3 | 137 | 6128 | 47.16 | 580 | 568 | 117.9 |
| B | 5 | 255 | 151091 | 1363.39 | 572 | 557 | 110.4 |
| B | 0 | 190 | 138190 | 1246.55 | 572 | 557 | 110.4 |
| B | 0 | 229 | 126232 | 1138.24 | 572 | 557 | 110.4 |
| C | 15 | 214 | 223389 | 1729.98 | 554 | 559 | 128.8 |
| C | 14 | 254 | 70343 | 541.78 | 554 | 559 | 128.8 |
| C | 0 | 10 | 5347 | 37.17 | 554 | 559 | 128.8 |
| D | 13 | 249 | 161675 | 1219.08 | 534 | 520 | 132.2 |
| D | 2 | 250 | 147364 | 1110.82 | 534 | 520 | 132.2 |
| D | 12 | 191 | 142429 | 1073.49 | 534 | 520 | 132.2 |
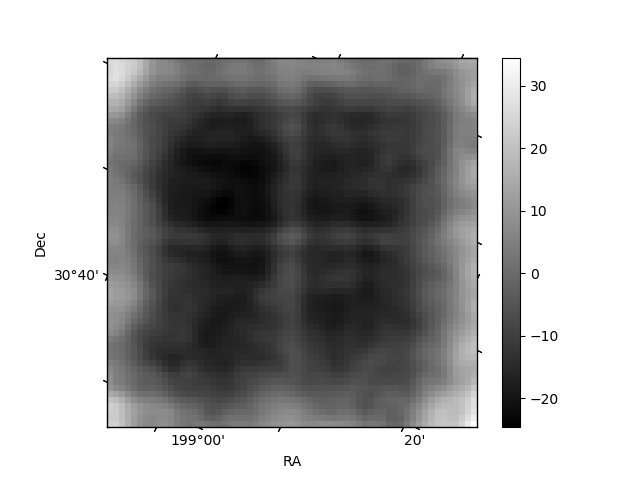
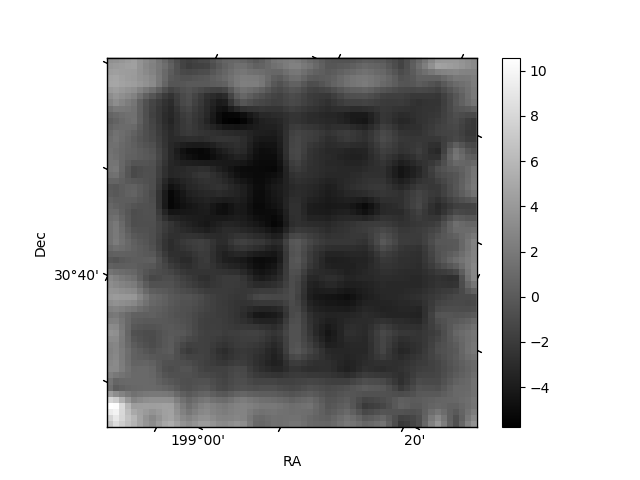
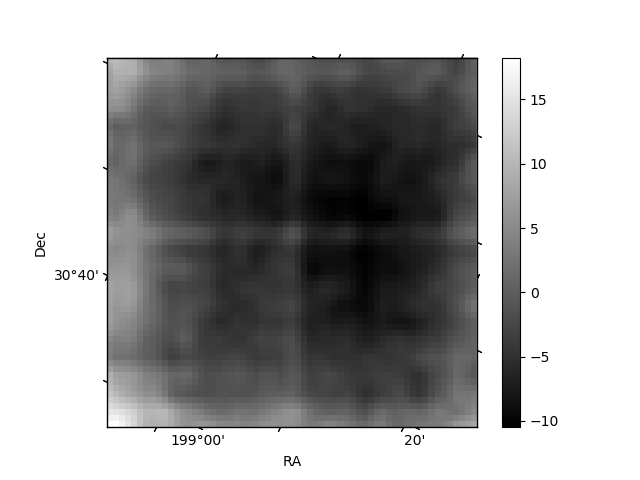
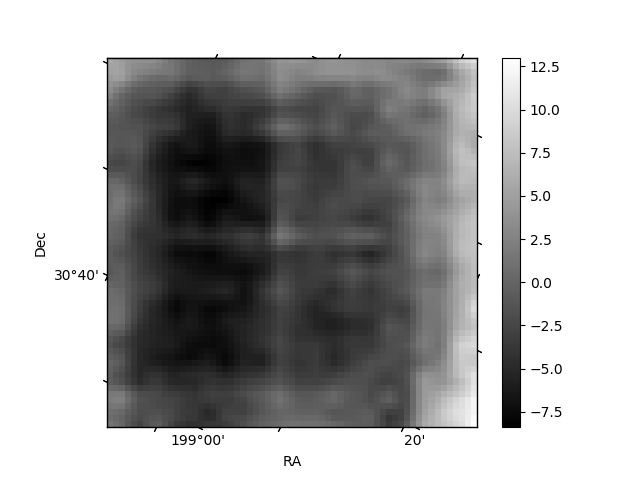
Histogram calculated using DETX and DETY for each event in the final _common_clean file
| Quadrant A | 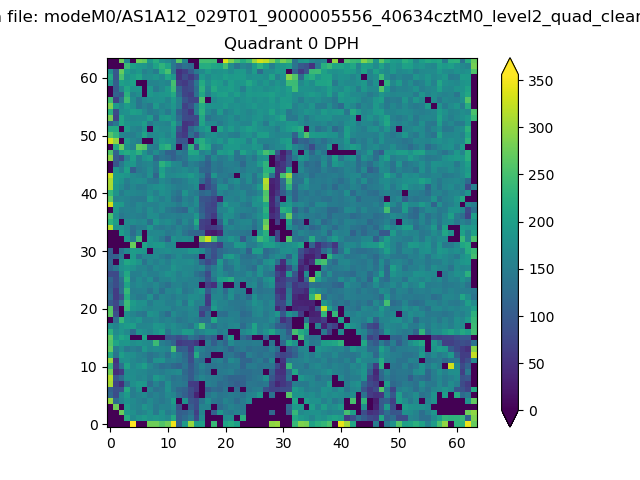 |
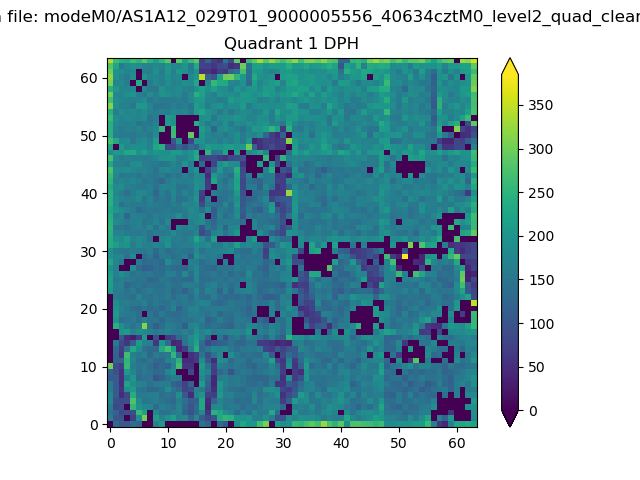 |
Quadrant B |
|---|---|---|---|
| Quadrant D | 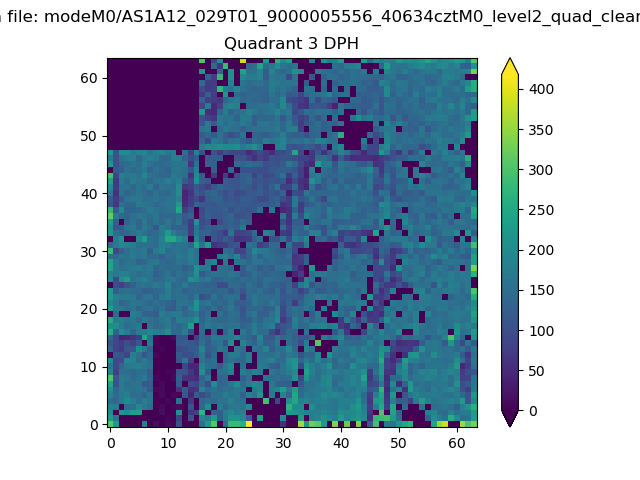 |
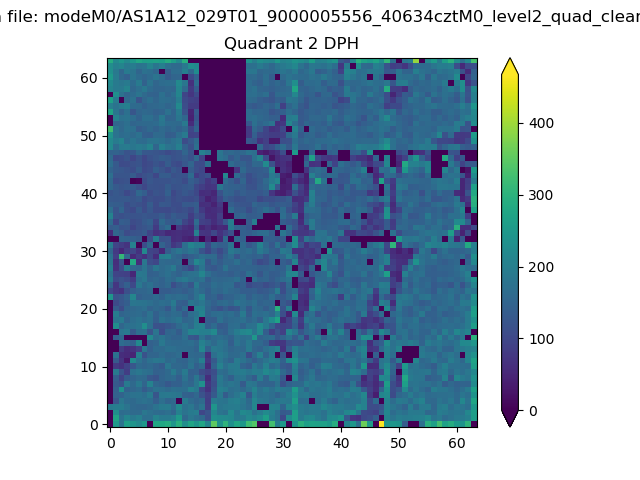 |
Quadrant C |
| Plot type | Count rate plots | Images |
|---|---|---|
| Comparison with Poisson distribution Blue bars denote a histogram of data divided into 1 sec bins. Red curve is a Poisson curve with rate = median count rate of data. |
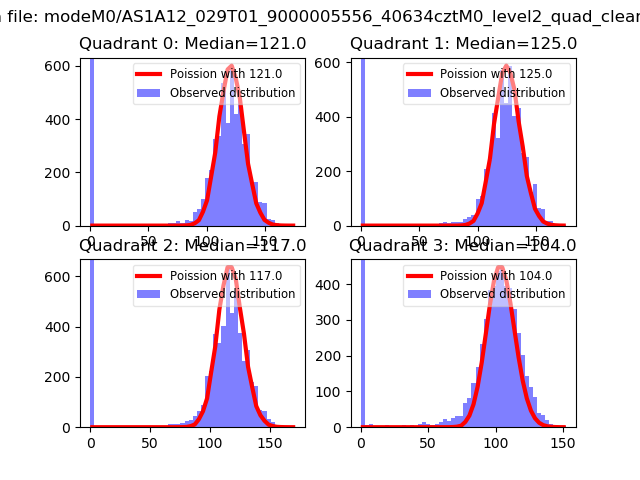 |
 |
| Quadrant-wise count rates Data is divided into 100 sec bins |
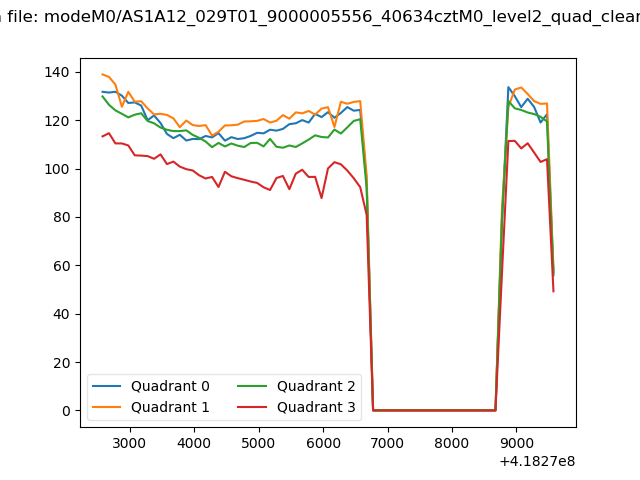 |
|
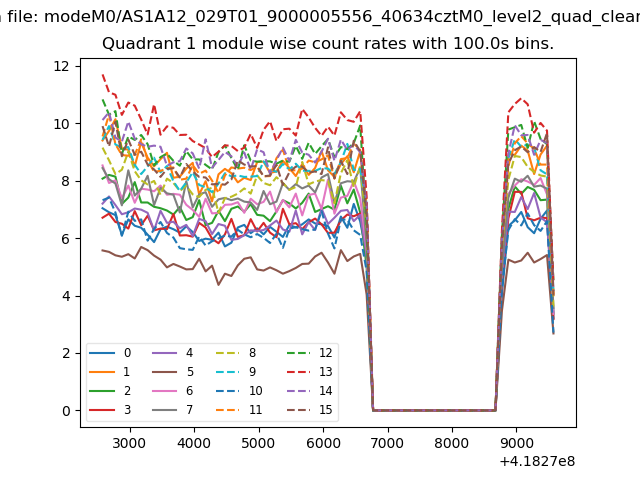
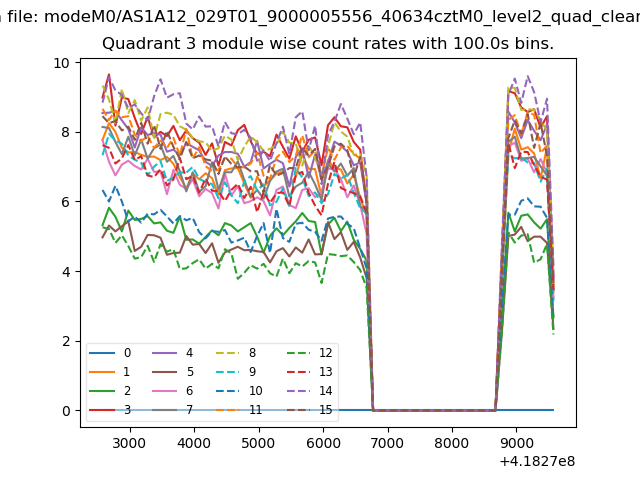
| Module-wise count rates for Quadrant A Data is divided into 100 sec bins |
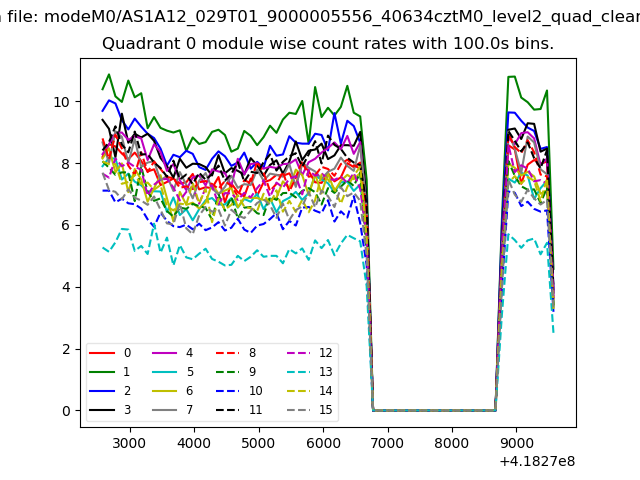 |
 |
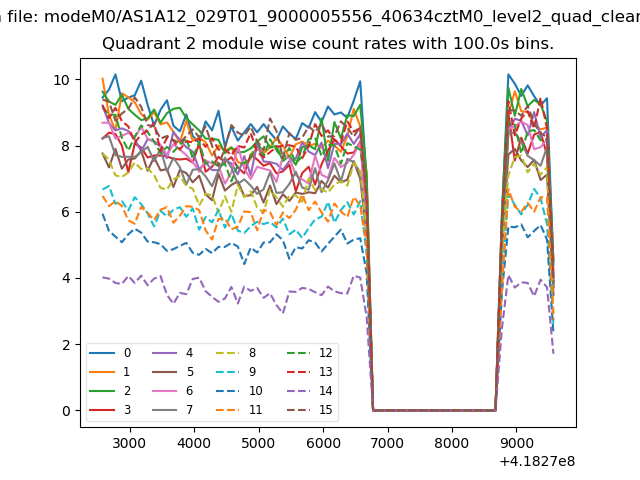
| Module-wise count rates for Quadrant B Data is divided into 100 sec bins |
 |
 |
| Module-wise count rates for Quadrant C Data is divided into 100 sec bins |
 |
 |
| Module-wise count rates for Quadrant D Data is divided into 100 sec bins |
 |
 |
| Parameter | Plot |
|---|---|
| CZT HV Monitor | 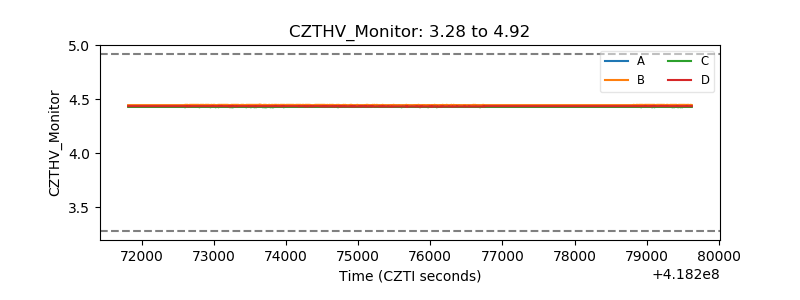 |
| D_VDD | 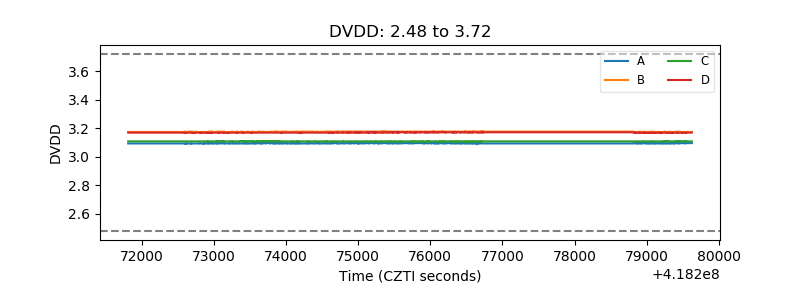 |
| Temperature 1 | 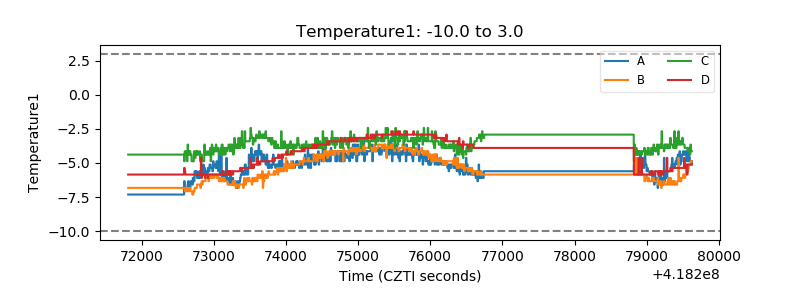 |
| Veto HV Monitor | 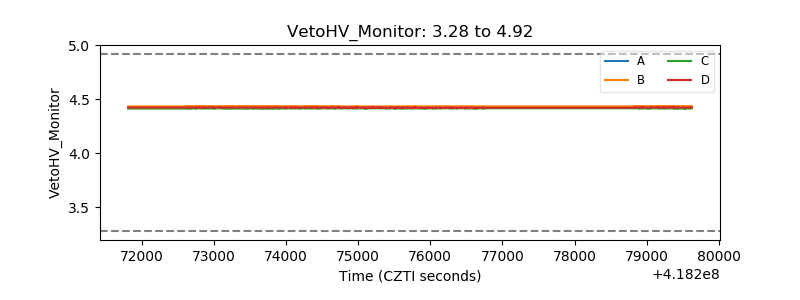 |
| Veto LLD | 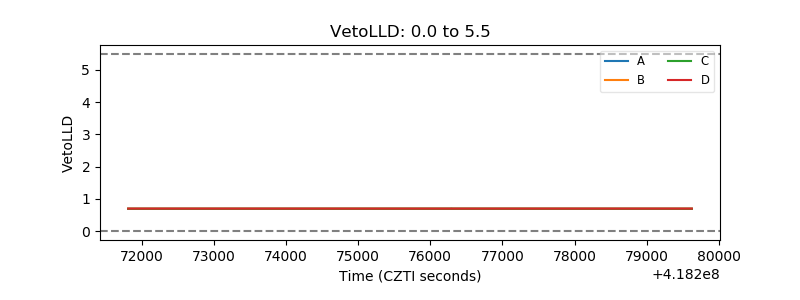 |
| Alpha Counter | 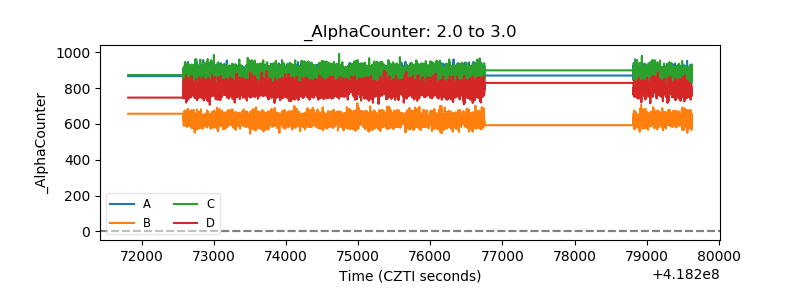 |
| _CPM_Rate | 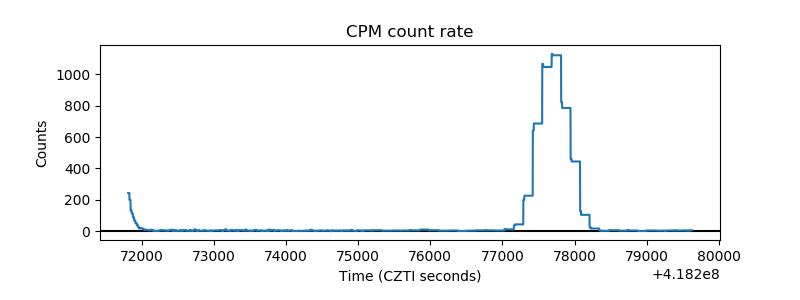 |
| CZT Counter | 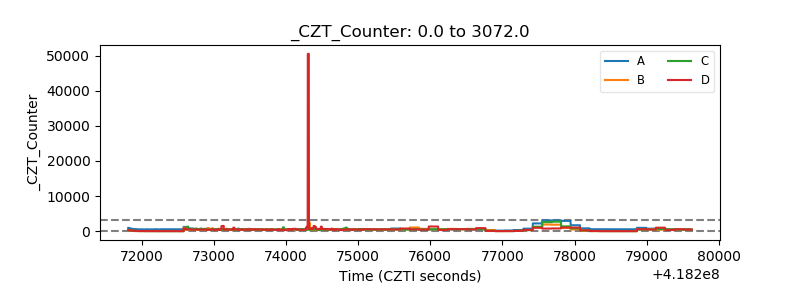 |
| +2.5 Volts monitor |  |
| +5 Volts monitor | 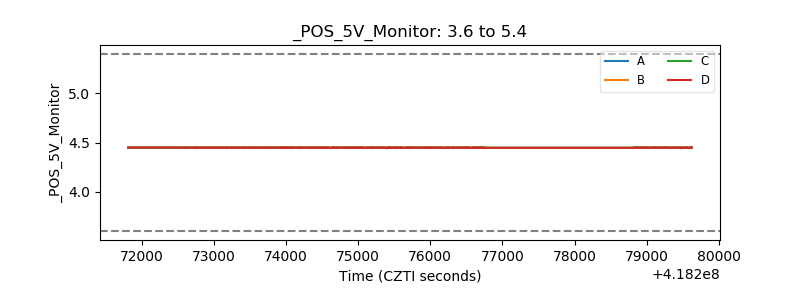 |
| _ROLL_ROT | 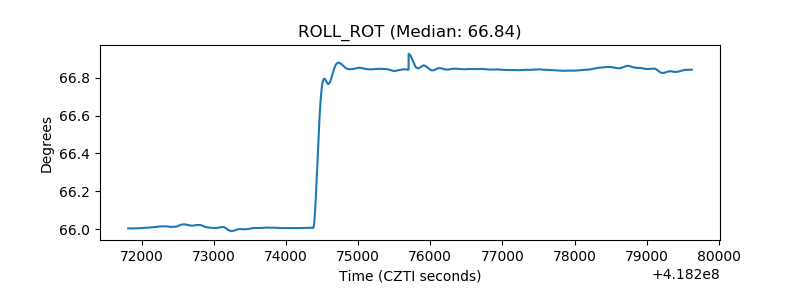 |
| _Roll_DEC | 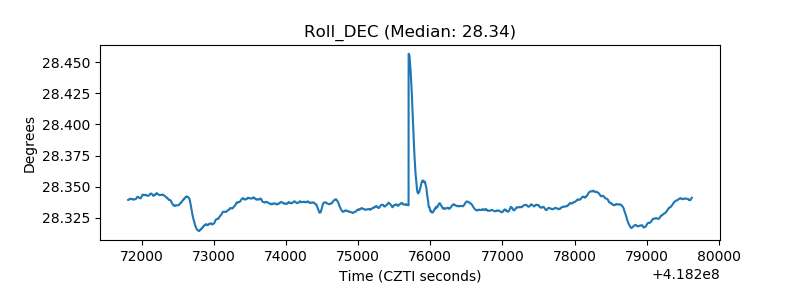 |
| _Roll_RA | 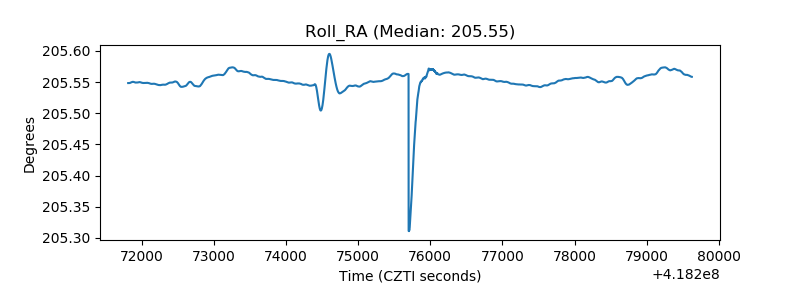 |
| Veto Counter | 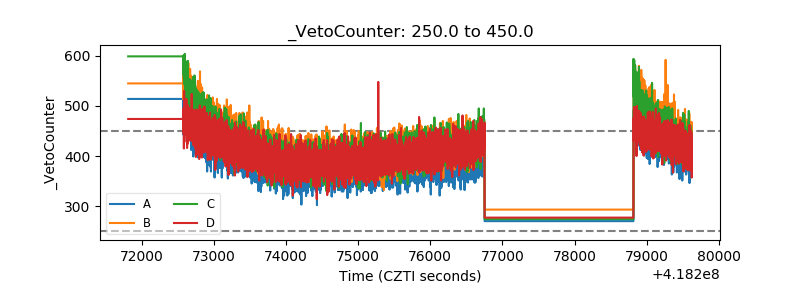 |