| Param | Original file | Final file |
|---|---|---|
| Filename | modeM0/AS1A12_029T01_9000005556_40636cztM0_level2.fits | modeM0/AS1A12_029T01_9000005556_40636cztM0_level2_quad_clean.evt |
| Size (bytes) | 311,362,560 | 85,121,280 |
| Size | 296.9 MB | 81.2 MB |
| Events in quadrant A | 2,729,163 | 582,911 |
| Events in quadrant B | 2,599,548 | 603,656 |
| Events in quadrant C | 2,479,747 | 563,282 |
| Events in quadrant D | 3,320,884 | 471,575 |
| Mode M0 | |||
|---|---|---|---|
| Quadrant | BADHDUFLAG | Total packets | Discarded packets |
| A | 0 | 11014 | 3 |
| B | 0 | 10993 | 2 |
| C | 0 | 10421 | 2 |
| D | 0 | 13306 | 2 |
| Mode M9 | |||
|---|---|---|---|
| Quadrant | BADHDUFLAG | Total packets | Discarded packets |
| A | 0 | 23 | 0 |
| B | 0 | 23 | 0 |
| C | 0 | 23 | 0 |
| D | 0 | 24 | 0 |
| Mode SS | |||
|---|---|---|---|
| Quadrant | BADHDUFLAG | Total packets | Discarded packets |
| A | 0 | 104 | 0 |
| B | 0 | 104 | 0 |
| C | 0 | 104 | 0 |
| D | 0 | 104 | 0 |
| Quadrant | Total seconds | Saturated seconds | Saturation percentage |
|---|---|---|---|
| A | 5079 | 13 | 0.255956% |
| B | 5079 | 42 | 0.826934% |
| C | 5079 | 9 | 0.177200% |
| D | 5079 | 561 | 11.045481% |
Noise dominated data is calculated using 1-second bins in cleaned event files. If a bin has >2000 counts, and if more than 50% of those come from <1% of pixels, then it is considered to be noise-dominated and hence unusable.
| Quadrant | # 1 sec bins | Bins with >0 counts | Bins with >2000 counts | High rate bins dominated by noise | Noise dominated (total time) | Noise dominated (detector-on time) | Marked lightcurve |
|---|---|---|---|---|---|---|---|
| A | 7172 | 5080 | 3 | 3 | 0.04% | 0.06% | 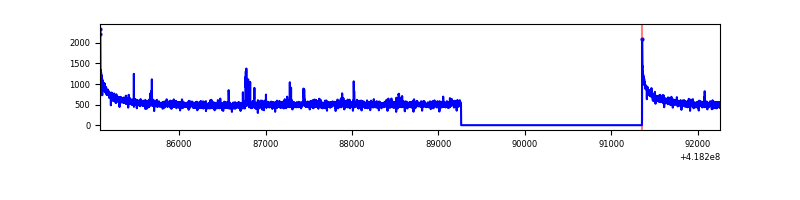 |
| B | 7172 | 5080 | 26 | 26 | 0.36% | 0.51% | 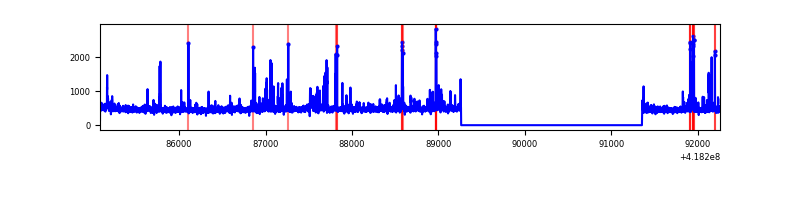 |
| C | 7172 | 5080 | 7 | 7 | 0.10% | 0.14% | 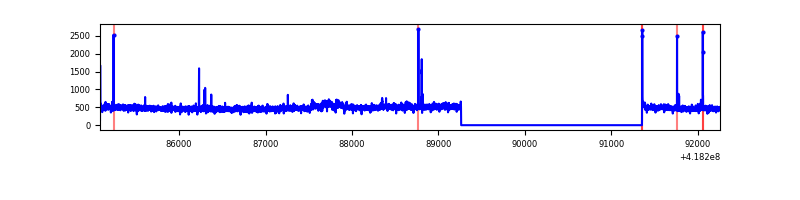 |
| D | 7172 | 5080 | 232 | 232 | 3.23% | 4.57% | 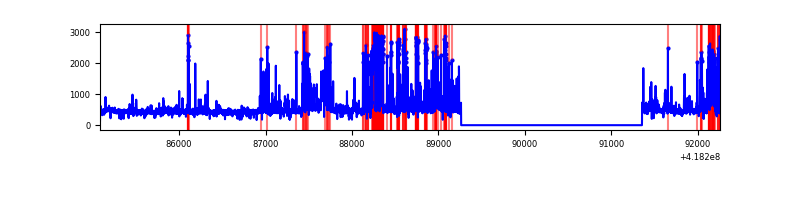 |
Top three noisy pixels from each quadrant. If the there are fewer than three noisy pixels in the level2.evt file, extra rows are filled as -1
| Pixel properties | Quadrant properties | ||||||
|---|---|---|---|---|---|---|---|
| Quadrant | DetID | PixID | Counts | Sigma | Mean | Median | Sigma |
| A | 10 | 83 | 450419 | 3795.75 | 579 | 569 | 118.5 |
| A | 2 | 79 | 40319 | 335.4 | 579 | 569 | 118.5 |
| A | 3 | 137 | 6523 | 50.24 | 579 | 569 | 118.5 |
| B | 0 | 229 | 202930 | 1817.58 | 572 | 557 | 111.3 |
| B | 5 | 255 | 66598 | 593.13 | 572 | 557 | 111.3 |
| B | 0 | 190 | 56231 | 500.03 | 572 | 557 | 111.3 |
| C | 15 | 214 | 226348 | 1746.92 | 556 | 559 | 129.2 |
| C | 14 | 254 | 52271 | 400.09 | 556 | 559 | 129.2 |
| C | 0 | 10 | 13267 | 98.32 | 556 | 559 | 129.2 |
| D | 12 | 227 | 851697 | 6533.05 | 528 | 513 | 130.3 |
| D | 12 | 191 | 137661 | 1052.65 | 528 | 513 | 130.3 |
| D | 5 | 51 | 99771 | 761.83 | 528 | 513 | 130.3 |
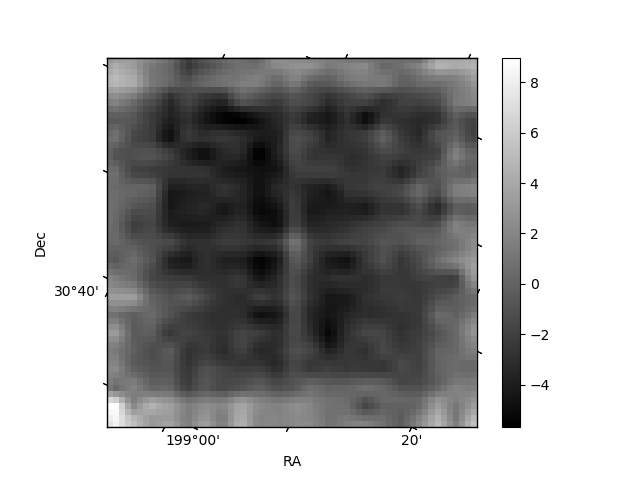
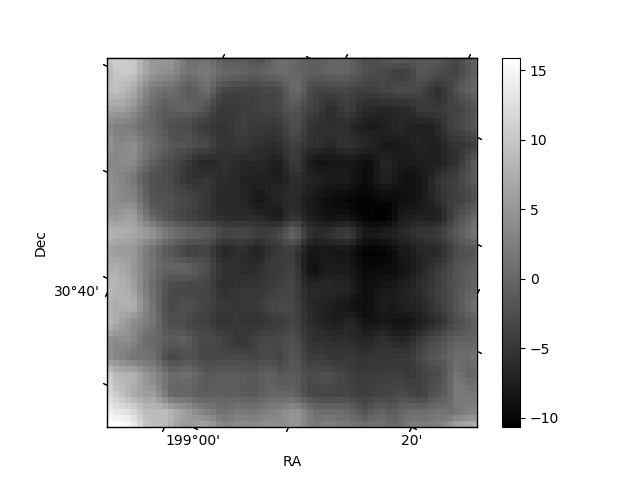
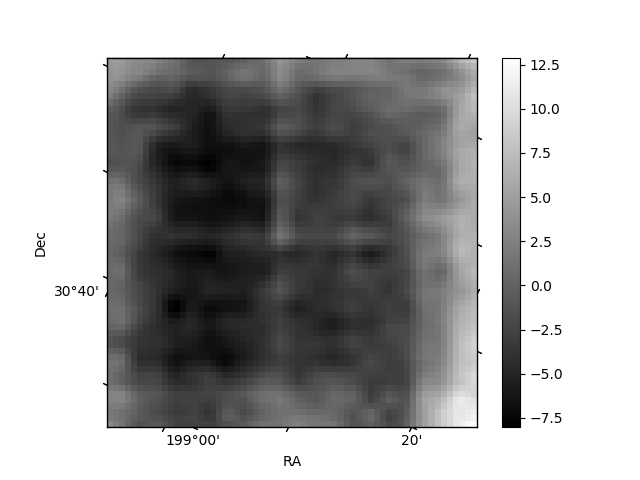
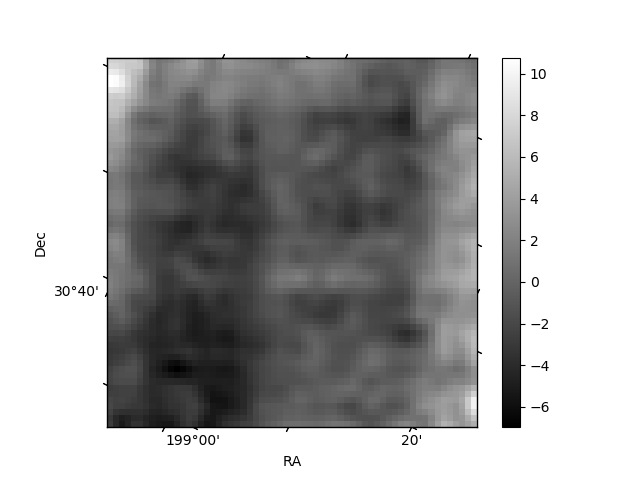
Histogram calculated using DETX and DETY for each event in the final _common_clean file
| Quadrant A | 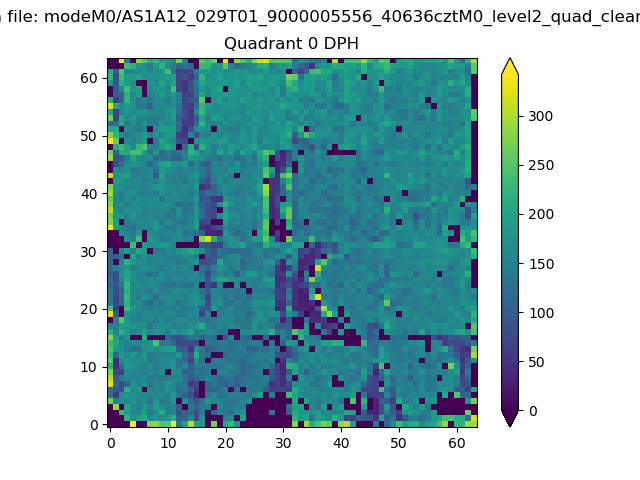 |
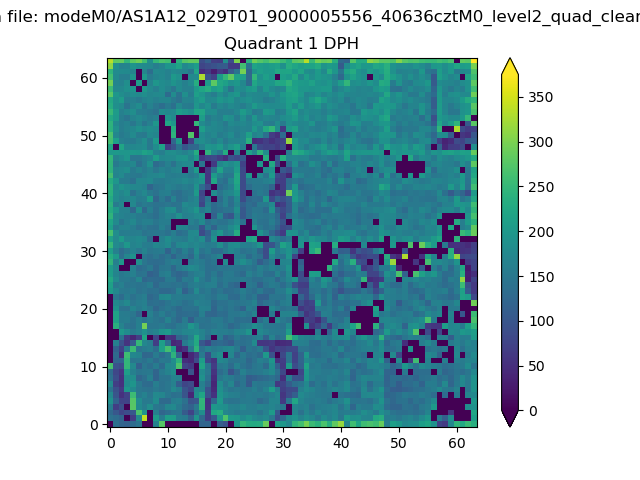 |
Quadrant B |
|---|---|---|---|
| Quadrant D | 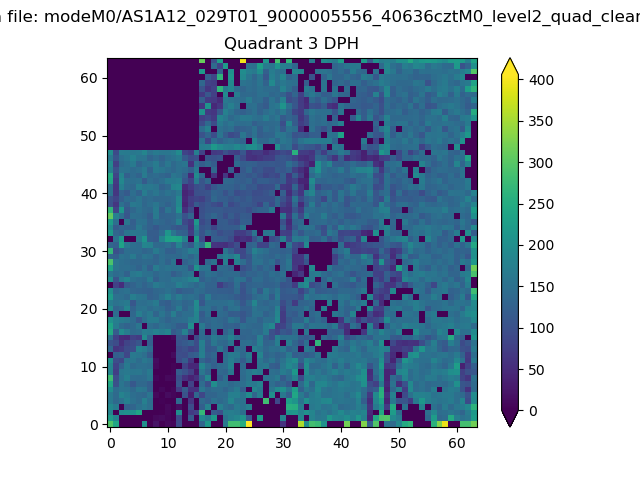 |
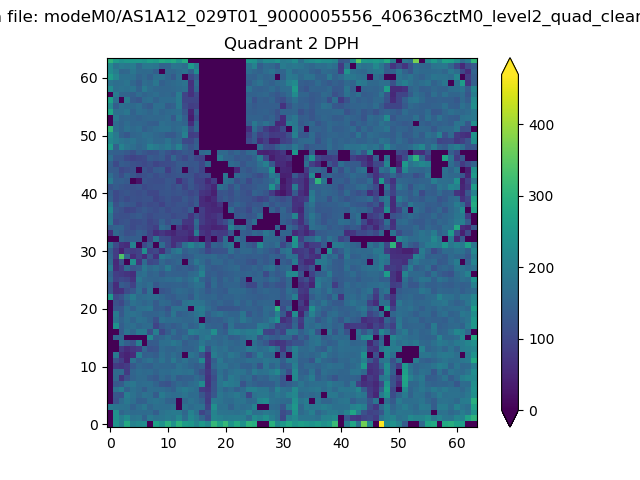 |
Quadrant C |
| Plot type | Count rate plots | Images |
|---|---|---|
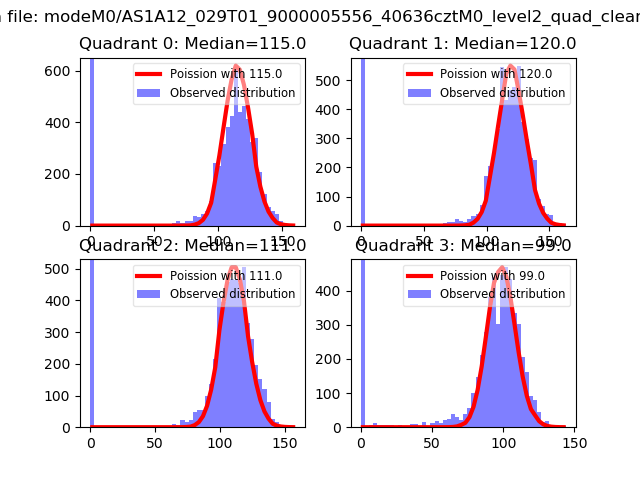
| Comparison with Poisson distribution Blue bars denote a histogram of data divided into 1 sec bins. Red curve is a Poisson curve with rate = median count rate of data. |
 |
 |
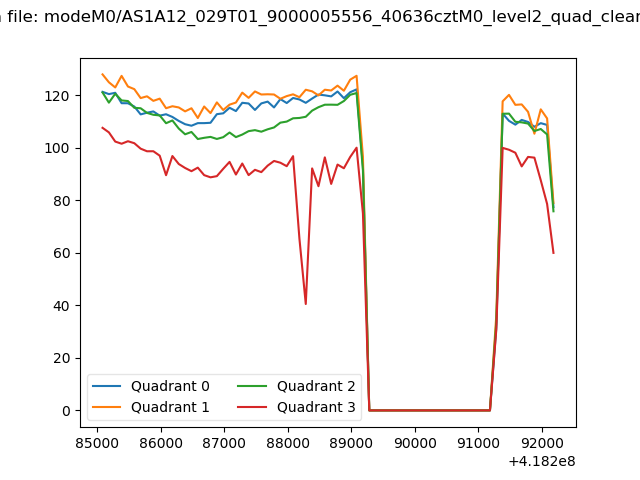
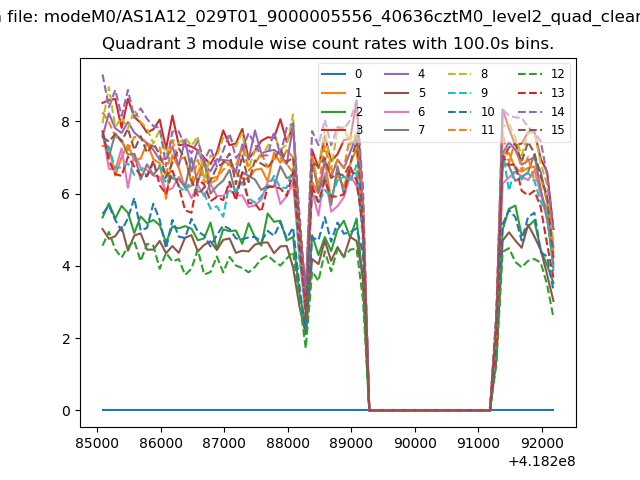
| Quadrant-wise count rates Data is divided into 100 sec bins |
 |
|
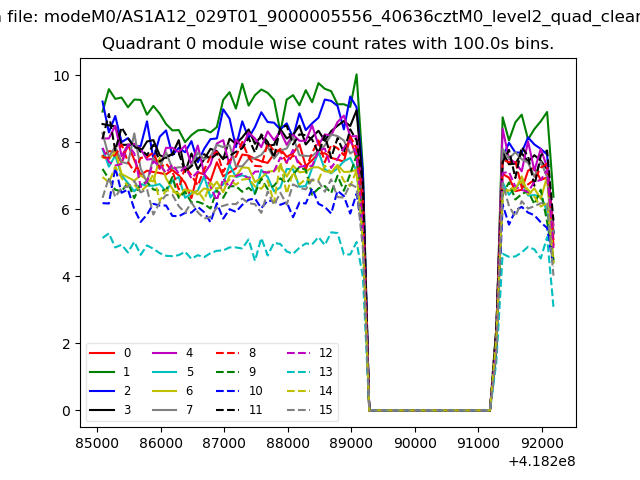
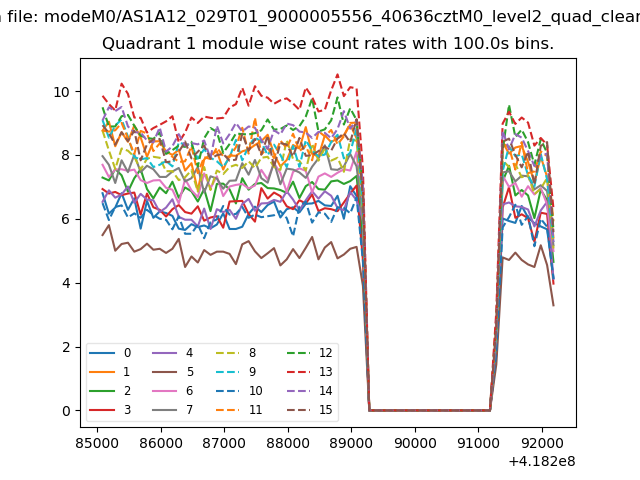
| Module-wise count rates for Quadrant A Data is divided into 100 sec bins |
 |
 |
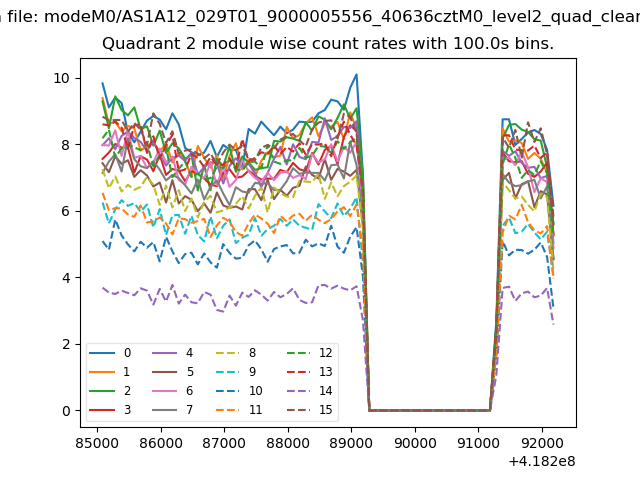
| Module-wise count rates for Quadrant B Data is divided into 100 sec bins |
 |
 |
| Module-wise count rates for Quadrant C Data is divided into 100 sec bins |
 |
 |
| Module-wise count rates for Quadrant D Data is divided into 100 sec bins |
 |
 |
| Parameter | Plot |
|---|---|
| CZT HV Monitor | 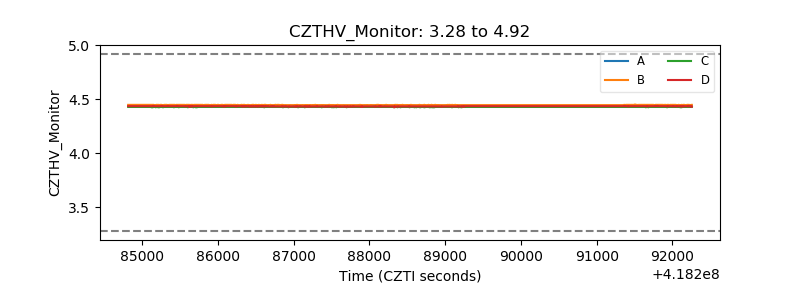 |
| D_VDD | 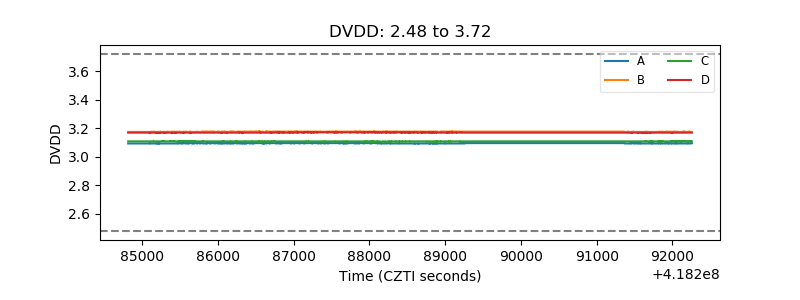 |
| Temperature 1 | 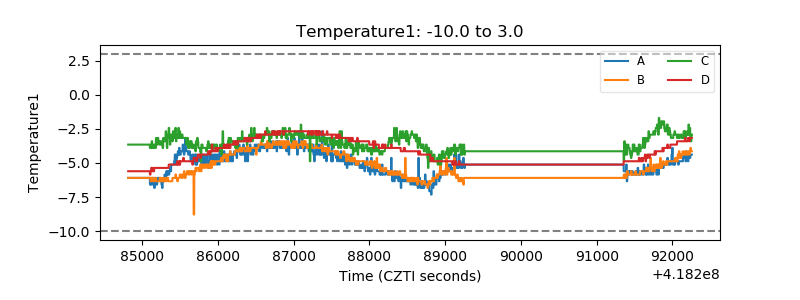 |
| Veto HV Monitor | 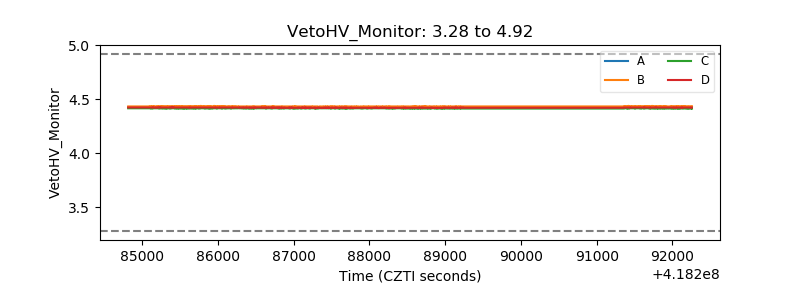 |
| Veto LLD | 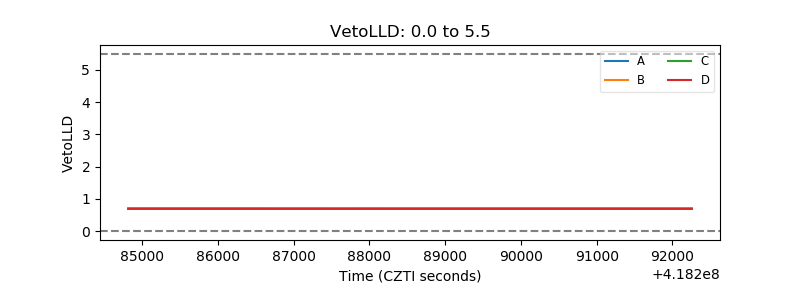 |
| Alpha Counter | 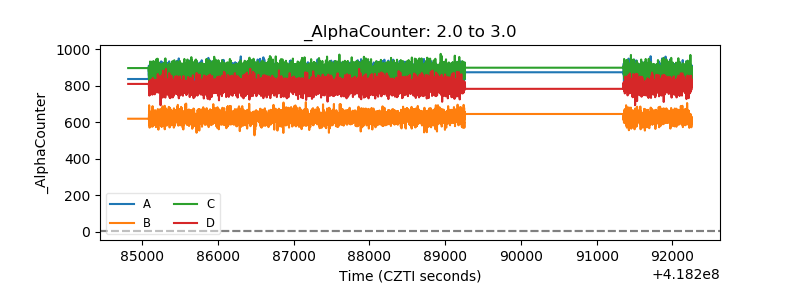 |
| _CPM_Rate | 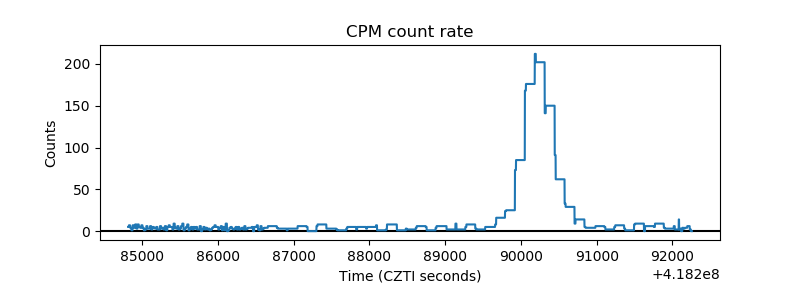 |
| CZT Counter | 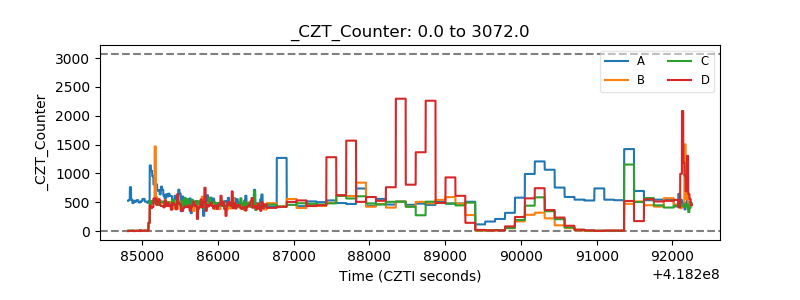 |
| +2.5 Volts monitor |  |
| +5 Volts monitor |  |
| _ROLL_ROT | 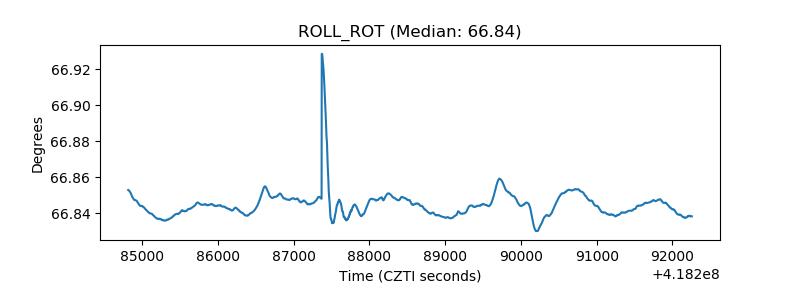 |
| _Roll_DEC | 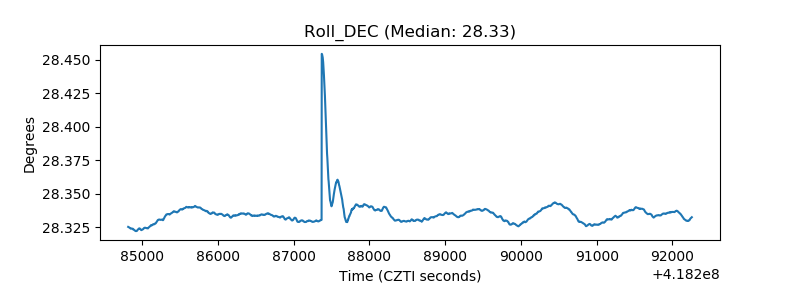 |
| _Roll_RA | 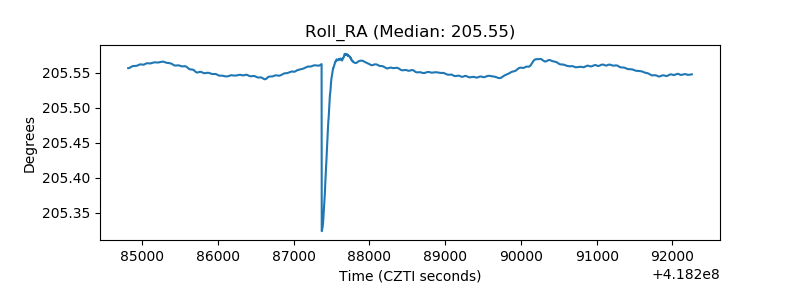 |
| Veto Counter | 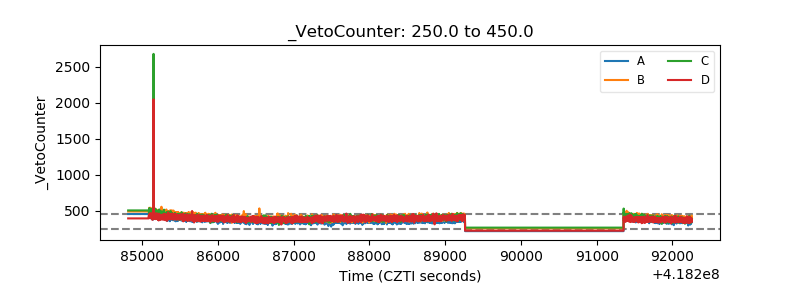 |