| Param | Original file | Final file |
|---|---|---|
| Filename | modeM0/AS1A12_029T01_9000005556_40638cztM0_level2.fits | modeM0/AS1A12_029T01_9000005556_40638cztM0_level2_quad_clean.evt |
| Size (bytes) | 338,264,640 | 87,287,040 |
| Size | 322.6 MB | 83.2 MB |
| Events in quadrant A | 2,800,963 | 599,047 |
| Events in quadrant B | 3,054,653 | 611,451 |
| Events in quadrant C | 2,842,160 | 574,541 |
| Events in quadrant D | 3,397,909 | 476,158 |
| Mode M0 | |||
|---|---|---|---|
| Quadrant | BADHDUFLAG | Total packets | Discarded packets |
| A | 0 | 11657 | 3 |
| B | 0 | 12629 | 2 |
| C | 0 | 11925 | 2 |
| D | 0 | 13827 | 2 |
| Mode M9 | |||
|---|---|---|---|
| Quadrant | BADHDUFLAG | Total packets | Discarded packets |
| A | 0 | 27 | 0 |
| B | 0 | 27 | 0 |
| C | 0 | 27 | 0 |
| D | 0 | 28 | 0 |
| Mode SS | |||
|---|---|---|---|
| Quadrant | BADHDUFLAG | Total packets | Discarded packets |
| A | 0 | 110 | 0 |
| B | 0 | 110 | 0 |
| C | 0 | 110 | 0 |
| D | 0 | 110 | 0 |
| Quadrant | Total seconds | Saturated seconds | Saturation percentage |
|---|---|---|---|
| A | 5457 | 7 | 0.128276% |
| B | 5457 | 64 | 1.172806% |
| C | 5457 | 26 | 0.476452% |
| D | 5457 | 689 | 12.625985% |
Noise dominated data is calculated using 1-second bins in cleaned event files. If a bin has >2000 counts, and if more than 50% of those come from <1% of pixels, then it is considered to be noise-dominated and hence unusable.
| Quadrant | # 1 sec bins | Bins with >0 counts | Bins with >2000 counts | High rate bins dominated by noise | Noise dominated (total time) | Noise dominated (detector-on time) | Marked lightcurve |
|---|---|---|---|---|---|---|---|
| A | 7070 | 5458 | 4 | 4 | 0.06% | 0.07% | 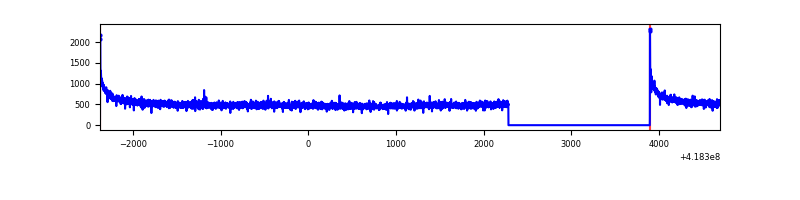 |
| B | 7070 | 5458 | 35 | 35 | 0.50% | 0.64% | 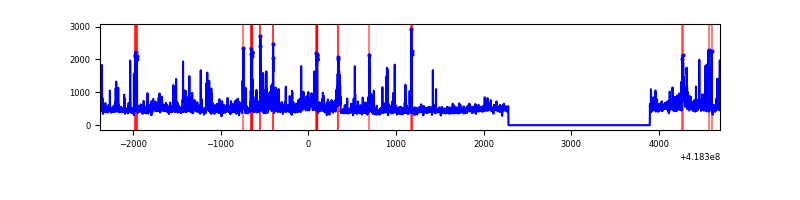 |
| C | 7070 | 5458 | 26 | 26 | 0.37% | 0.48% | 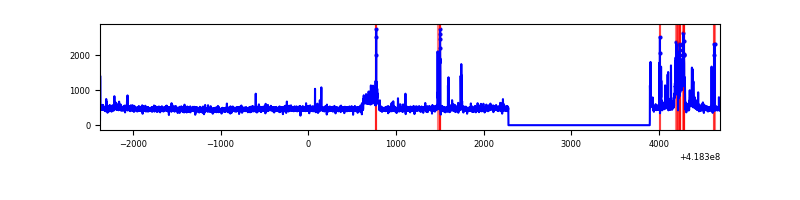 |
| D | 7070 | 5458 | 126 | 126 | 1.78% | 2.31% | 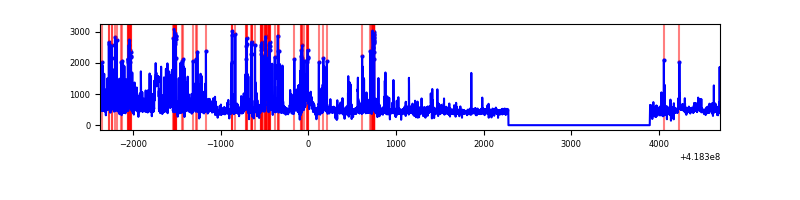 |
Top three noisy pixels from each quadrant. If the there are fewer than three noisy pixels in the level2.evt file, extra rows are filled as -1
| Pixel properties | Quadrant properties | ||||||
|---|---|---|---|---|---|---|---|
| Quadrant | DetID | PixID | Counts | Sigma | Mean | Median | Sigma |
| A | 10 | 83 | 470963 | 3759.78 | 601 | 589 | 125.1 |
| A | 3 | 137 | 6920 | 50.6 | 601 | 589 | 125.1 |
| A | 2 | 79 | 6122 | 44.23 | 601 | 589 | 125.1 |
| B | 0 | 190 | 351594 | 2990.37 | 593 | 575 | 117.4 |
| B | 0 | 229 | 275542 | 2342.47 | 593 | 575 | 117.4 |
| B | 0 | 230 | 53407 | 450.08 | 593 | 575 | 117.4 |
| C | 14 | 254 | 291287 | 2104.1 | 584 | 587 | 138.2 |
| C | 15 | 214 | 240934 | 1739.64 | 584 | 587 | 138.2 |
| C | 15 | 159 | 19911 | 139.87 | 584 | 587 | 138.2 |
| D | 12 | 227 | 847943 | 6163.03 | 546 | 529 | 137.5 |
| D | 12 | 191 | 178585 | 1294.95 | 546 | 529 | 137.5 |
| D | 2 | 250 | 110391 | 799.0 | 546 | 529 | 137.5 |
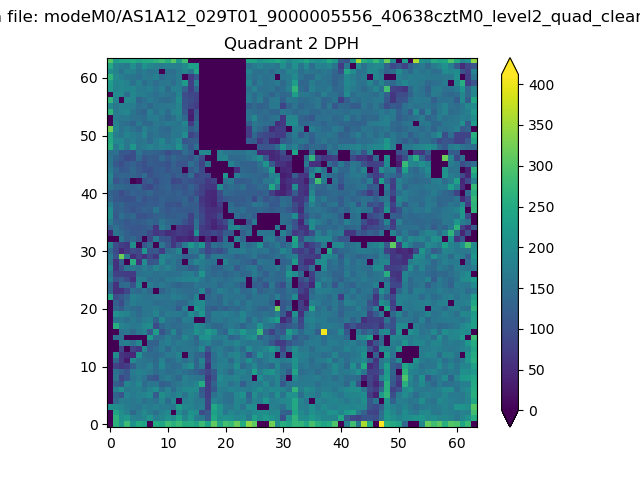
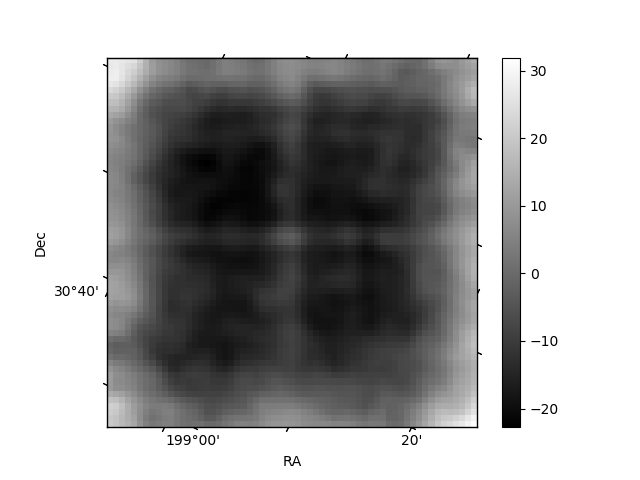
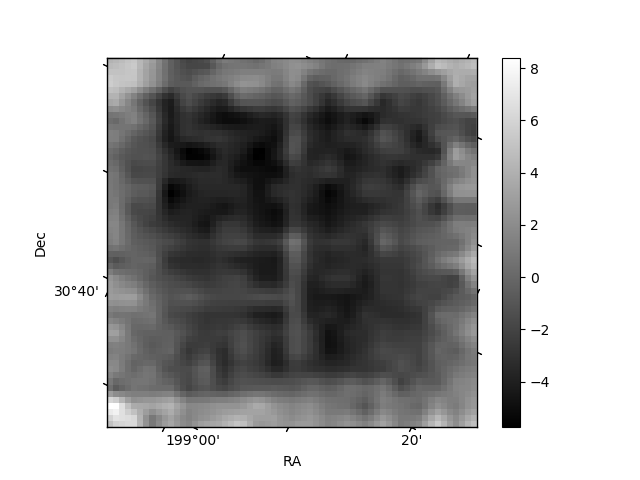
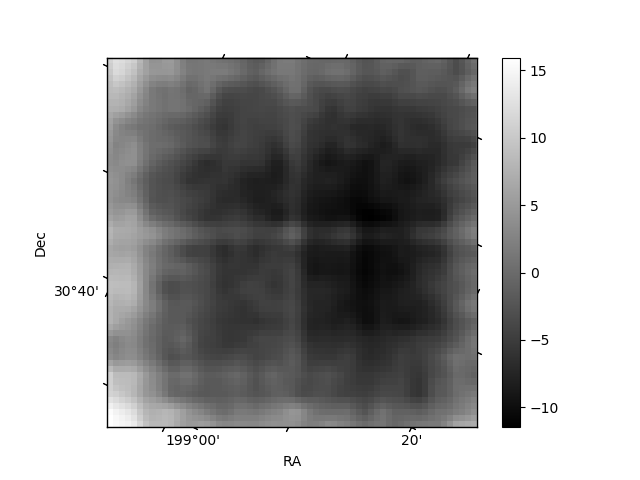
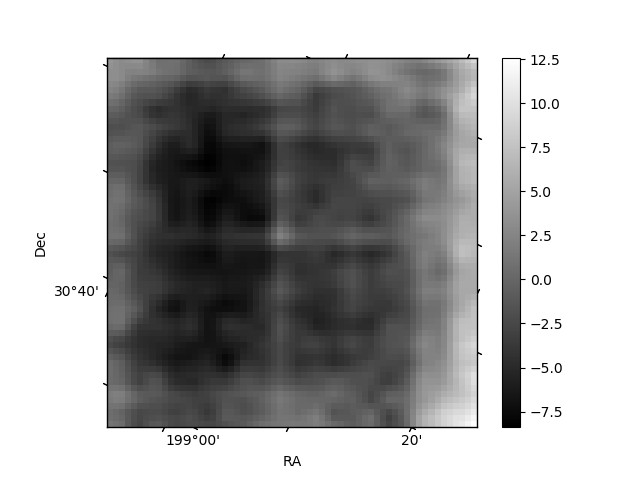
Histogram calculated using DETX and DETY for each event in the final _common_clean file
| Quadrant A | 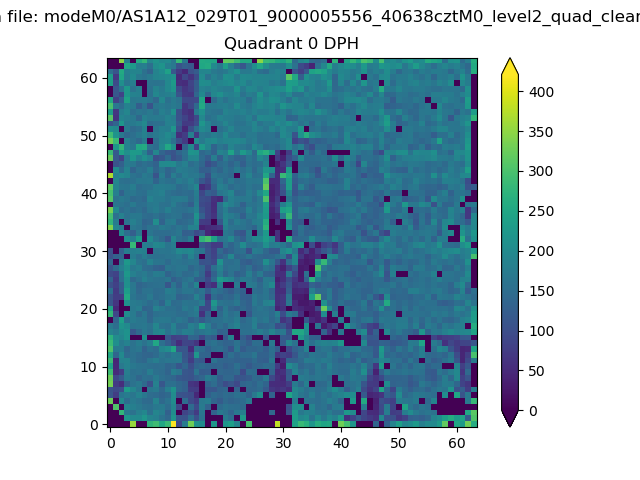 |
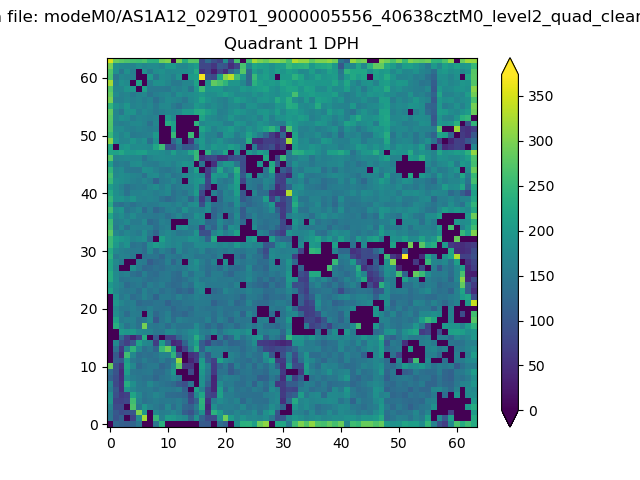 |
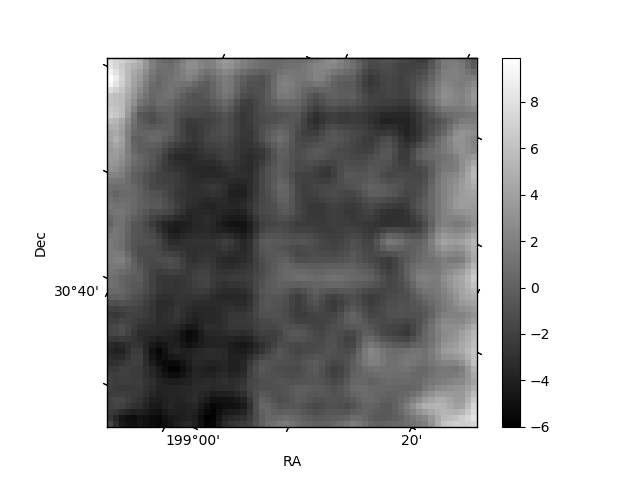
Quadrant B |
|---|---|---|---|
| Quadrant D | 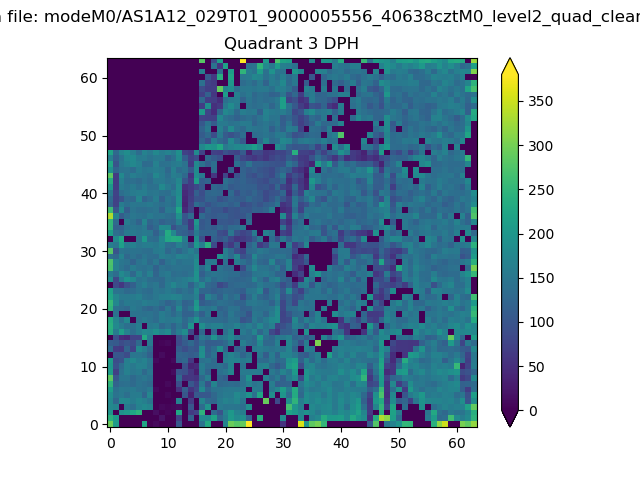 |
 |
Quadrant C |
| Plot type | Count rate plots | Images |
|---|---|---|
| Comparison with Poisson distribution Blue bars denote a histogram of data divided into 1 sec bins. Red curve is a Poisson curve with rate = median count rate of data. |
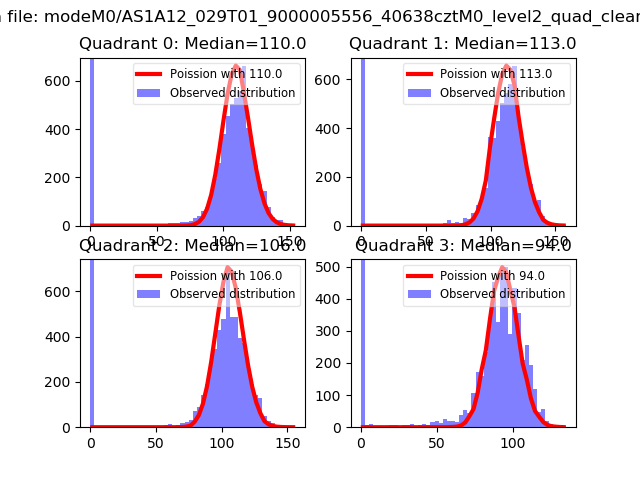 |
 |
| Quadrant-wise count rates Data is divided into 100 sec bins |
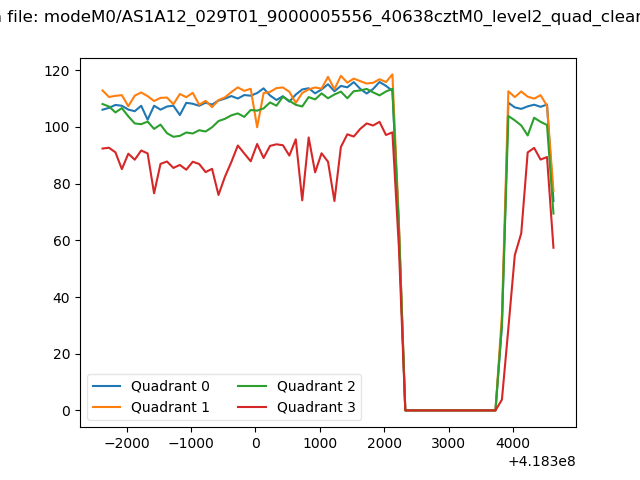 |
|
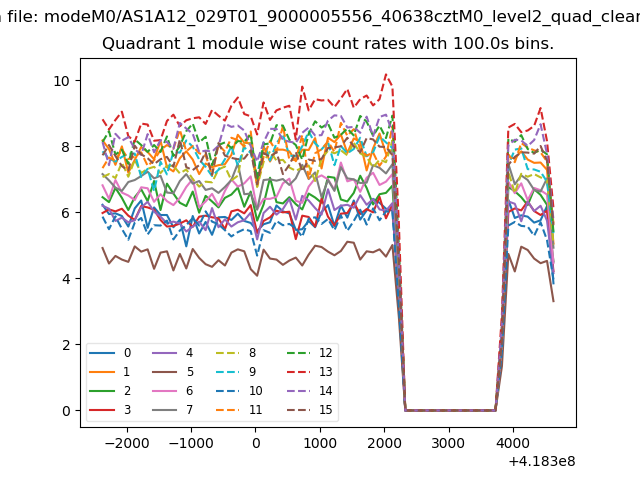
| Module-wise count rates for Quadrant A Data is divided into 100 sec bins |
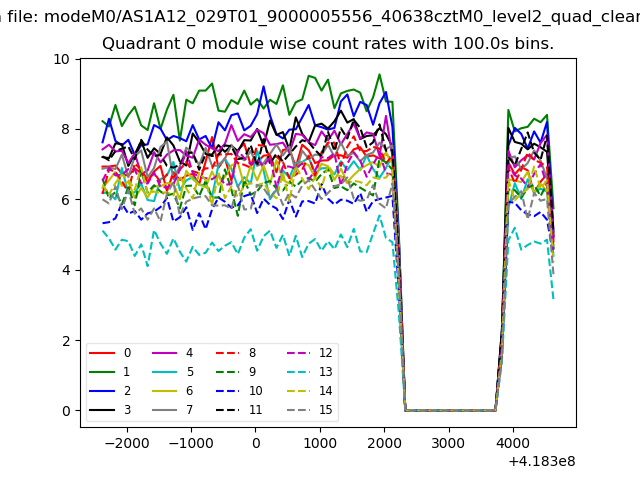 |
 |
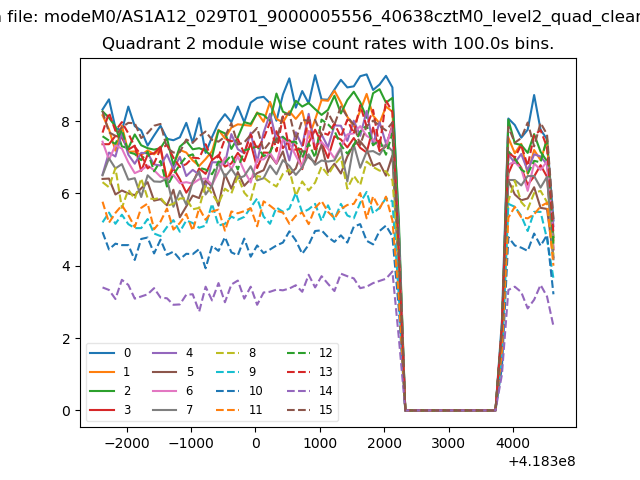
| Module-wise count rates for Quadrant B Data is divided into 100 sec bins |
 |
 |
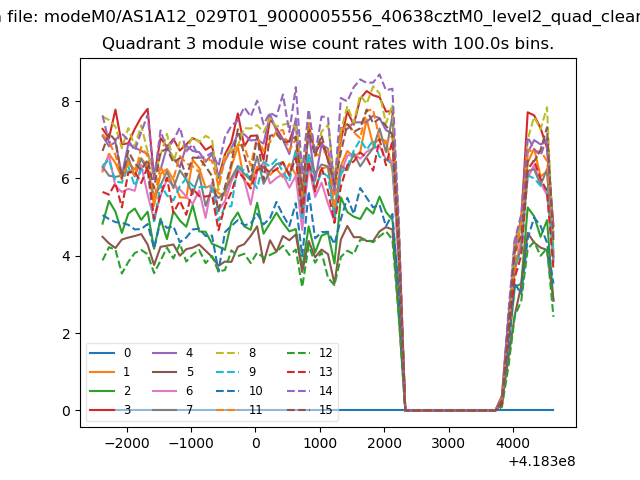
| Module-wise count rates for Quadrant C Data is divided into 100 sec bins |
 |
 |
| Module-wise count rates for Quadrant D Data is divided into 100 sec bins |
 |
 |
| Parameter | Plot |
|---|---|
| CZT HV Monitor | 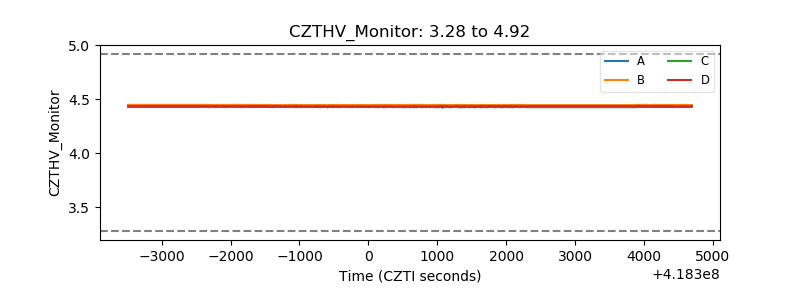 |
| D_VDD | 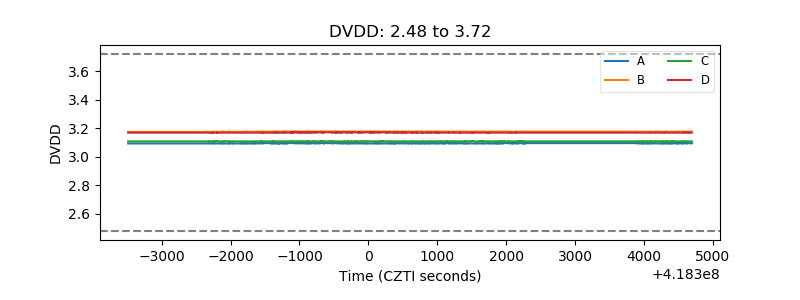 |
| Temperature 1 | 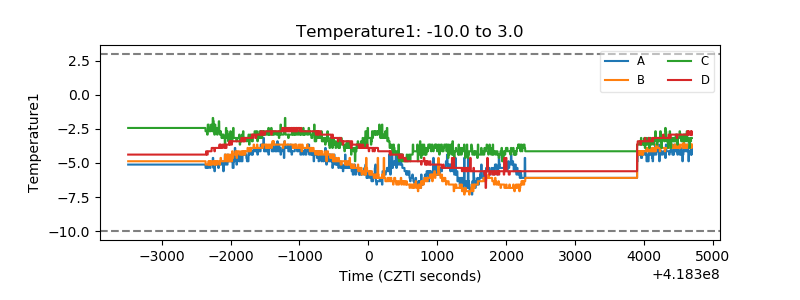 |
| Veto HV Monitor |  |
| Veto LLD | 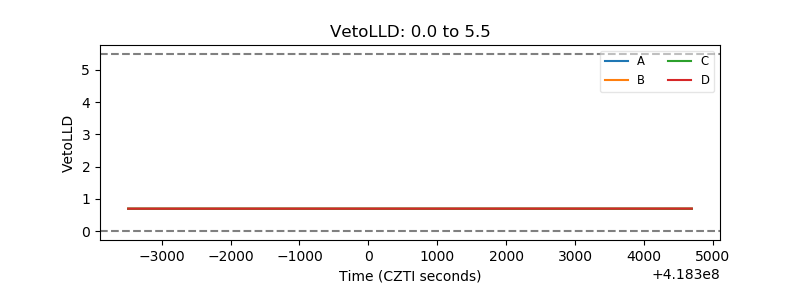 |
| Alpha Counter | 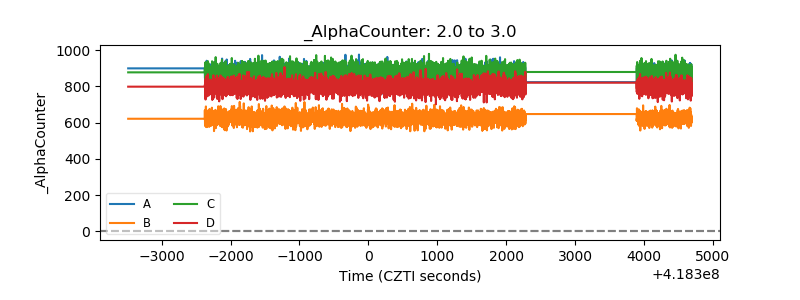 |
| _CPM_Rate | 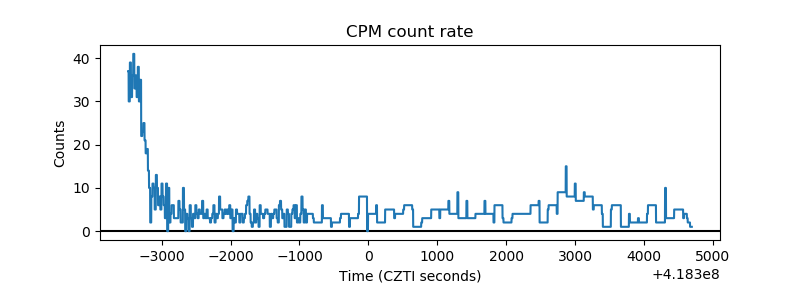 |
| CZT Counter | 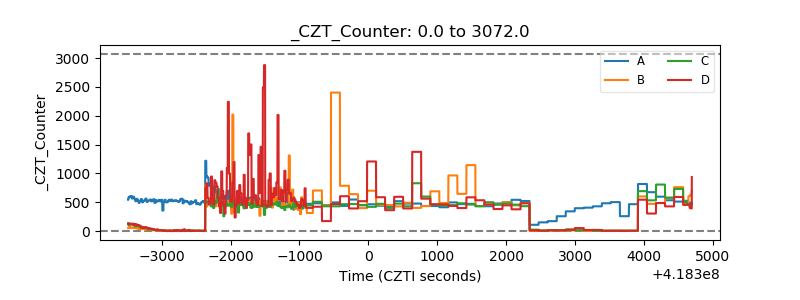 |
| +2.5 Volts monitor | 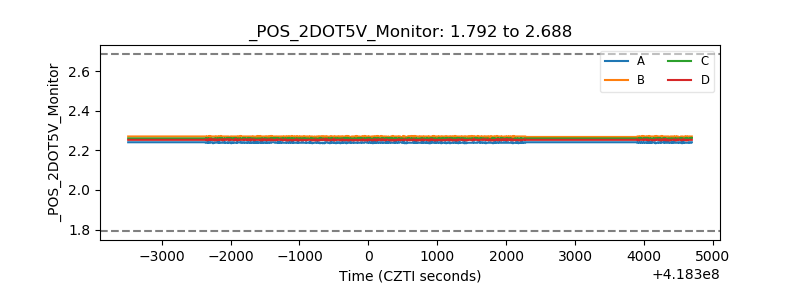 |
| +5 Volts monitor | 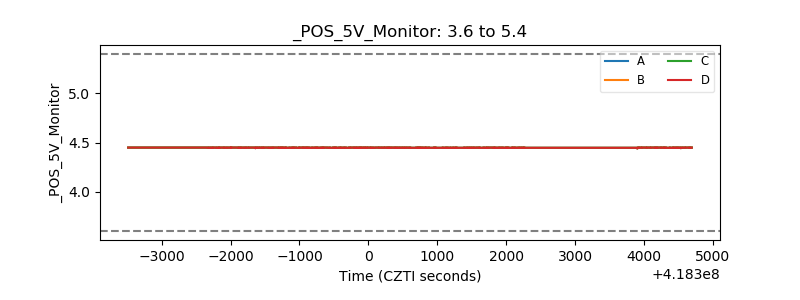 |
| _ROLL_ROT | 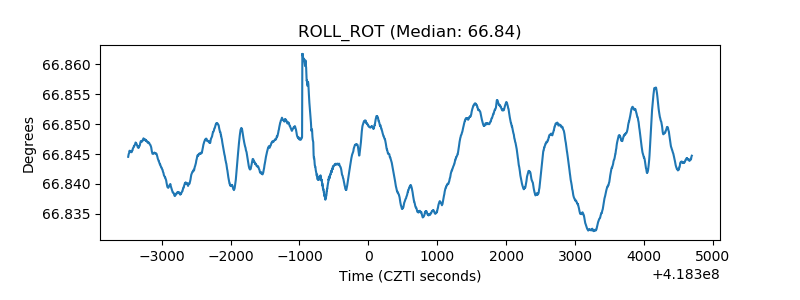 |
| _Roll_DEC | 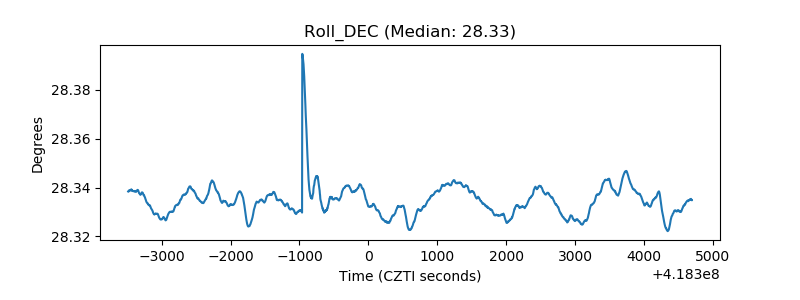 |
| _Roll_RA | 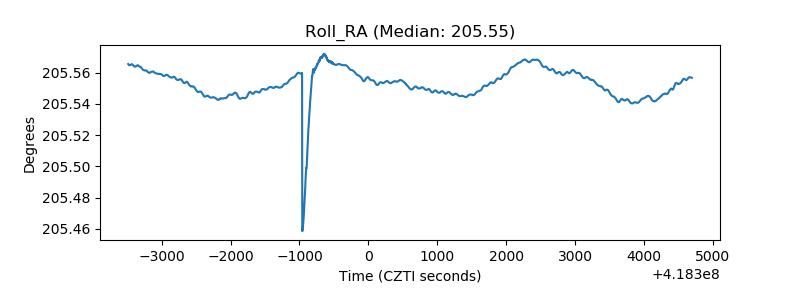 |
| Veto Counter | 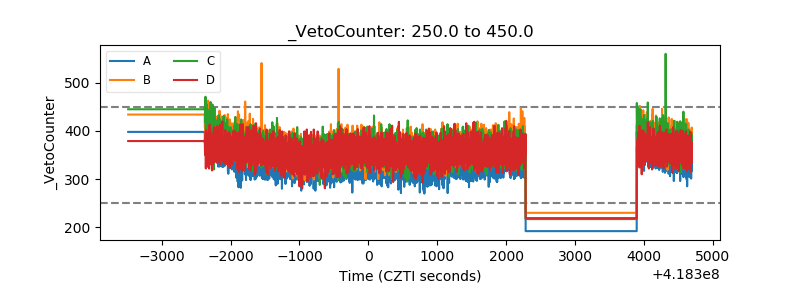 |