| Param | Original file | Final file |
|---|---|---|
| Filename | modeM0/AS1A12_029T01_9000005556_40639cztM0_level2.fits | modeM0/AS1A12_029T01_9000005556_40639cztM0_level2_quad_clean.evt |
| Size (bytes) | 370,851,840 | 94,262,400 |
| Size | 353.7 MB | 89.9 MB |
| Events in quadrant A | 3,046,557 | 644,394 |
| Events in quadrant B | 3,205,907 | 659,100 |
| Events in quadrant C | 3,213,786 | 616,159 |
| Events in quadrant D | 3,800,986 | 521,541 |
| Mode M0 | |||
|---|---|---|---|
| Quadrant | BADHDUFLAG | Total packets | Discarded packets |
| A | 0 | 12688 | 3 |
| B | 0 | 13413 | 2 |
| C | 0 | 13261 | 2 |
| D | 0 | 15265 | 2 |
| Mode M9 | |||
|---|---|---|---|
| Quadrant | BADHDUFLAG | Total packets | Discarded packets |
| A | 0 | 30 | 0 |
| B | 0 | 30 | 0 |
| C | 0 | 30 | 0 |
| D | 0 | 30 | 0 |
| Mode SS | |||
|---|---|---|---|
| Quadrant | BADHDUFLAG | Total packets | Discarded packets |
| A | 0 | 122 | 0 |
| B | 0 | 122 | 0 |
| C | 0 | 122 | 0 |
| D | 0 | 122 | 0 |
| Quadrant | Total seconds | Saturated seconds | Saturation percentage |
|---|---|---|---|
| A | 5910 | 10 | 0.169205% |
| B | 5910 | 74 | 1.252115% |
| C | 5910 | 84 | 1.421320% |
| D | 5910 | 622 | 10.524535% |
Noise dominated data is calculated using 1-second bins in cleaned event files. If a bin has >2000 counts, and if more than 50% of those come from <1% of pixels, then it is considered to be noise-dominated and hence unusable.
| Quadrant | # 1 sec bins | Bins with >0 counts | Bins with >2000 counts | High rate bins dominated by noise | Noise dominated (total time) | Noise dominated (detector-on time) | Marked lightcurve |
|---|---|---|---|---|---|---|---|
| A | 8896 | 5912 | 3 | 3 | 0.03% | 0.05% | 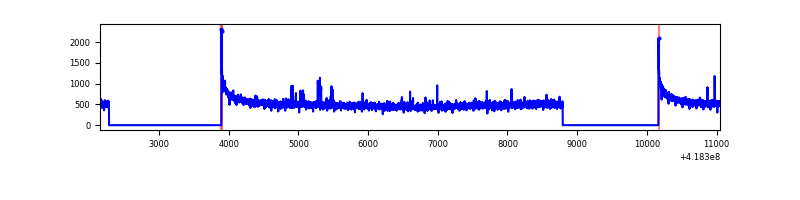 |
| B | 8896 | 5912 | 43 | 43 | 0.48% | 0.73% | 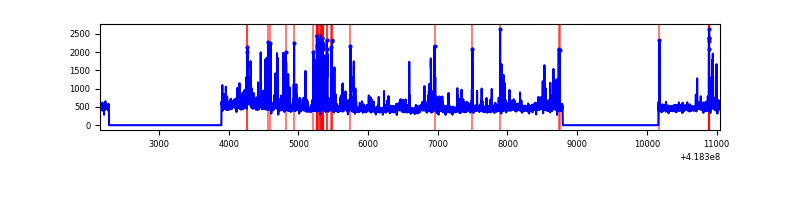 |
| C | 8896 | 5912 | 79 | 79 | 0.89% | 1.34% | 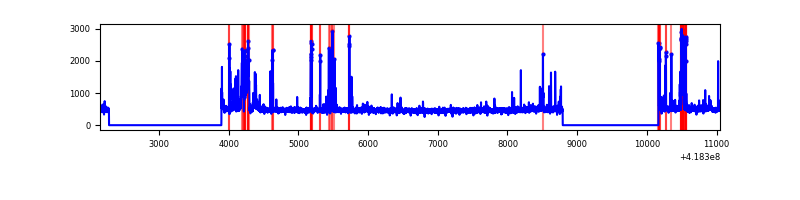 |
| D | 8896 | 5912 | 74 | 74 | 0.83% | 1.25% | 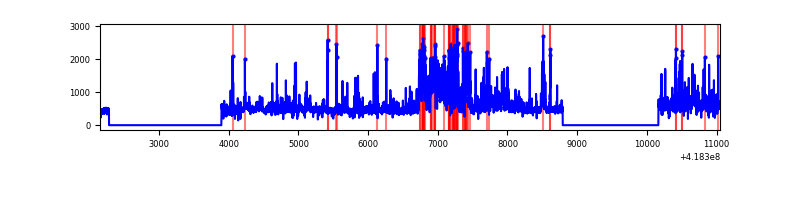 |
Top three noisy pixels from each quadrant. If the there are fewer than three noisy pixels in the level2.evt file, extra rows are filled as -1
| Pixel properties | Quadrant properties | ||||||
|---|---|---|---|---|---|---|---|
| Quadrant | DetID | PixID | Counts | Sigma | Mean | Median | Sigma |
| A | 10 | 83 | 496283 | 3696.01 | 651 | 638 | 134.1 |
| A | 2 | 79 | 34708 | 254.06 | 651 | 638 | 134.1 |
| A | 3 | 137 | 7576 | 51.74 | 651 | 638 | 134.1 |
| B | 0 | 190 | 314960 | 2483.9 | 645 | 627 | 126.5 |
| B | 0 | 229 | 232816 | 1834.79 | 645 | 627 | 126.5 |
| B | 0 | 230 | 61164 | 478.37 | 645 | 627 | 126.5 |
| C | 14 | 254 | 421229 | 2813.44 | 633 | 636 | 149.5 |
| C | 15 | 214 | 259614 | 1732.36 | 633 | 636 | 149.5 |
| C | 12 | 249 | 37527 | 246.77 | 633 | 636 | 149.5 |
| D | 12 | 227 | 498178 | 3328.9 | 600 | 584 | 149.5 |
| D | 6 | 239 | 311884 | 2082.6 | 600 | 584 | 149.5 |
| D | 13 | 171 | 201132 | 1341.67 | 600 | 584 | 149.5 |
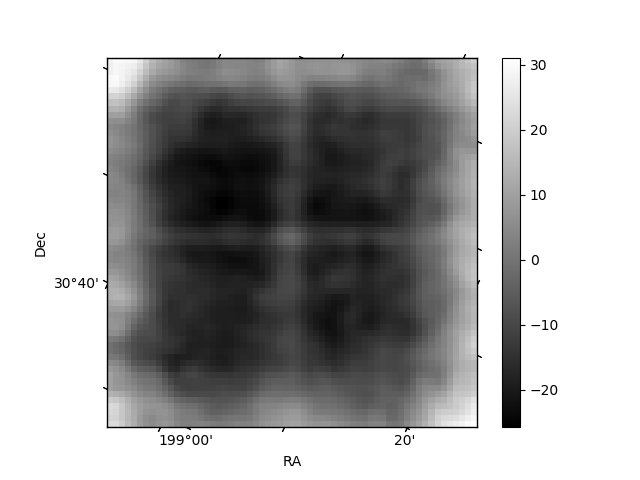
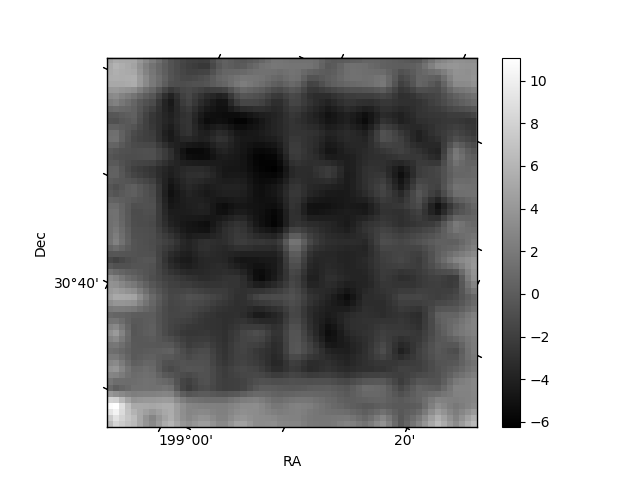
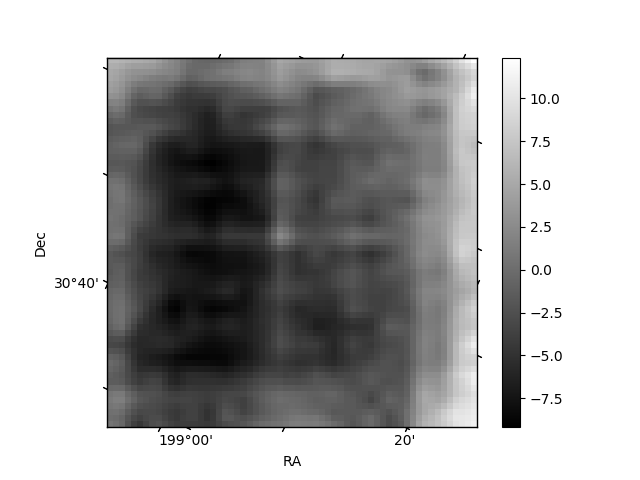
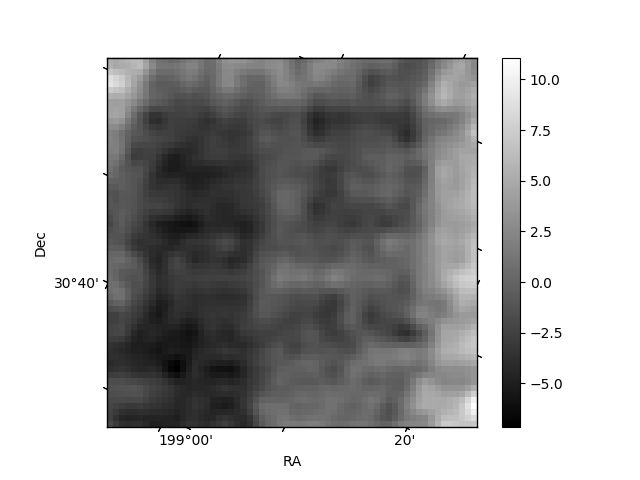
Histogram calculated using DETX and DETY for each event in the final _common_clean file
| Quadrant A | 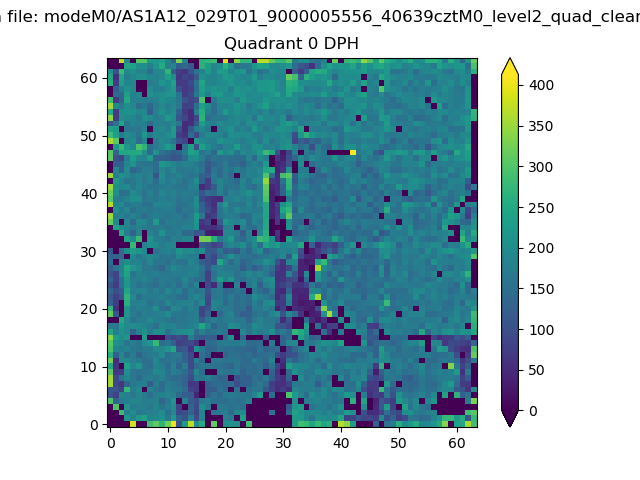 |
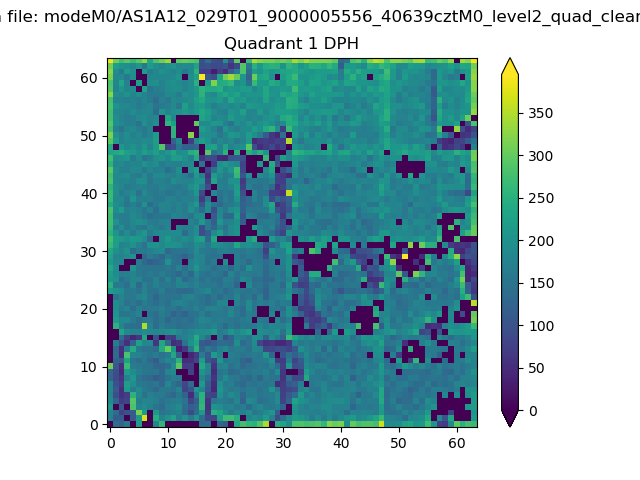 |
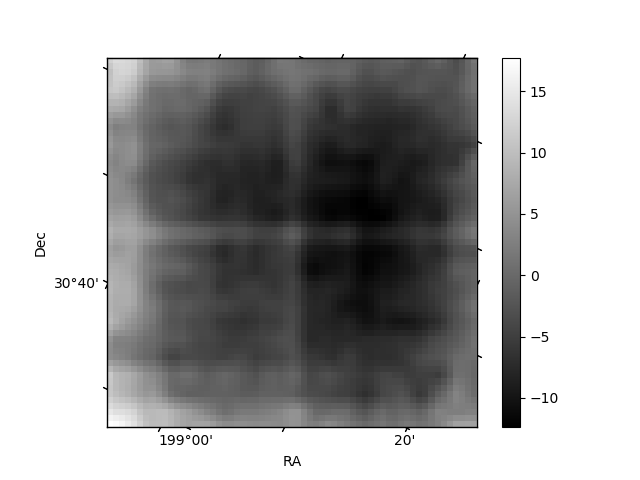
Quadrant B |
|---|---|---|---|
| Quadrant D | 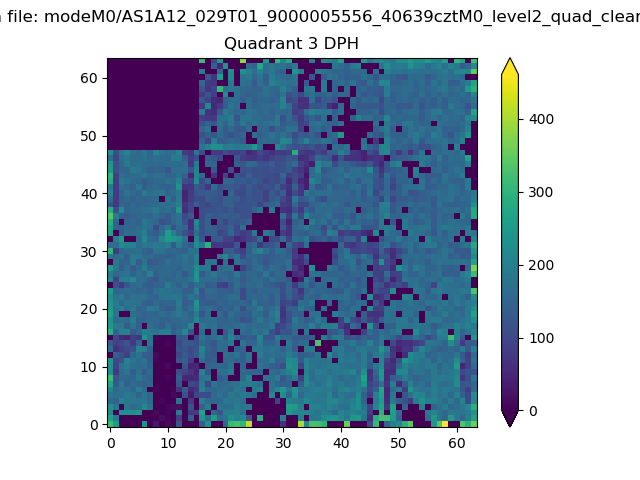 |
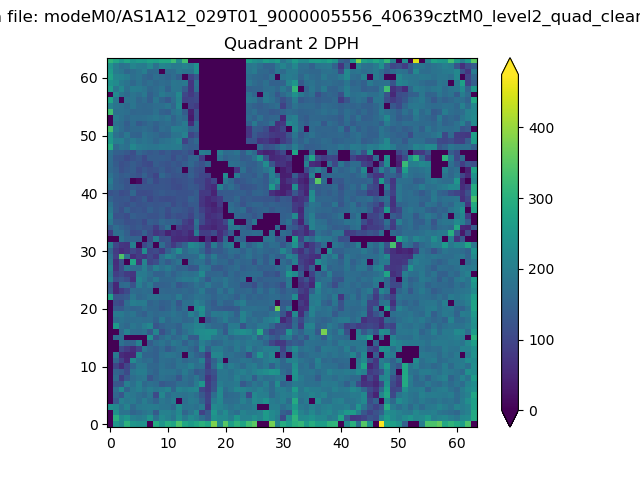 |
Quadrant C |
| Plot type | Count rate plots | Images |
|---|---|---|
| Comparison with Poisson distribution Blue bars denote a histogram of data divided into 1 sec bins. Red curve is a Poisson curve with rate = median count rate of data. |
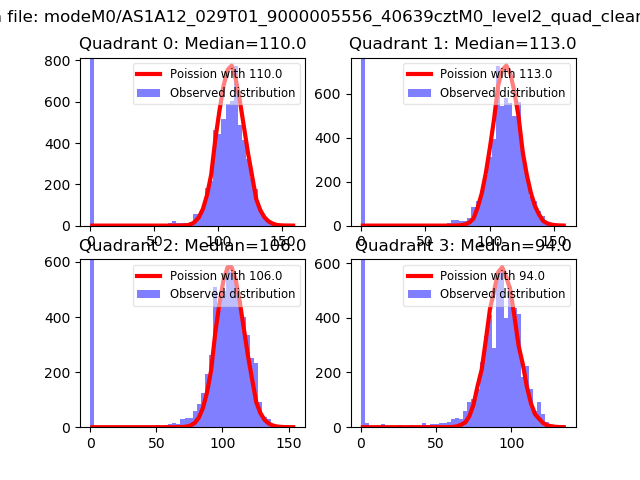 |
 |
| Quadrant-wise count rates Data is divided into 100 sec bins |
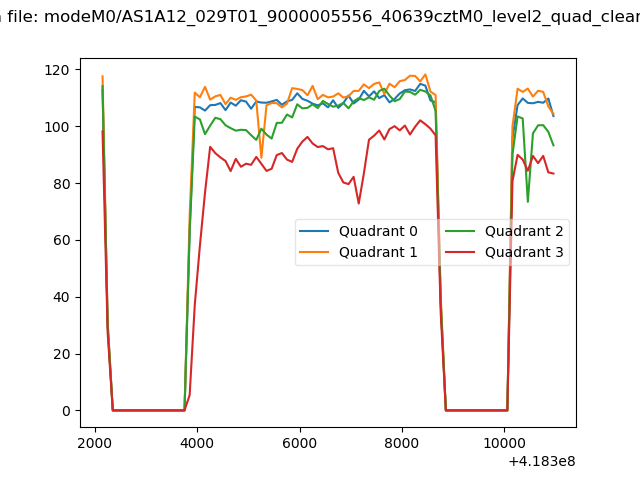 |
|
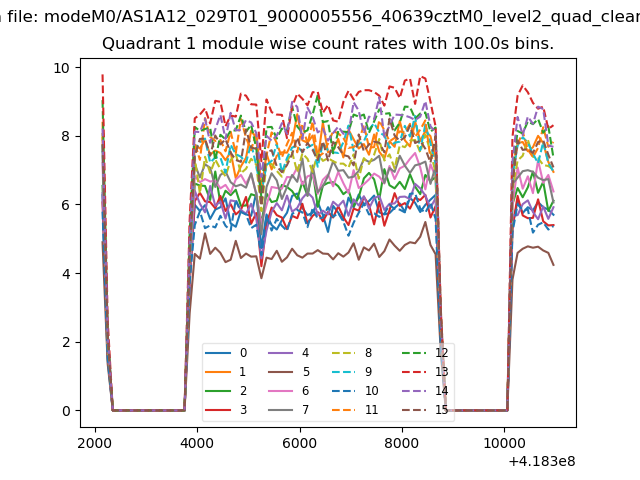
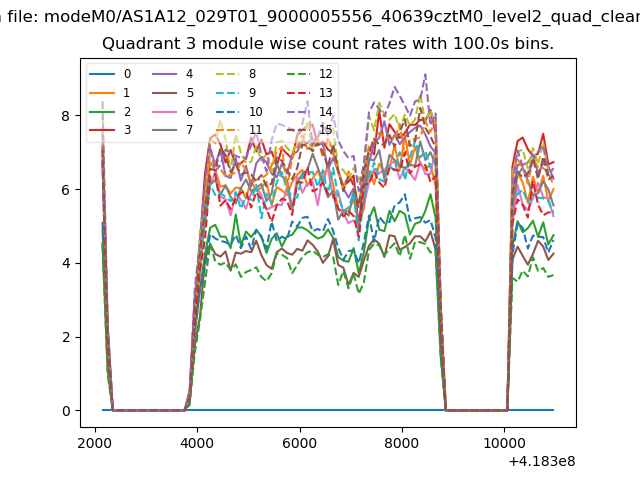
| Module-wise count rates for Quadrant A Data is divided into 100 sec bins |
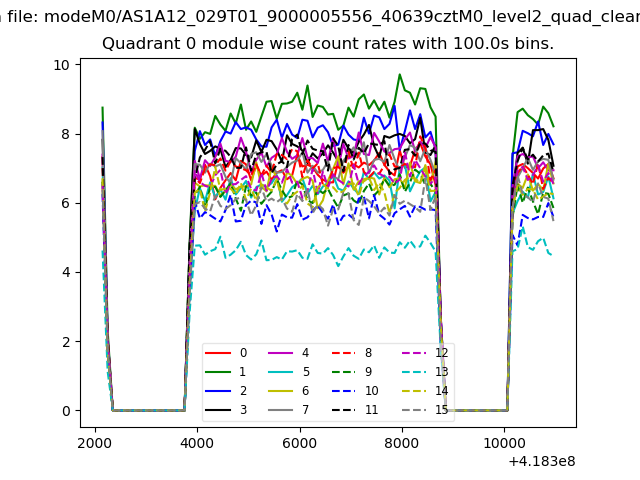 |
 |
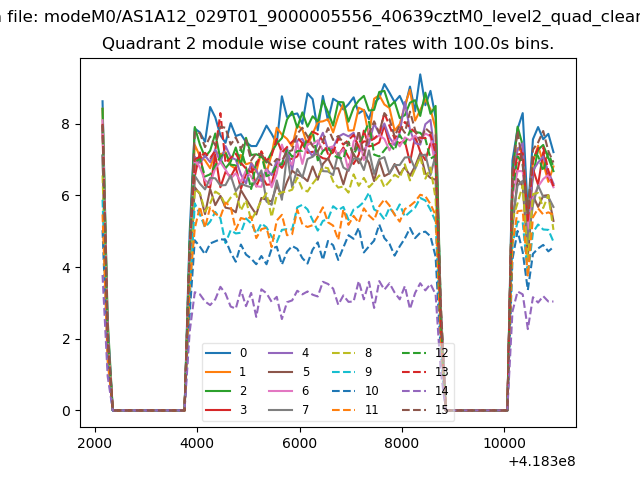
| Module-wise count rates for Quadrant B Data is divided into 100 sec bins |
 |
 |
| Module-wise count rates for Quadrant C Data is divided into 100 sec bins |
 |
 |
| Module-wise count rates for Quadrant D Data is divided into 100 sec bins |
 |
 |
| Parameter | Plot |
|---|---|
| CZT HV Monitor | 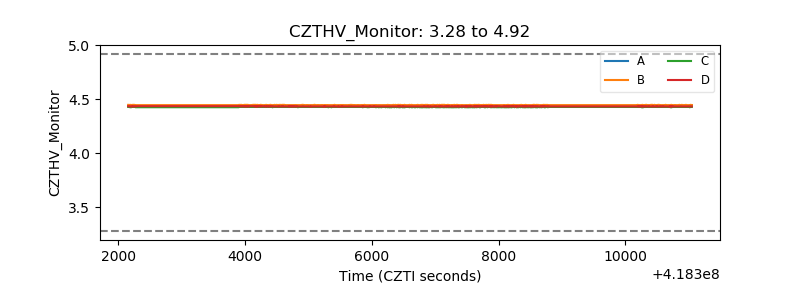 |
| D_VDD | 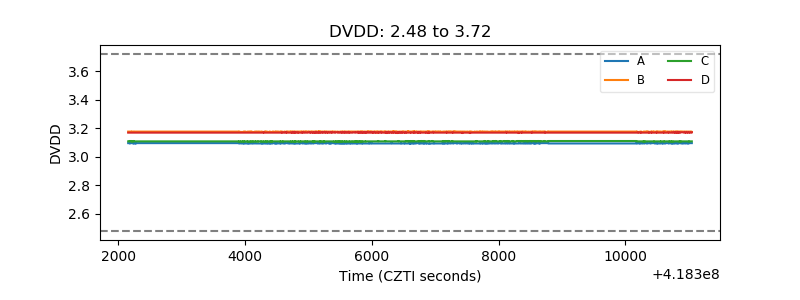 |
| Temperature 1 | 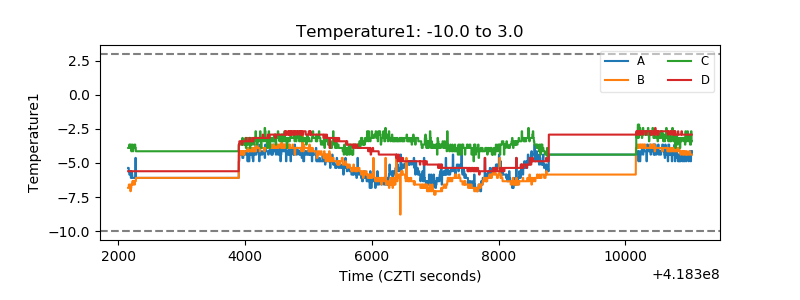 |
| Veto HV Monitor | 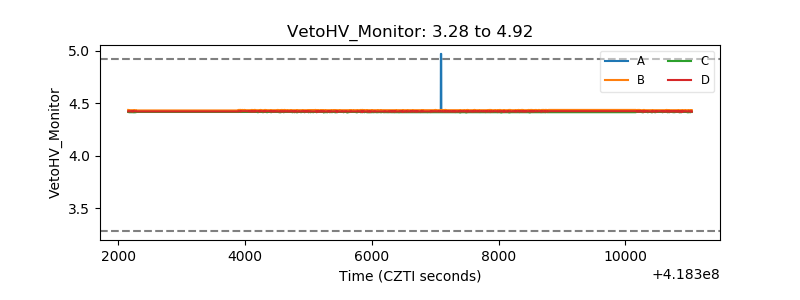 |
| Veto LLD | 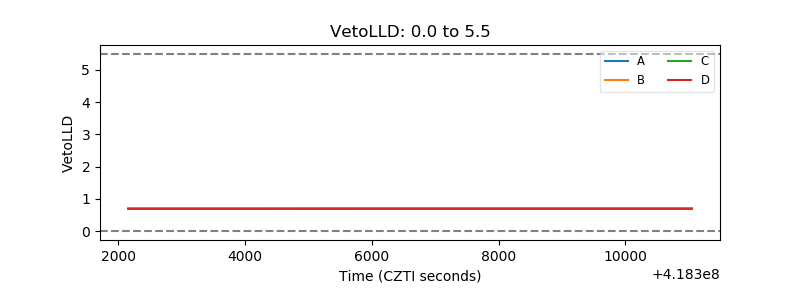 |
| Alpha Counter | 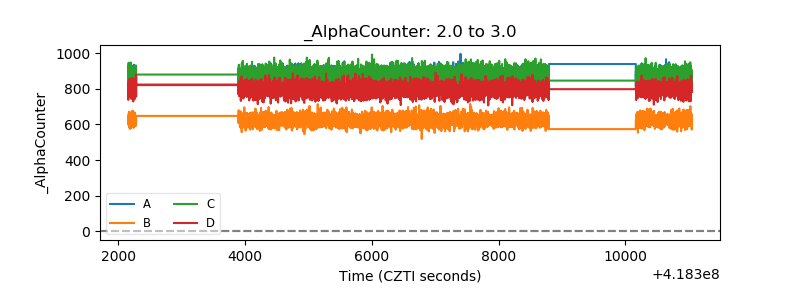 |
| _CPM_Rate | 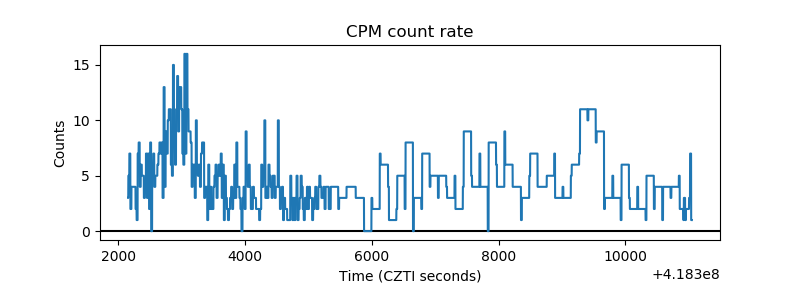 |
| CZT Counter | 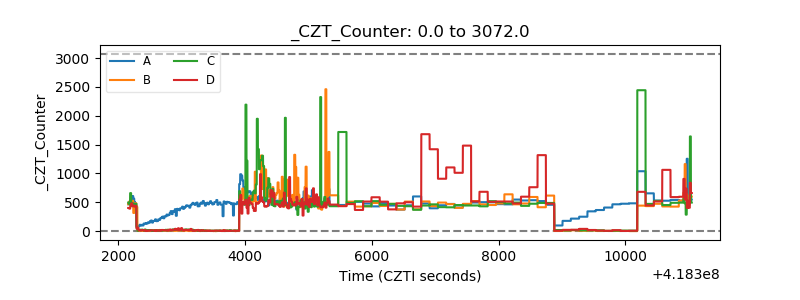 |
| +2.5 Volts monitor | 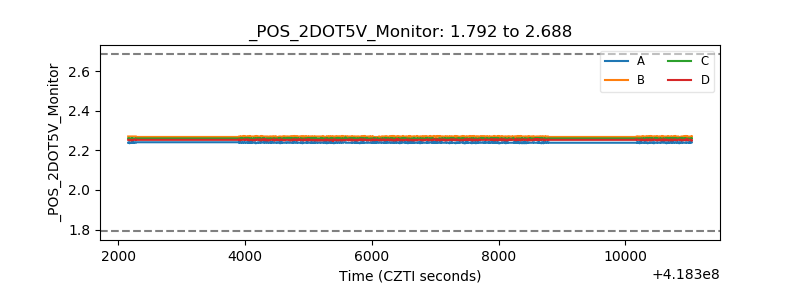 |
| +5 Volts monitor | 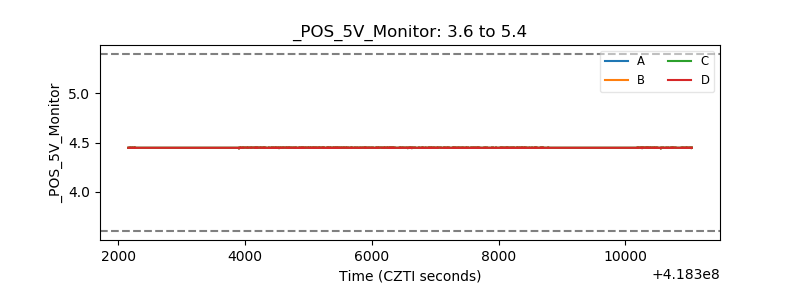 |
| _ROLL_ROT | 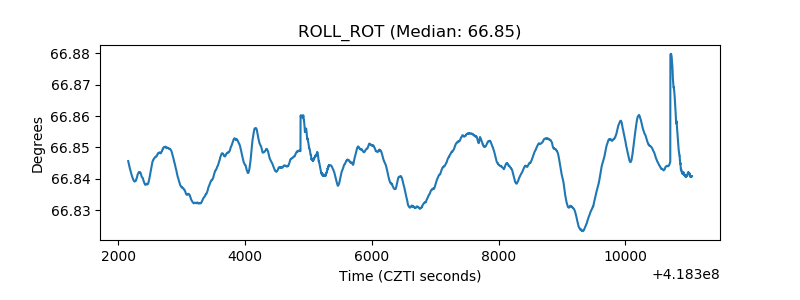 |
| _Roll_DEC | 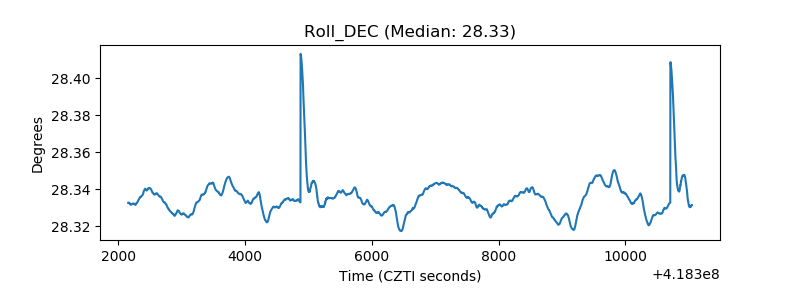 |
| _Roll_RA | 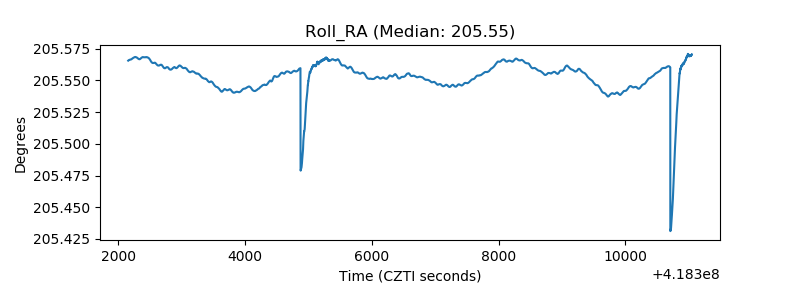 |
| Veto Counter | 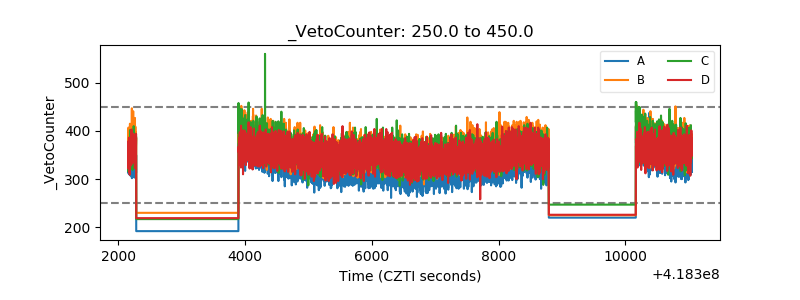 |