| Param | Original file | Final file |
|---|---|---|
| Filename | modeM0/AS1A12_029T01_9000005556_40640cztM0_level2.fits | modeM0/AS1A12_029T01_9000005556_40640cztM0_level2_quad_clean.evt |
| Size (bytes) | 360,944,640 | 94,861,440 |
| Size | 344.2 MB | 90.5 MB |
| Events in quadrant A | 3,033,208 | 648,162 |
| Events in quadrant B | 3,302,385 | 658,051 |
| Events in quadrant C | 3,153,330 | 619,837 |
| Events in quadrant D | 3,409,377 | 530,940 |
| Mode M0 | |||
|---|---|---|---|
| Quadrant | BADHDUFLAG | Total packets | Discarded packets |
| A | 0 | 12701 | 3 |
| B | 0 | 13673 | 2 |
| C | 0 | 13044 | 2 |
| D | 0 | 14237 | 2 |
| Mode M9 | |||
|---|---|---|---|
| Quadrant | BADHDUFLAG | Total packets | Discarded packets |
| A | 0 | 25 | 0 |
| B | 0 | 25 | 0 |
| C | 0 | 25 | 0 |
| D | 0 | 26 | 0 |
| Mode SS | |||
|---|---|---|---|
| Quadrant | BADHDUFLAG | Total packets | Discarded packets |
| A | 0 | 122 | 0 |
| B | 0 | 122 | 0 |
| C | 0 | 122 | 0 |
| D | 0 | 122 | 0 |
| Quadrant | Total seconds | Saturated seconds | Saturation percentage |
|---|---|---|---|
| A | 5937 | 10 | 0.168435% |
| B | 5937 | 73 | 1.229577% |
| C | 5937 | 70 | 1.179047% |
| D | 5937 | 559 | 9.415530% |
Noise dominated data is calculated using 1-second bins in cleaned event files. If a bin has >2000 counts, and if more than 50% of those come from <1% of pixels, then it is considered to be noise-dominated and hence unusable.
| Quadrant | # 1 sec bins | Bins with >0 counts | Bins with >2000 counts | High rate bins dominated by noise | Noise dominated (total time) | Noise dominated (detector-on time) | Marked lightcurve |
|---|---|---|---|---|---|---|---|
| A | 7251 | 5938 | 1 | 1 | 0.01% | 0.02% | 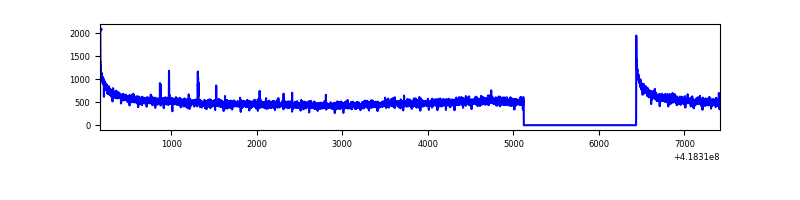 |
| B | 7251 | 5938 | 49 | 49 | 0.68% | 0.83% | 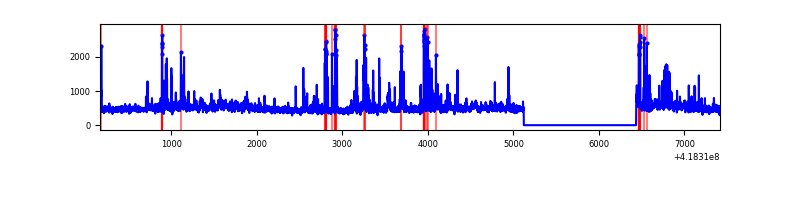 |
| C | 7251 | 5938 | 71 | 71 | 0.98% | 1.20% | 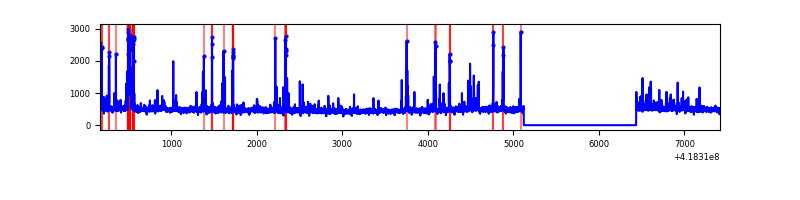 |
| D | 7251 | 5938 | 71 | 71 | 0.98% | 1.20% | 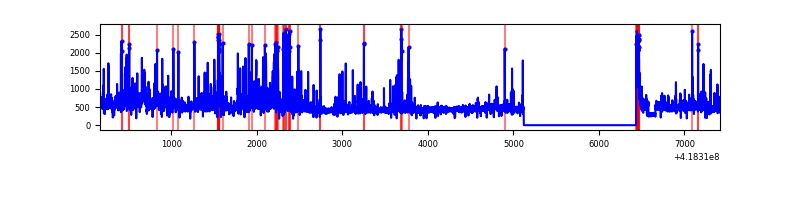 |
Top three noisy pixels from each quadrant. If the there are fewer than three noisy pixels in the level2.evt file, extra rows are filled as -1
| Pixel properties | Quadrant properties | ||||||
|---|---|---|---|---|---|---|---|
| Quadrant | DetID | PixID | Counts | Sigma | Mean | Median | Sigma |
| A | 10 | 83 | 492480 | 3613.43 | 655 | 643 | 136.1 |
| A | 2 | 79 | 11120 | 76.97 | 655 | 643 | 136.1 |
| A | 3 | 137 | 7512 | 50.47 | 655 | 643 | 136.1 |
| B | 0 | 190 | 374336 | 2941.51 | 648 | 629 | 127.0 |
| B | 0 | 229 | 258240 | 2027.7 | 648 | 629 | 127.0 |
| B | 0 | 230 | 55487 | 431.8 | 648 | 629 | 127.0 |
| C | 15 | 214 | 260502 | 1720.45 | 637 | 640 | 151.0 |
| C | 14 | 254 | 249349 | 1646.61 | 637 | 640 | 151.0 |
| C | 12 | 249 | 101684 | 668.98 | 637 | 640 | 151.0 |
| D | 12 | 191 | 173563 | 1148.51 | 603 | 588 | 150.6 |
| D | 9 | 19 | 163004 | 1078.4 | 603 | 588 | 150.6 |
| D | 2 | 250 | 158526 | 1048.67 | 603 | 588 | 150.6 |
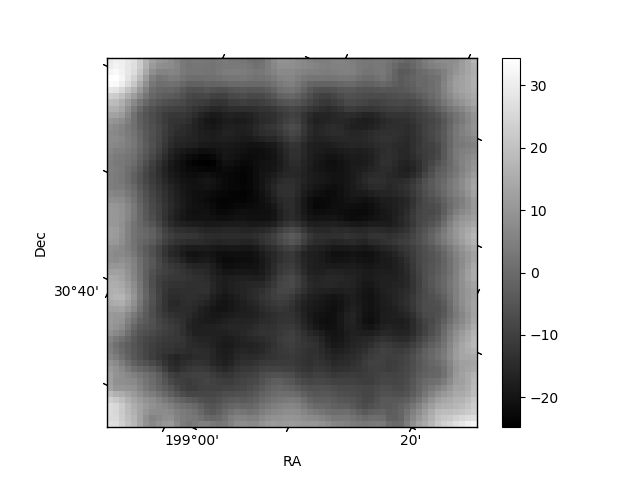
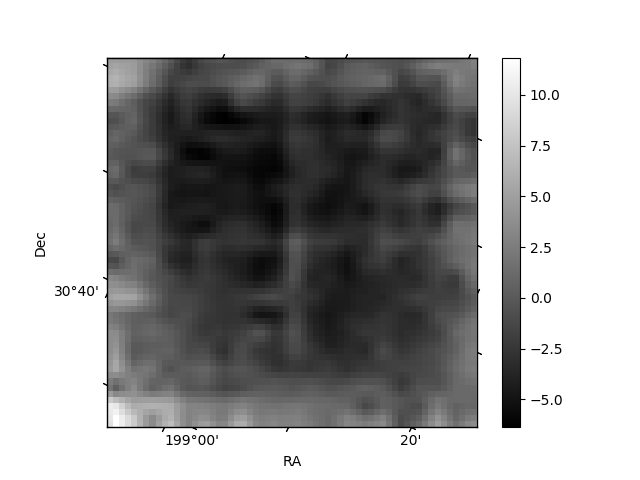
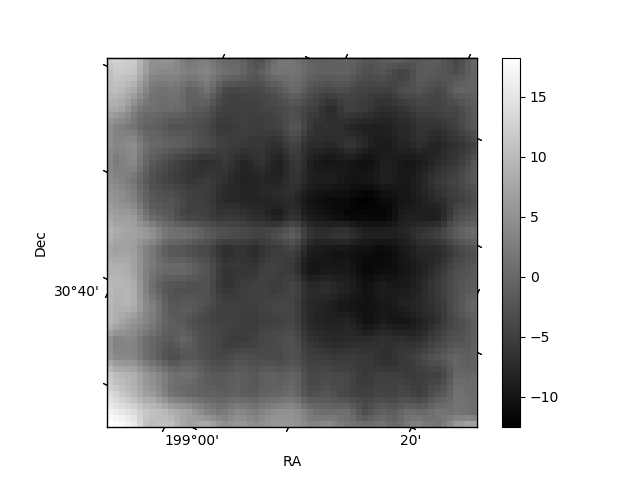
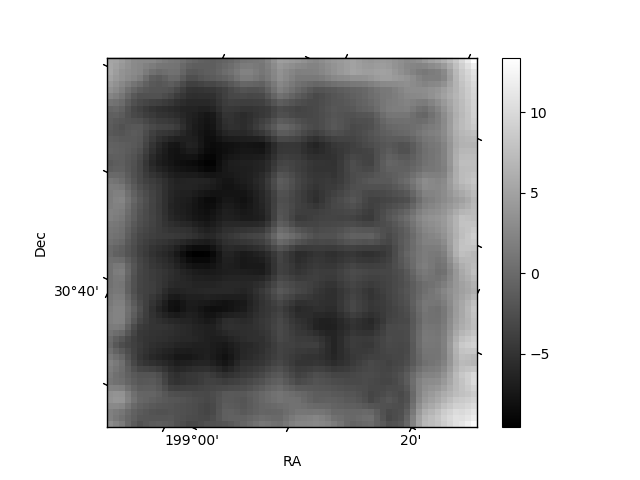
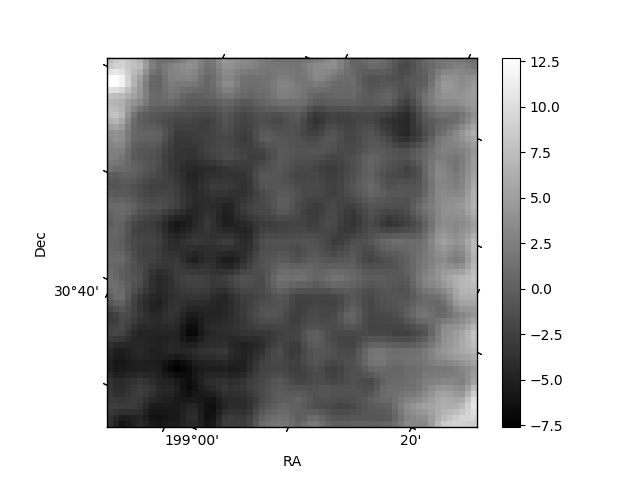
Histogram calculated using DETX and DETY for each event in the final _common_clean file
| Quadrant A | 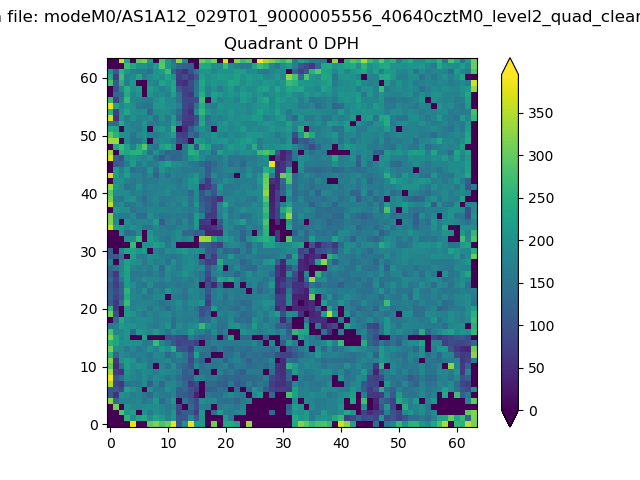 |
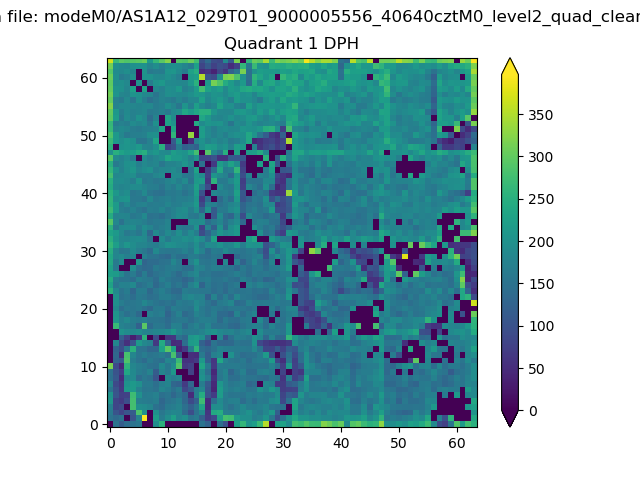 |
Quadrant B |
|---|---|---|---|
| Quadrant D | 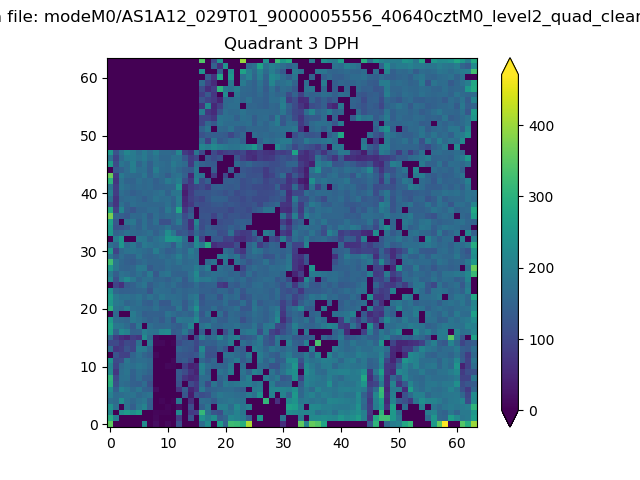 |
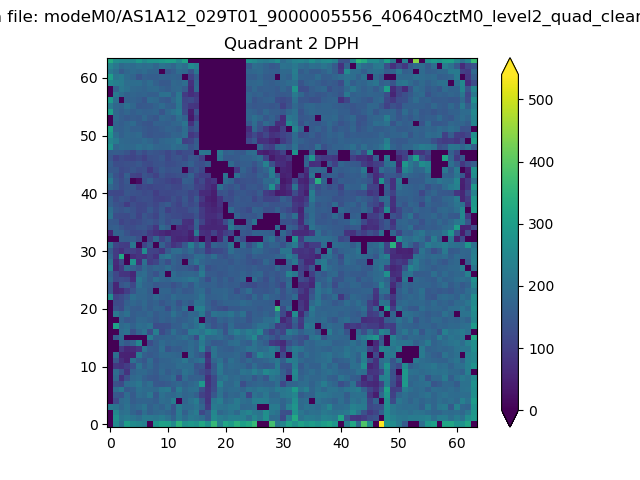 |
Quadrant C |
| Plot type | Count rate plots | Images |
|---|---|---|
| Comparison with Poisson distribution Blue bars denote a histogram of data divided into 1 sec bins. Red curve is a Poisson curve with rate = median count rate of data. |
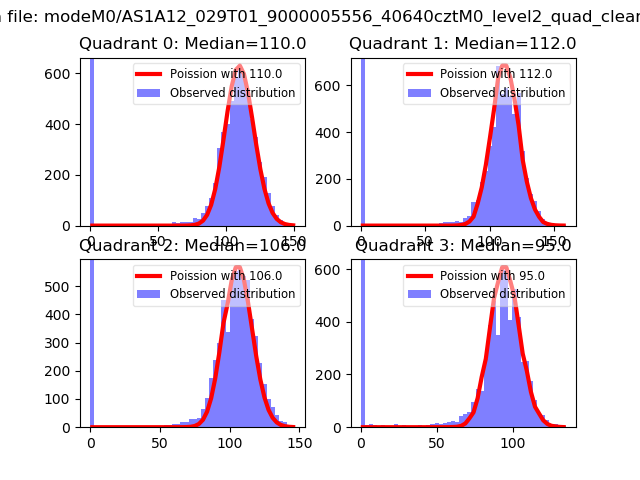 |
 |
| Quadrant-wise count rates Data is divided into 100 sec bins |
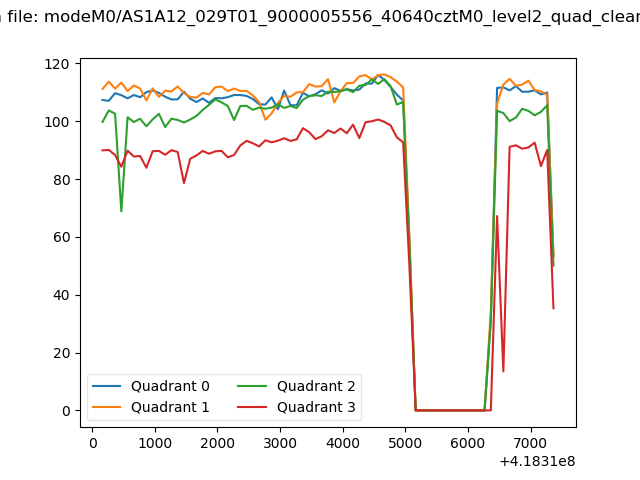 |
|
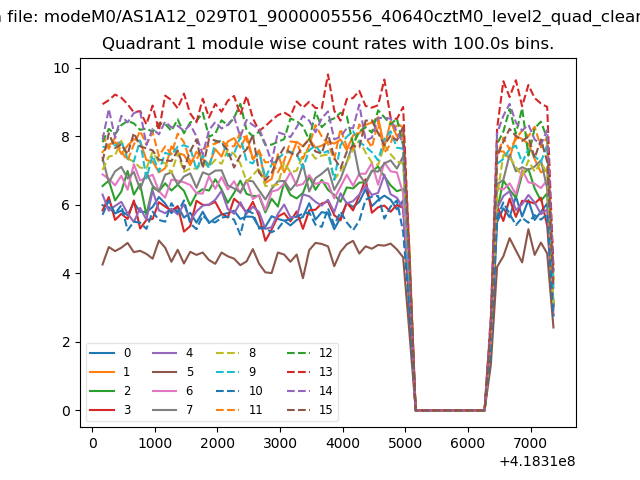
| Module-wise count rates for Quadrant A Data is divided into 100 sec bins |
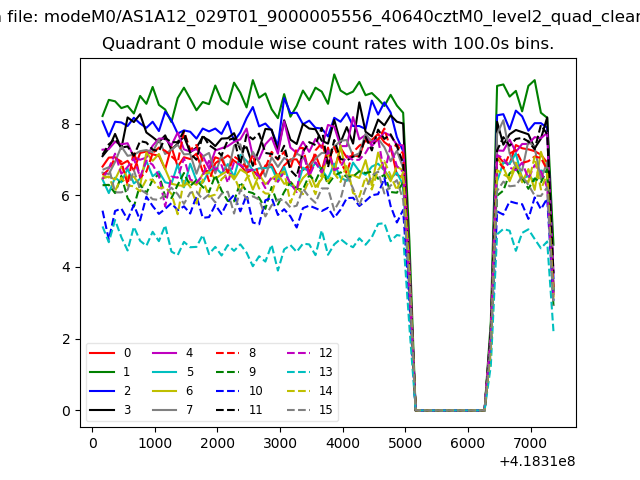 |
 |
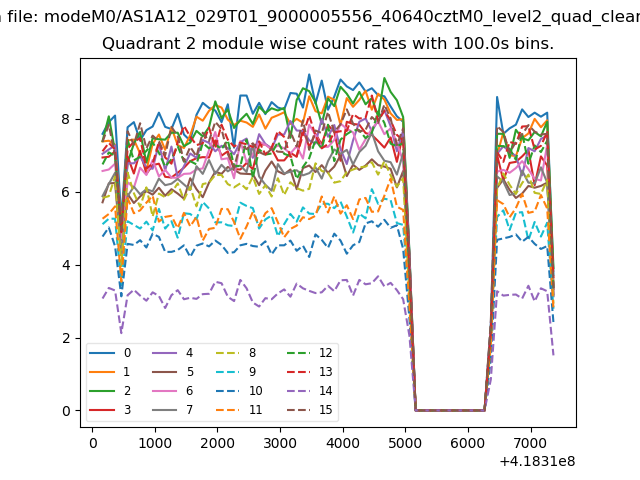
| Module-wise count rates for Quadrant B Data is divided into 100 sec bins |
 |
 |
| Module-wise count rates for Quadrant C Data is divided into 100 sec bins |
 |
 |
| Module-wise count rates for Quadrant D Data is divided into 100 sec bins |
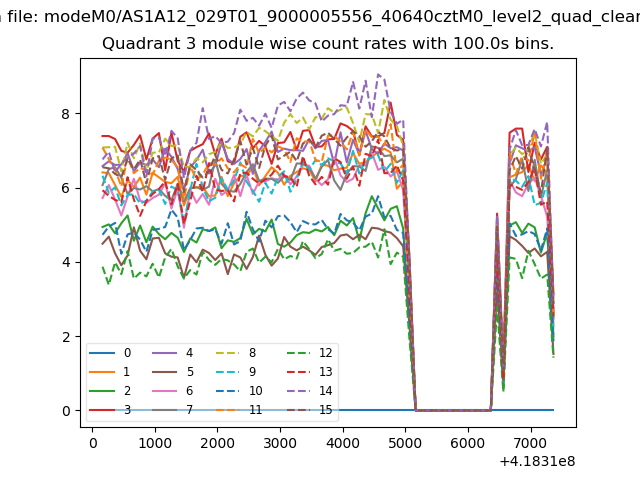 |
 |
| Parameter | Plot |
|---|---|
| CZT HV Monitor | 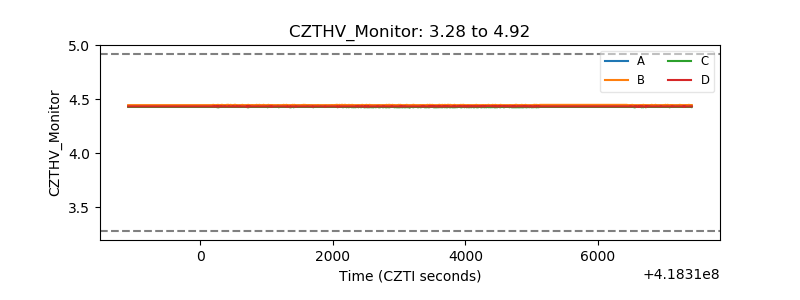 |
| D_VDD | 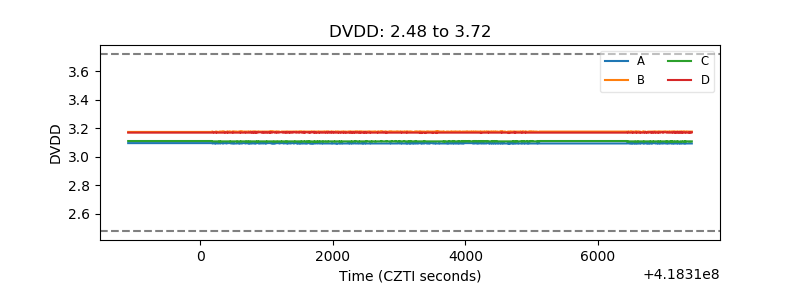 |
| Temperature 1 | 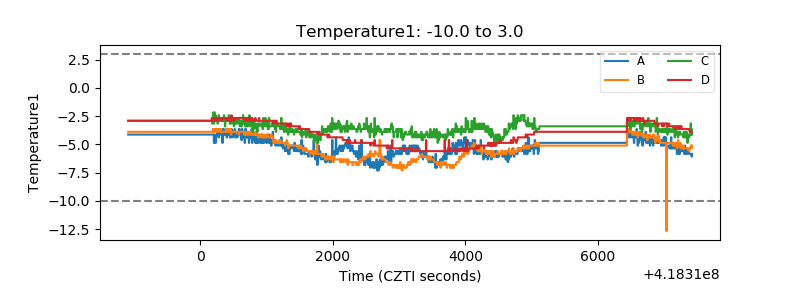 |
| Veto HV Monitor | 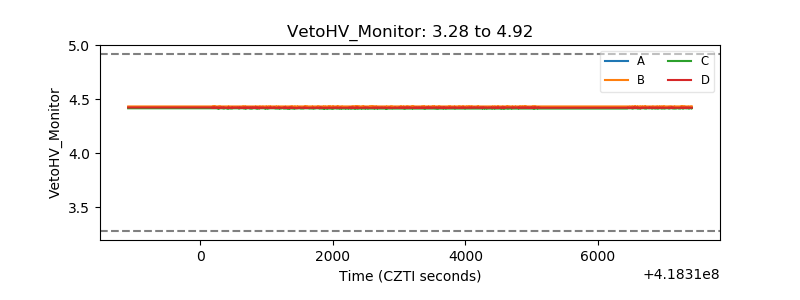 |
| Veto LLD |  |
| Alpha Counter | 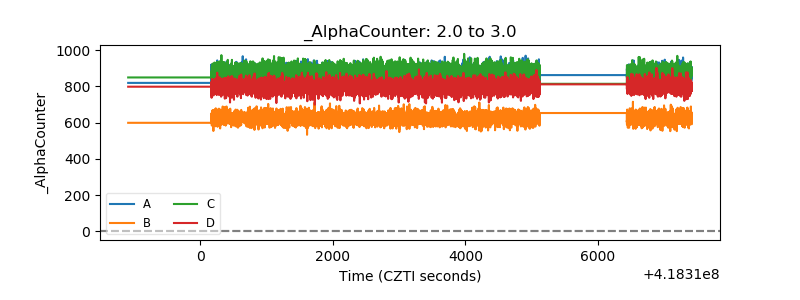 |
| _CPM_Rate | 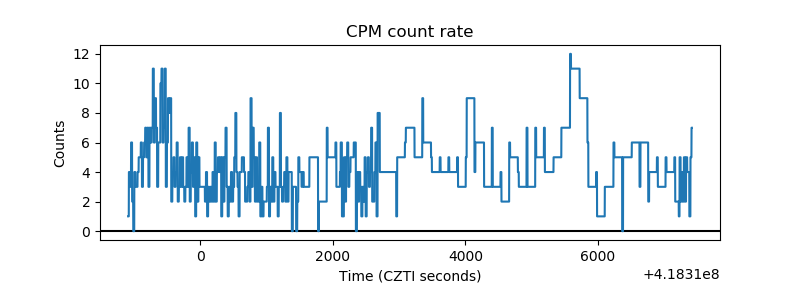 |
| CZT Counter | 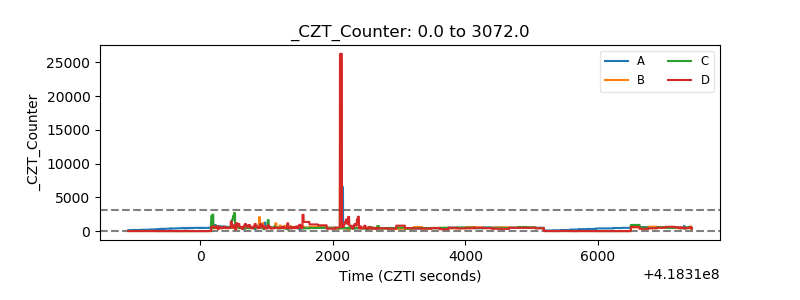 |
| +2.5 Volts monitor | 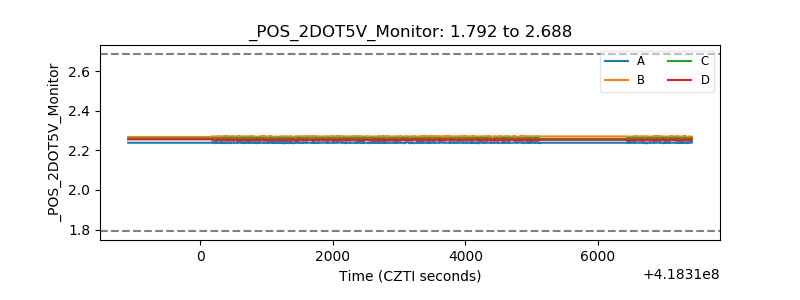 |
| +5 Volts monitor | 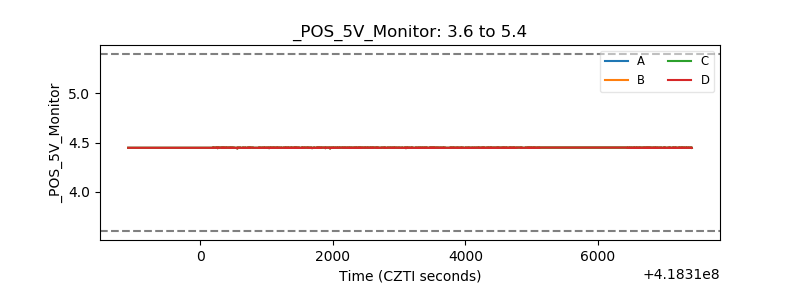 |
| _ROLL_ROT | 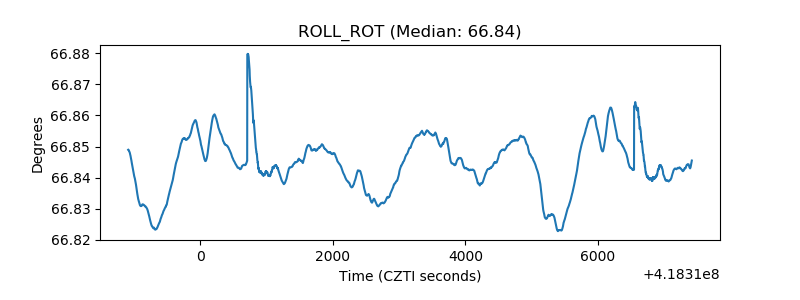 |
| _Roll_DEC | 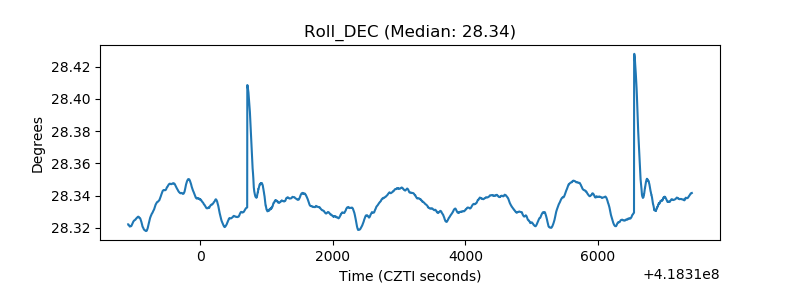 |
| _Roll_RA | 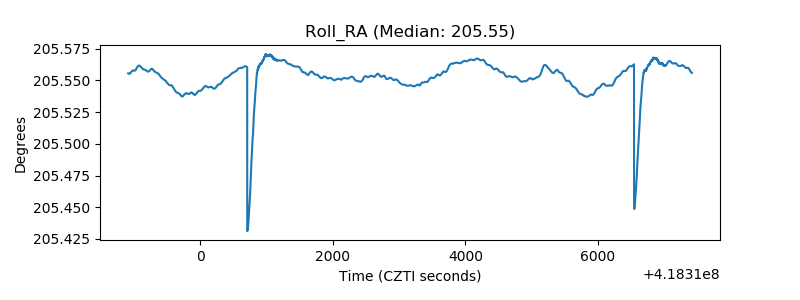 |
| Veto Counter | 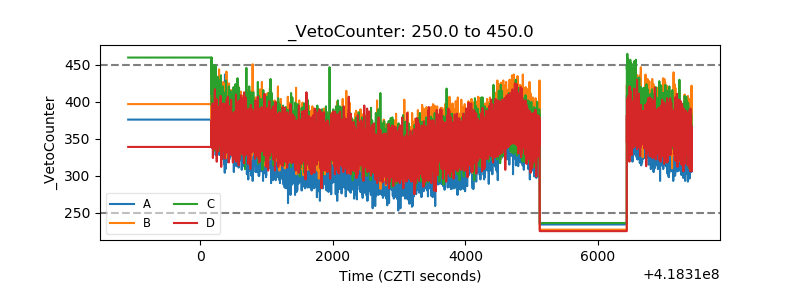 |