| Param | Original file | Final file |
|---|---|---|
| Filename | modeM0/AS1A12_029T01_9000005556_40643cztM0_level2.fits | modeM0/AS1A12_029T01_9000005556_40643cztM0_level2_quad_clean.evt |
| Size (bytes) | 964,946,880 | 250,853,760 |
| Size | 920.2 MB | 239.2 MB |
| Events in quadrant A | 8,009,611 | 1,712,113 |
| Events in quadrant B | 8,943,297 | 1,745,141 |
| Events in quadrant C | 7,768,306 | 1,680,497 |
| Events in quadrant D | 9,752,734 | 1,350,739 |
| Mode M0 | |||
|---|---|---|---|
| Quadrant | BADHDUFLAG | Total packets | Discarded packets |
| A | 0 | 33926 | 5 |
| B | 0 | 37563 | 4 |
| C | 0 | 33385 | 4 |
| D | 0 | 40245 | 4 |
| Mode M9 | |||
|---|---|---|---|
| Quadrant | BADHDUFLAG | Total packets | Discarded packets |
| A | 0 | 56 | 0 |
| B | 0 | 56 | 0 |
| C | 0 | 56 | 0 |
| D | 0 | 56 | 0 |
| Mode SS | |||
|---|---|---|---|
| Quadrant | BADHDUFLAG | Total packets | Discarded packets |
| A | 0 | 328 | 0 |
| B | 0 | 328 | 0 |
| C | 0 | 328 | 0 |
| D | 0 | 328 | 0 |
| Quadrant | Total seconds | Saturated seconds | Saturation percentage |
|---|---|---|---|
| A | 16042 | 33 | 0.205710% |
| B | 16042 | 301 | 1.876325% |
| C | 16042 | 61 | 0.380252% |
| D | 16042 | 2488 | 15.509288% |
Noise dominated data is calculated using 1-second bins in cleaned event files. If a bin has >2000 counts, and if more than 50% of those come from <1% of pixels, then it is considered to be noise-dominated and hence unusable.
| Quadrant | # 1 sec bins | Bins with >0 counts | Bins with >2000 counts | High rate bins dominated by noise | Noise dominated (total time) | Noise dominated (detector-on time) | Marked lightcurve |
|---|---|---|---|---|---|---|---|
| A | 21594 | 16046 | 5 | 5 | 0.02% | 0.03% | 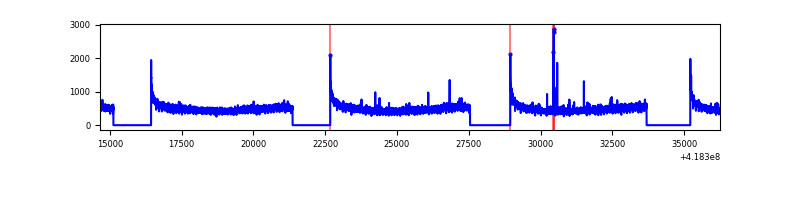 |
| B | 21594 | 16046 | 187 | 187 | 0.87% | 1.17% | 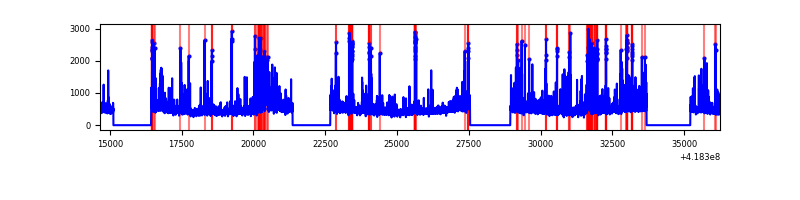 |
| C | 21594 | 16046 | 43 | 43 | 0.20% | 0.27% | 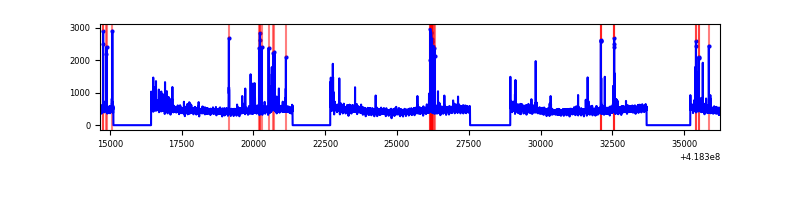 |
| D | 21594 | 16046 | 195 | 195 | 0.90% | 1.22% | 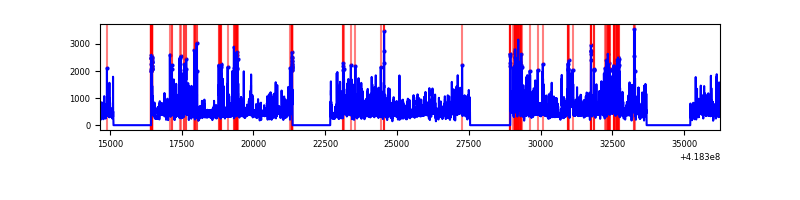 |
Top three noisy pixels from each quadrant. If the there are fewer than three noisy pixels in the level2.evt file, extra rows are filled as -1
| Pixel properties | Quadrant properties | ||||||
|---|---|---|---|---|---|---|---|
| Quadrant | DetID | PixID | Counts | Sigma | Mean | Median | Sigma |
| A | 10 | 83 | 1213962 | 3400.49 | 1744 | 1707 | 356.5 |
| A | 2 | 79 | 58074 | 158.11 | 1744 | 1707 | 356.5 |
| A | 3 | 137 | 20280 | 52.1 | 1744 | 1707 | 356.5 |
| B | 0 | 190 | 990933 | 2982.07 | 1723 | 1668 | 331.7 |
| B | 0 | 229 | 796511 | 2396.0 | 1723 | 1668 | 331.7 |
| B | 5 | 255 | 288736 | 865.35 | 1723 | 1668 | 331.7 |
| C | 15 | 214 | 690813 | 1729.22 | 1706 | 1714 | 398.5 |
| C | 14 | 254 | 318775 | 795.63 | 1706 | 1714 | 398.5 |
| C | 12 | 249 | 57258 | 139.38 | 1706 | 1714 | 398.5 |
| D | 12 | 227 | 1170091 | 3065.68 | 1553 | 1513 | 381.2 |
| D | 2 | 120 | 732029 | 1916.46 | 1553 | 1513 | 381.2 |
| D | 12 | 191 | 632664 | 1655.78 | 1553 | 1513 | 381.2 |
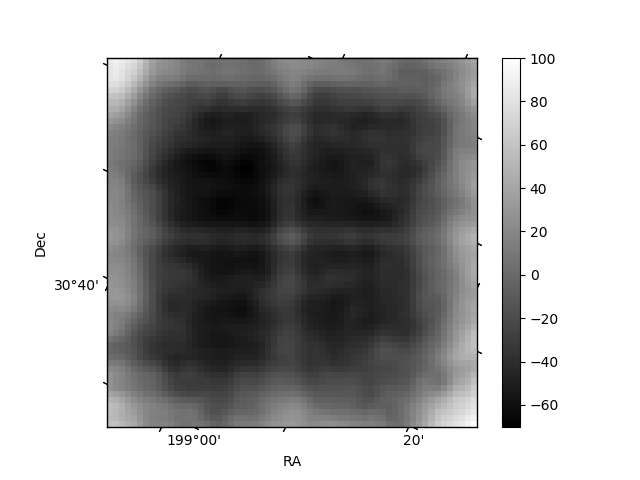
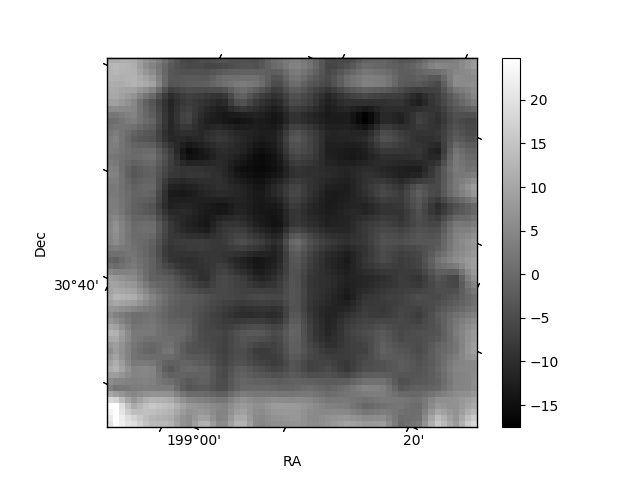
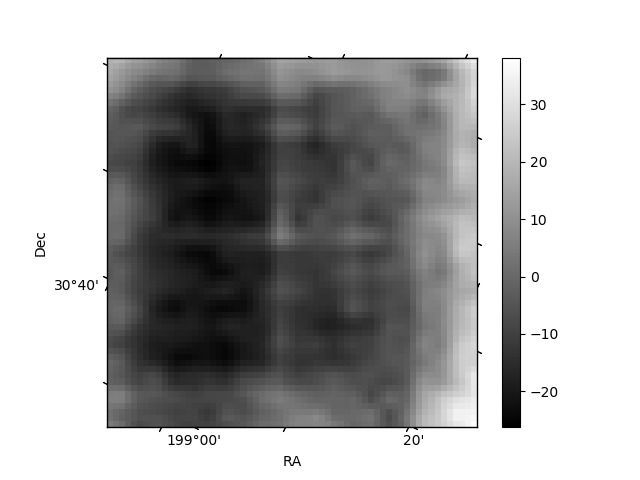
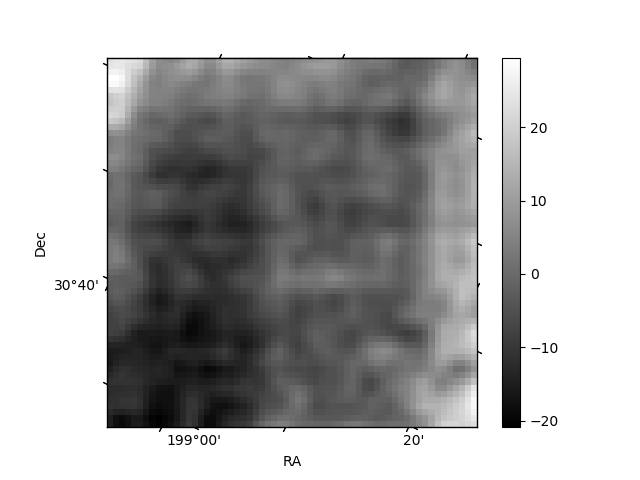
Histogram calculated using DETX and DETY for each event in the final _common_clean file
| Quadrant A | 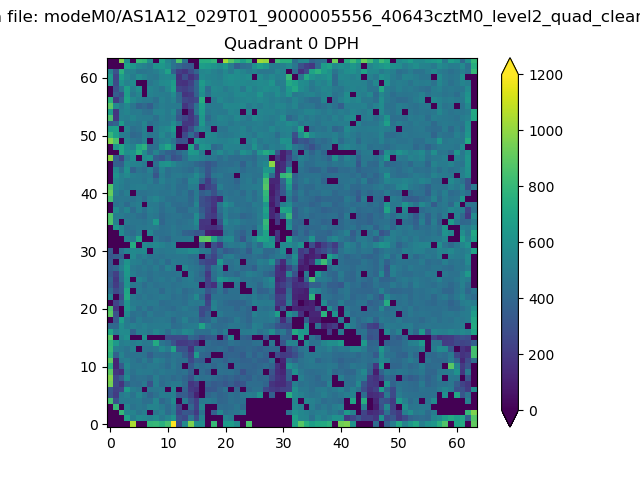 |
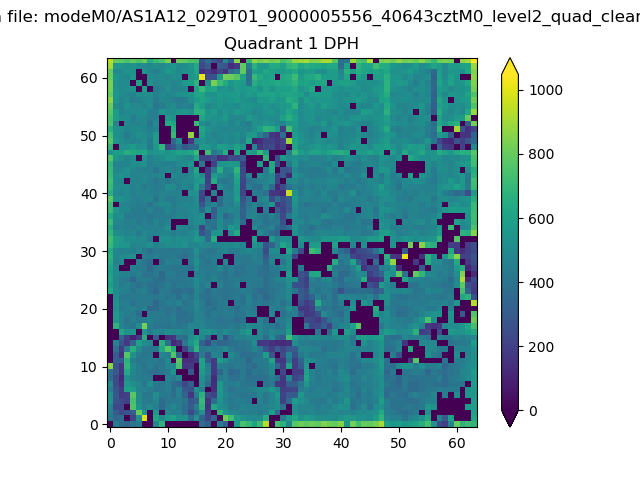 |
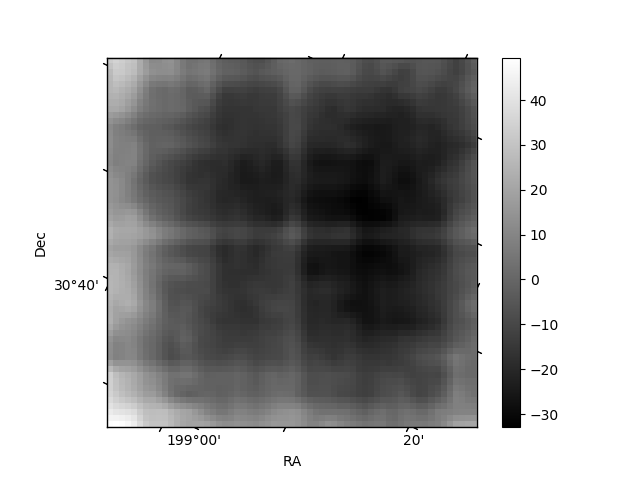
Quadrant B |
|---|---|---|---|
| Quadrant D | 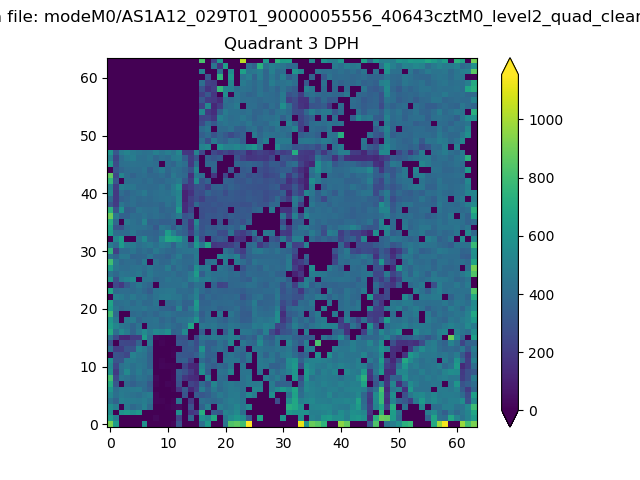 |
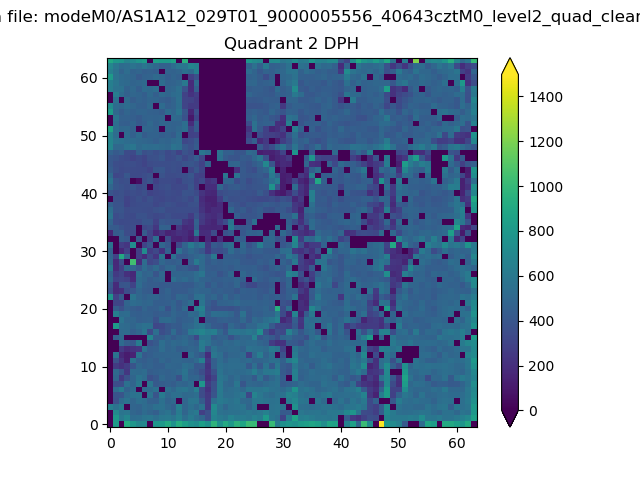 |
Quadrant C |
| Plot type | Count rate plots | Images |
|---|---|---|
| Comparison with Poisson distribution Blue bars denote a histogram of data divided into 1 sec bins. Red curve is a Poisson curve with rate = median count rate of data. |
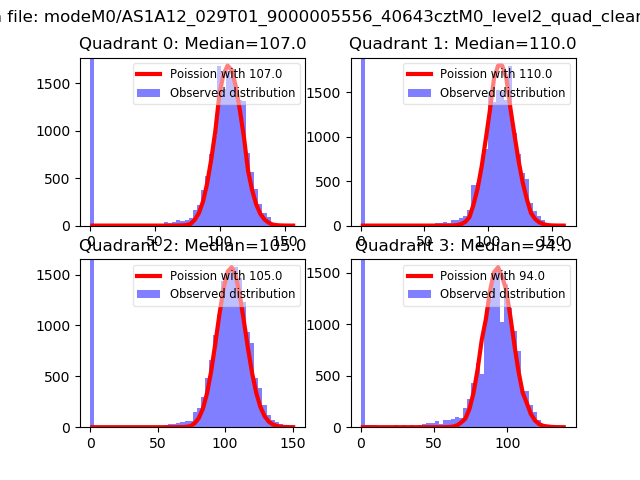 |
 |
| Quadrant-wise count rates Data is divided into 100 sec bins |
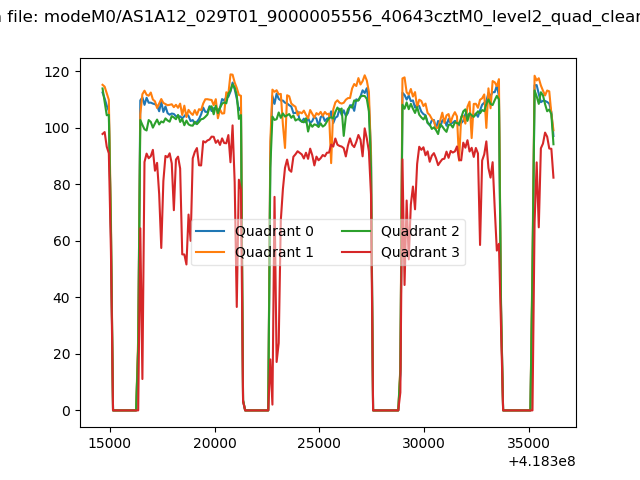 |
|
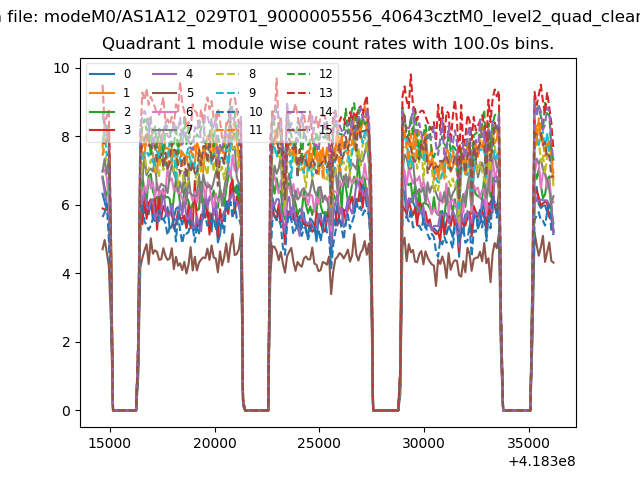
| Module-wise count rates for Quadrant A Data is divided into 100 sec bins |
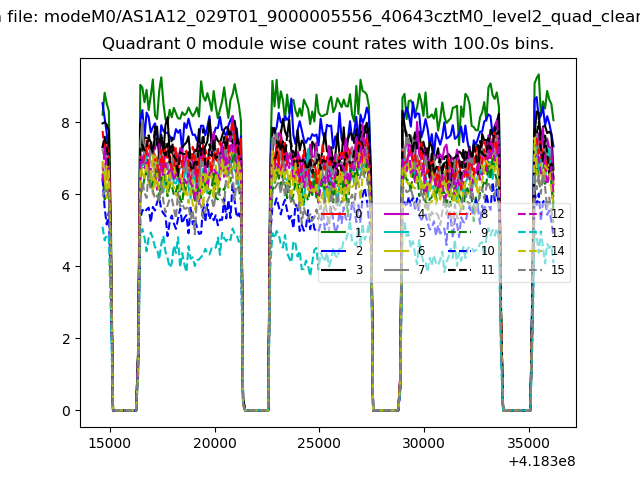 |
 |
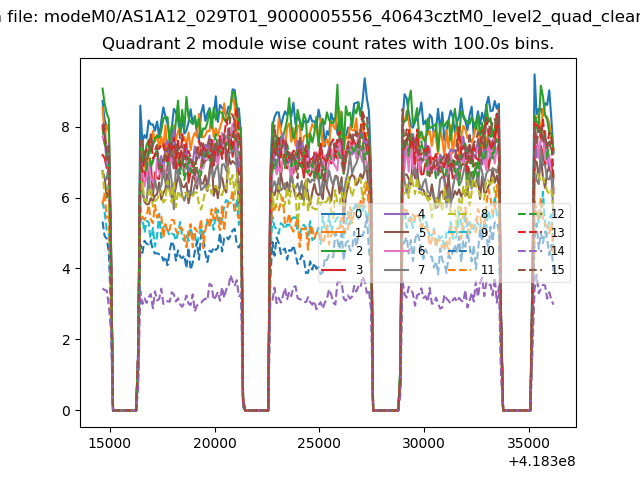
| Module-wise count rates for Quadrant B Data is divided into 100 sec bins |
 |
 |
| Module-wise count rates for Quadrant C Data is divided into 100 sec bins |
 |
 |
| Module-wise count rates for Quadrant D Data is divided into 100 sec bins |
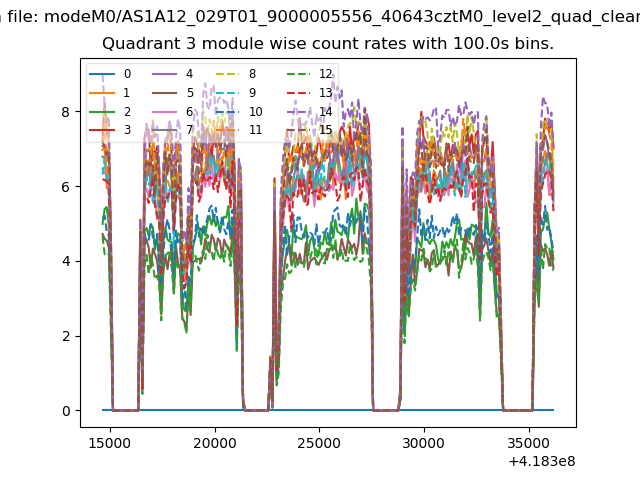 |
 |
| Parameter | Plot |
|---|---|
| CZT HV Monitor | 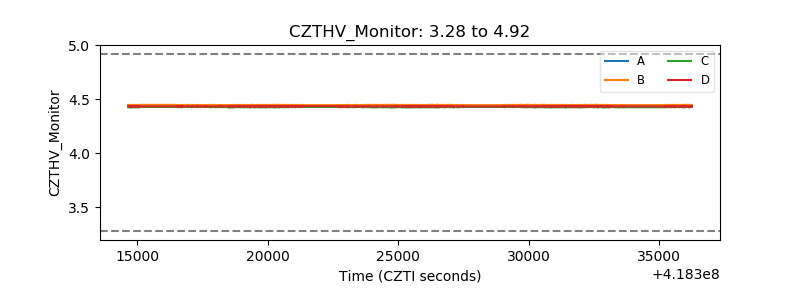 |
| D_VDD | 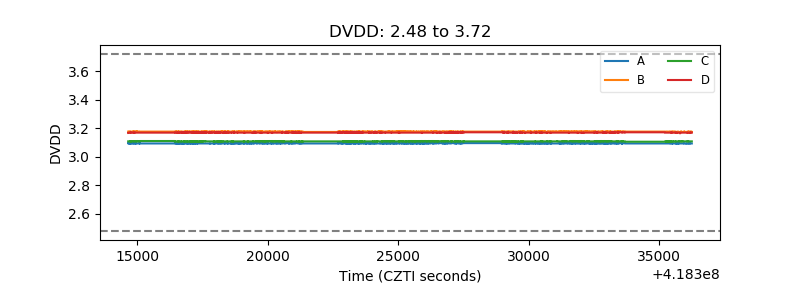 |
| Temperature 1 | 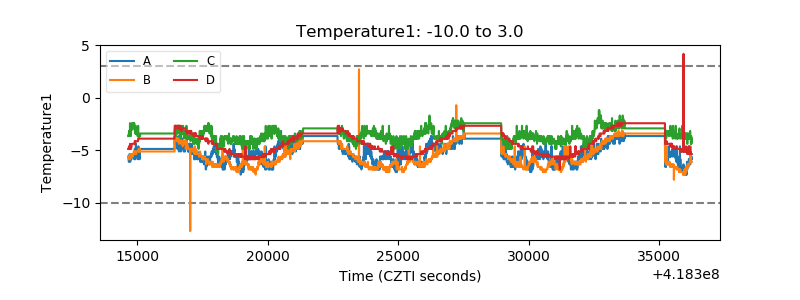 |
| Veto HV Monitor | 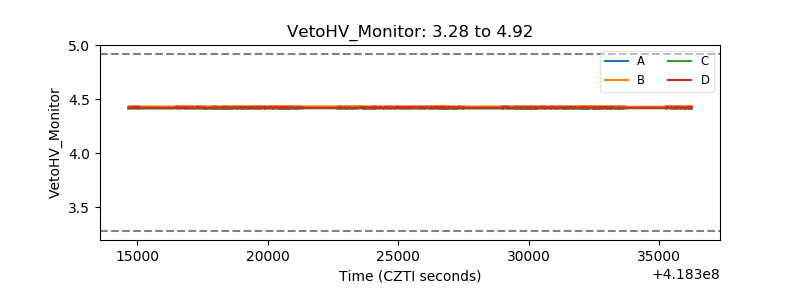 |
| Veto LLD | 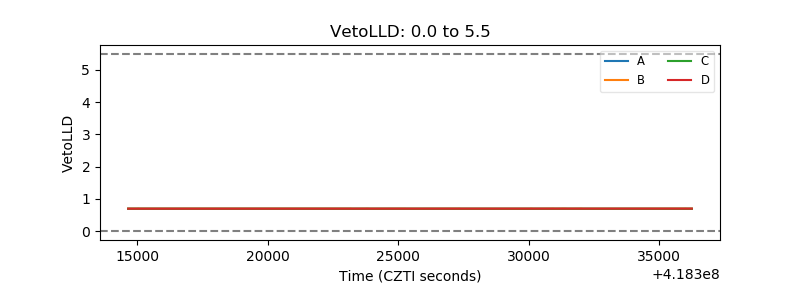 |
| Alpha Counter | 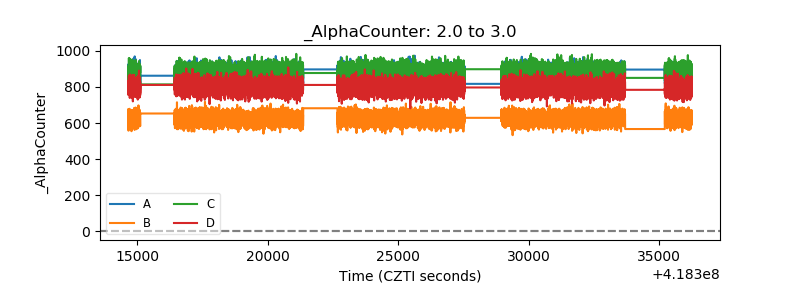 |
| _CPM_Rate | 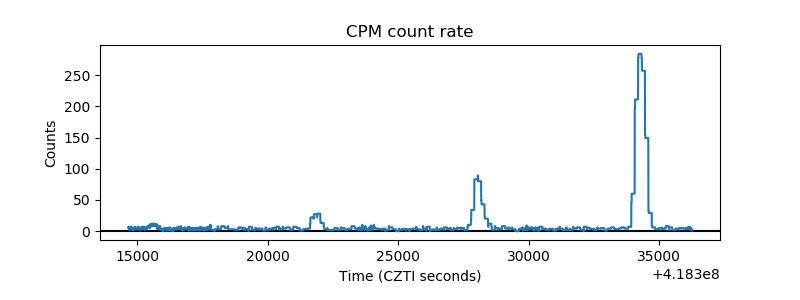 |
| CZT Counter | 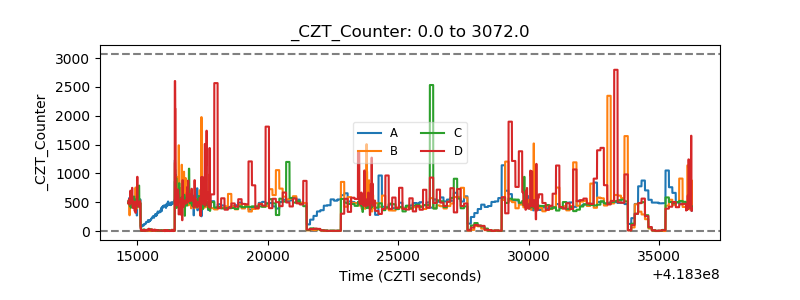 |
| +2.5 Volts monitor | 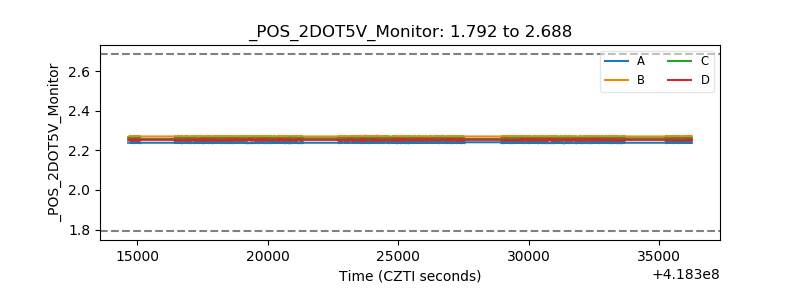 |
| +5 Volts monitor | 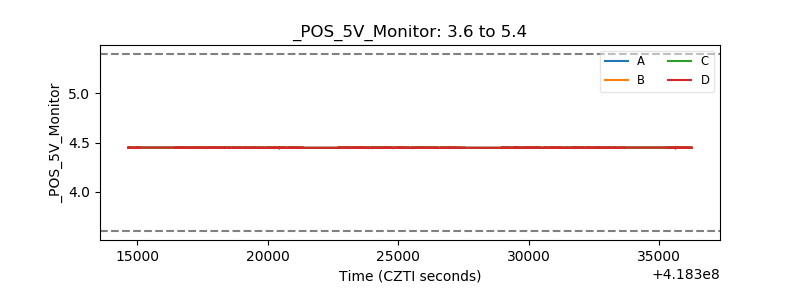 |
| _ROLL_ROT | 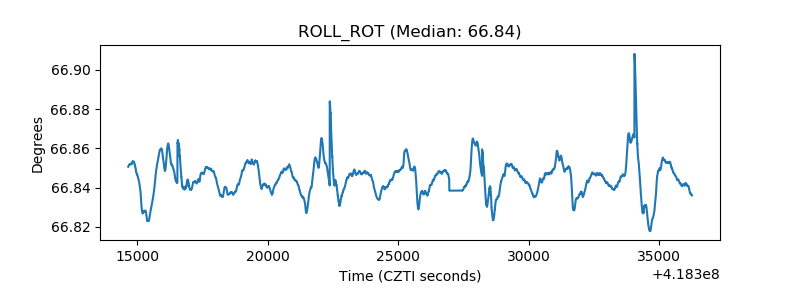 |
| _Roll_DEC | 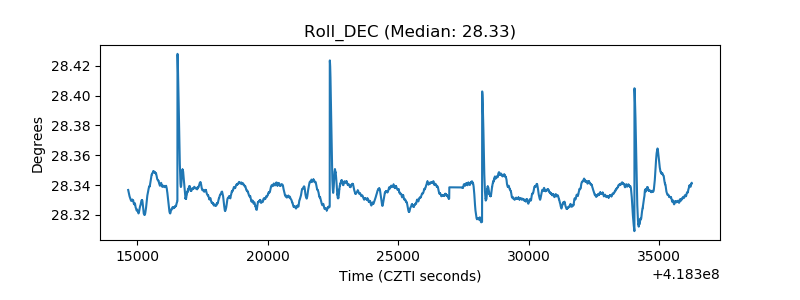 |
| _Roll_RA |  |
| Veto Counter | 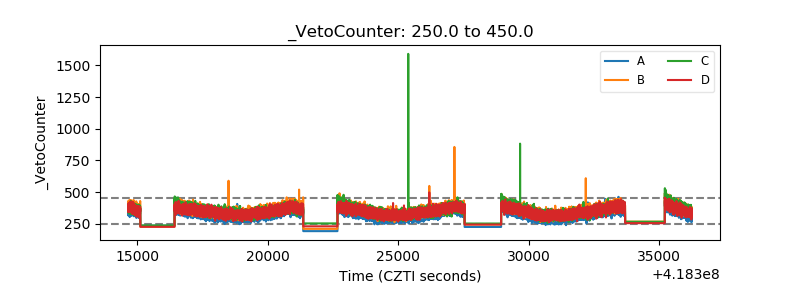 |