| Param | Original file | Final file |
|---|---|---|
| Filename | modeM0/AS1A12_029T01_9000005556_40644cztM0_level2.fits | modeM0/AS1A12_029T01_9000005556_40644cztM0_level2_quad_clean.evt |
| Size (bytes) | 378,529,920 | 86,768,640 |
| Size | 361.0 MB | 82.7 MB |
| Events in quadrant A | 2,857,098 | 620,108 |
| Events in quadrant B | 4,603,124 | 594,219 |
| Events in quadrant C | 3,088,333 | 602,335 |
| Events in quadrant D | 3,019,739 | 413,548 |
| Mode M0 | |||
|---|---|---|---|
| Quadrant | BADHDUFLAG | Total packets | Discarded packets |
| A | 0 | 12124 | 3 |
| B | 0 | 17575 | 2 |
| C | 0 | 12925 | 2 |
| D | 0 | 13069 | 2 |
| Mode M9 | |||
|---|---|---|---|
| Quadrant | BADHDUFLAG | Total packets | Discarded packets |
| A | 0 | 32 | 0 |
| B | 0 | 32 | 0 |
| C | 0 | 32 | 0 |
| D | 0 | 32 | 0 |
| Mode SS | |||
|---|---|---|---|
| Quadrant | BADHDUFLAG | Total packets | Discarded packets |
| A | 0 | 116 | 0 |
| B | 0 | 116 | 0 |
| C | 0 | 116 | 0 |
| D | 0 | 116 | 0 |
| Quadrant | Total seconds | Saturated seconds | Saturation percentage |
|---|---|---|---|
| A | 5672 | 9 | 0.158674% |
| B | 5672 | 535 | 9.432299% |
| C | 5672 | 147 | 2.591678% |
| D | 5672 | 1678 | 29.583921% |
Noise dominated data is calculated using 1-second bins in cleaned event files. If a bin has >2000 counts, and if more than 50% of those come from <1% of pixels, then it is considered to be noise-dominated and hence unusable.
| Quadrant | # 1 sec bins | Bins with >0 counts | Bins with >2000 counts | High rate bins dominated by noise | Noise dominated (total time) | Noise dominated (detector-on time) | Marked lightcurve |
|---|---|---|---|---|---|---|---|
| A | 8868 | 5674 | 2 | 2 | 0.02% | 0.04% | 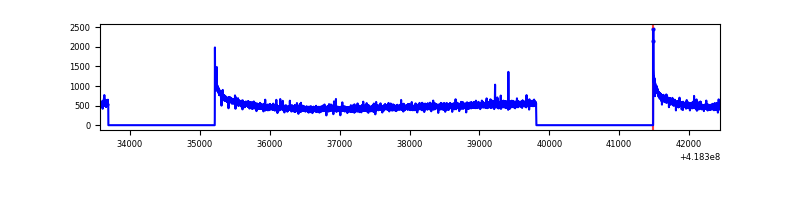 |
| B | 8867 | 5673 | 393 | 393 | 4.43% | 6.93% | 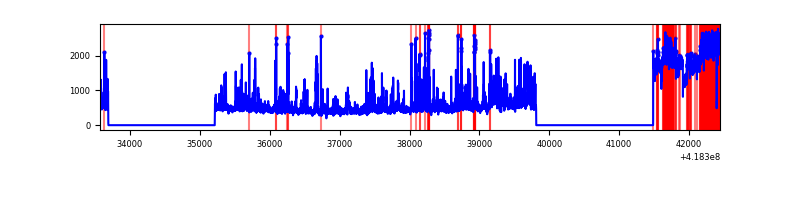 |
| C | 8868 | 5674 | 127 | 127 | 1.43% | 2.24% | 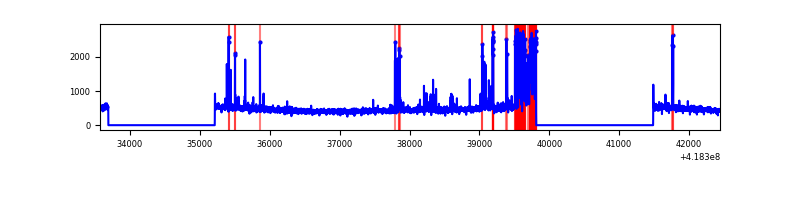 |
| D | 8868 | 5674 | 9 | 9 | 0.10% | 0.16% | 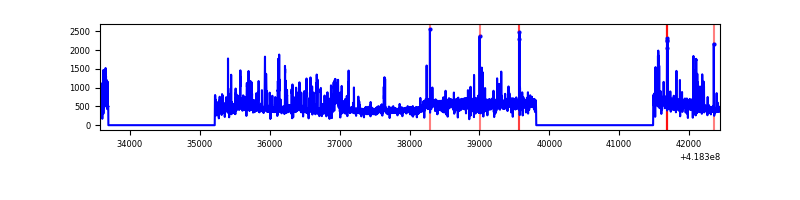 |
Top three noisy pixels from each quadrant. If the there are fewer than three noisy pixels in the level2.evt file, extra rows are filled as -1
| Pixel properties | Quadrant properties | ||||||
|---|---|---|---|---|---|---|---|
| Quadrant | DetID | PixID | Counts | Sigma | Mean | Median | Sigma |
| A | 10 | 83 | 477886 | 3813.76 | 612 | 600 | 125.1 |
| A | 2 | 79 | 8415 | 62.45 | 612 | 600 | 125.1 |
| A | 3 | 137 | 6832 | 49.8 | 612 | 600 | 125.1 |
| B | 7 | 202 | 1395326 | 11995.17 | 597 | 581 | 116.3 |
| B | 0 | 190 | 469523 | 4033.02 | 597 | 581 | 116.3 |
| B | 0 | 229 | 307037 | 2635.6 | 597 | 581 | 116.3 |
| C | 14 | 254 | 501901 | 3583.22 | 597 | 600 | 139.9 |
| C | 15 | 214 | 244995 | 1746.9 | 597 | 600 | 139.9 |
| C | 0 | 239 | 4677 | 29.14 | 597 | 600 | 139.9 |
| D | 12 | 191 | 320996 | 2462.24 | 528 | 512 | 130.2 |
| D | 12 | 227 | 303716 | 2329.48 | 528 | 512 | 130.2 |
| D | 12 | 79 | 239855 | 1838.84 | 528 | 512 | 130.2 |
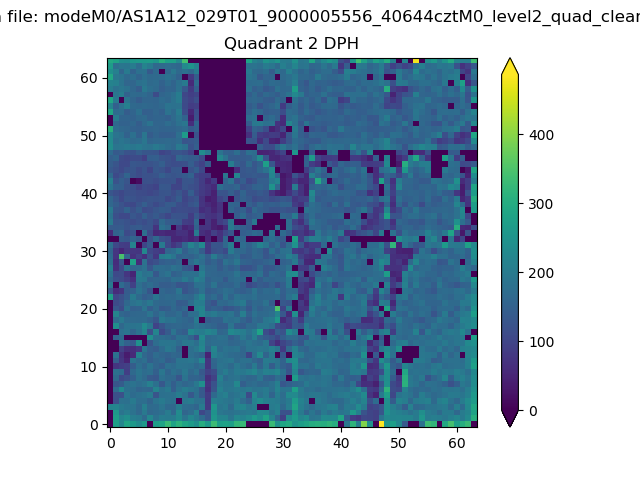
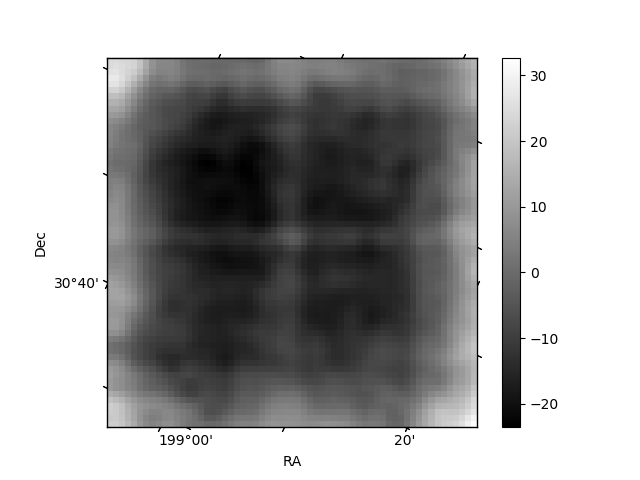
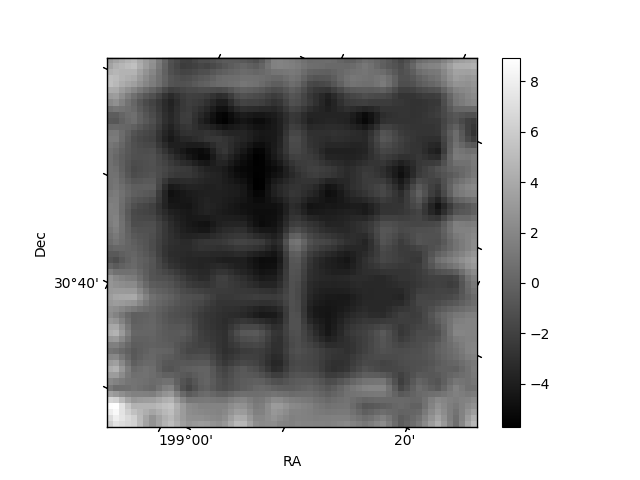
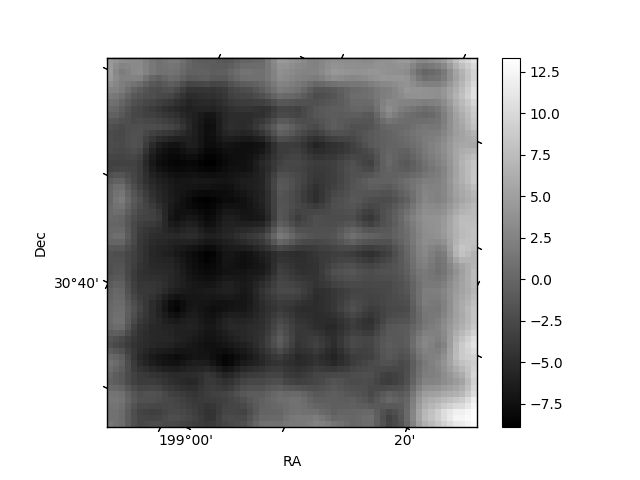
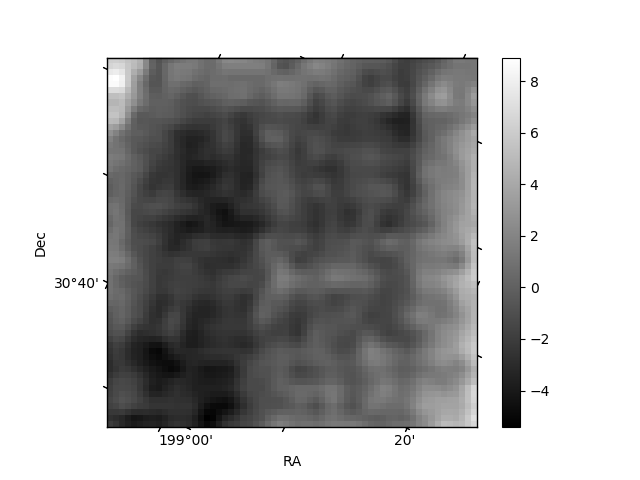
Histogram calculated using DETX and DETY for each event in the final _common_clean file
| Quadrant A | 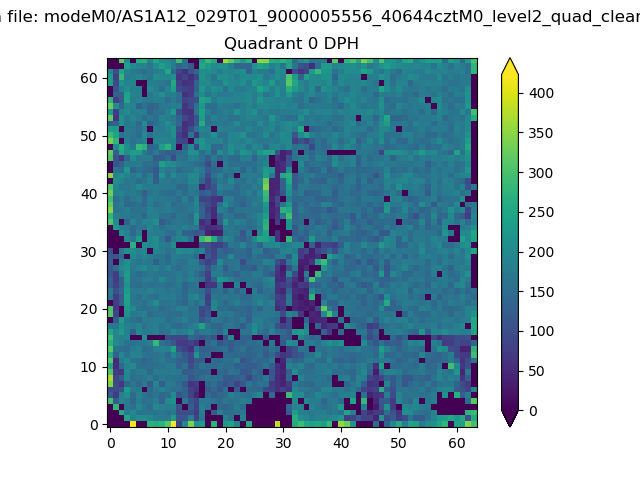 |
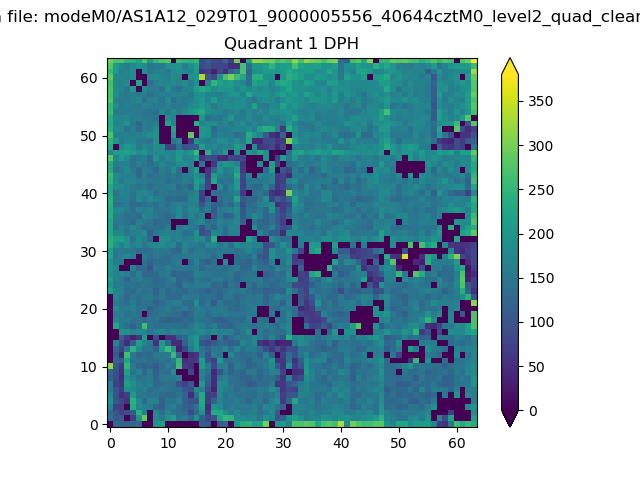 |
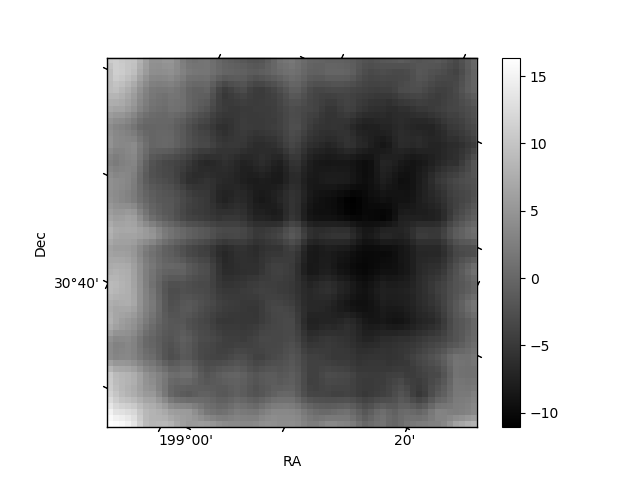
Quadrant B |
|---|---|---|---|
| Quadrant D | 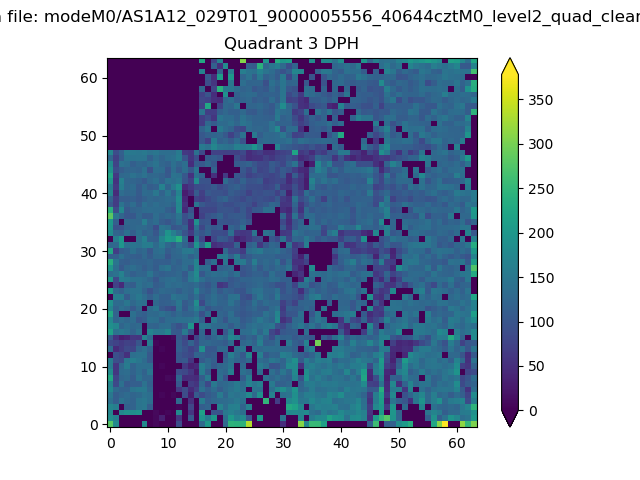 |
 |
Quadrant C |
| Plot type | Count rate plots | Images |
|---|---|---|
| Comparison with Poisson distribution Blue bars denote a histogram of data divided into 1 sec bins. Red curve is a Poisson curve with rate = median count rate of data. |
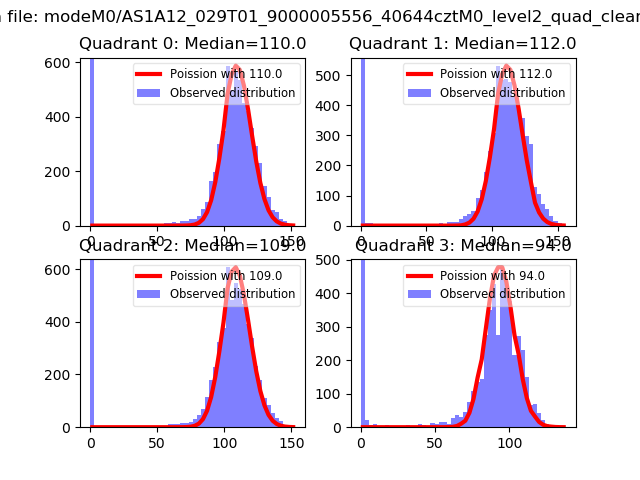 |
 |
| Quadrant-wise count rates Data is divided into 100 sec bins |
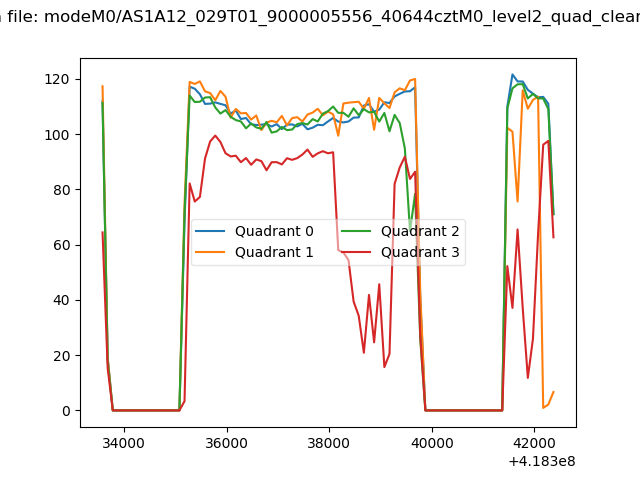 |
|
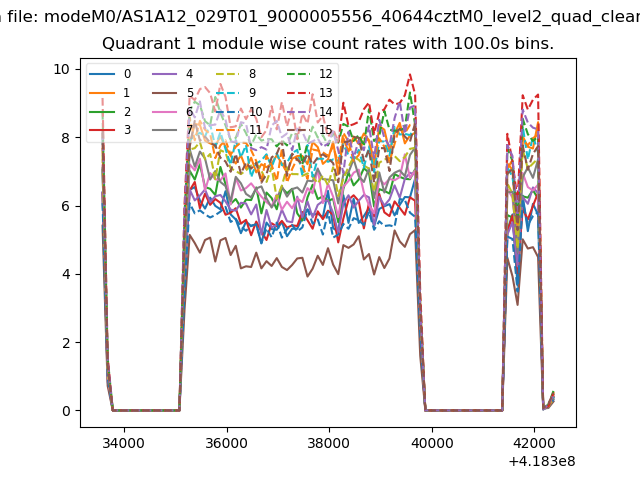
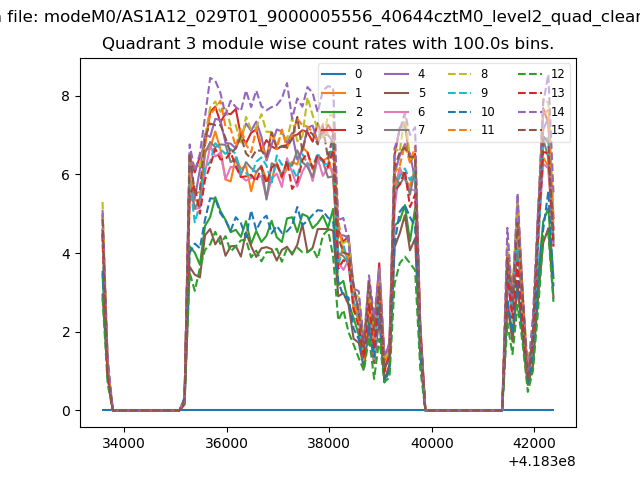
| Module-wise count rates for Quadrant A Data is divided into 100 sec bins |
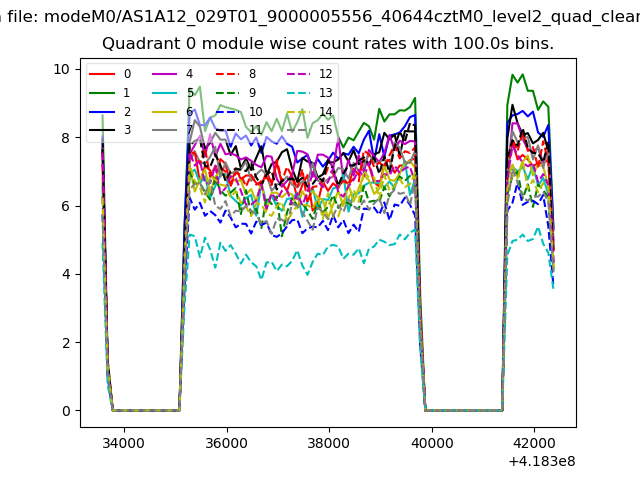 |
 |
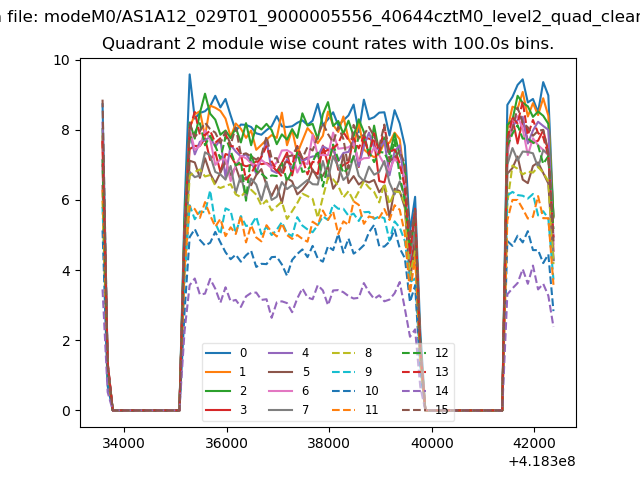
| Module-wise count rates for Quadrant B Data is divided into 100 sec bins |
 |
 |
| Module-wise count rates for Quadrant C Data is divided into 100 sec bins |
 |
 |
| Module-wise count rates for Quadrant D Data is divided into 100 sec bins |
 |
 |
| Parameter | Plot |
|---|---|
| CZT HV Monitor | 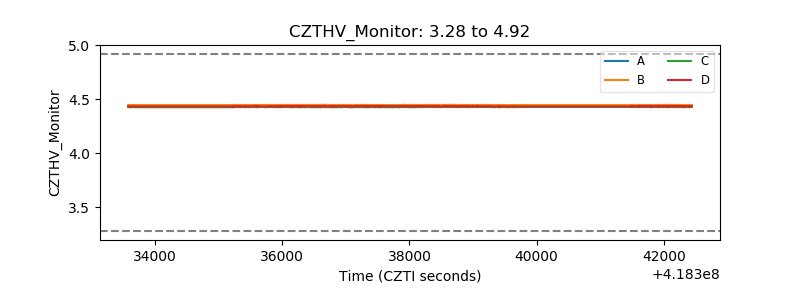 |
| D_VDD | 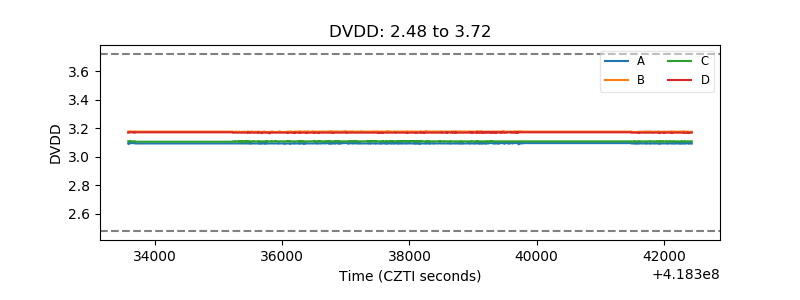 |
| Temperature 1 | 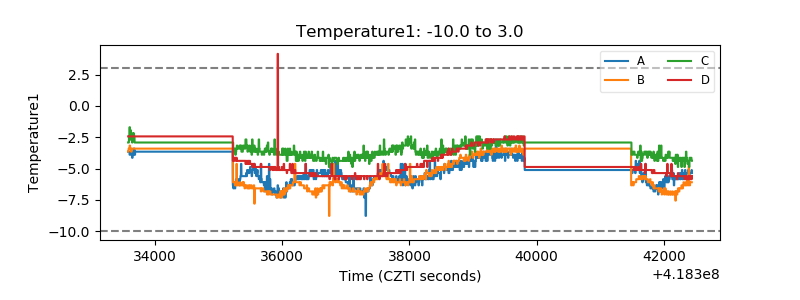 |
| Veto HV Monitor | 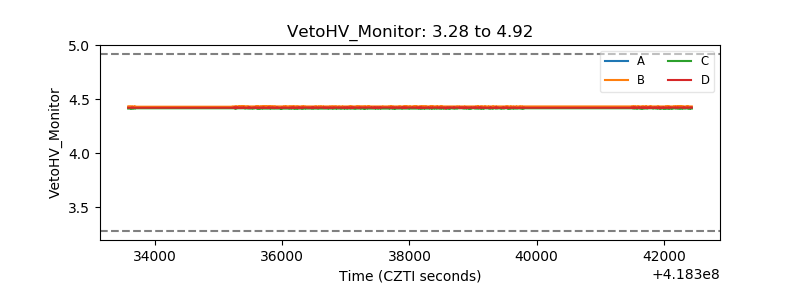 |
| Veto LLD | 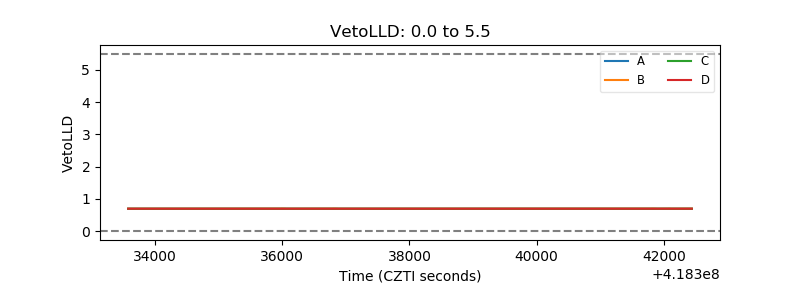 |
| Alpha Counter | 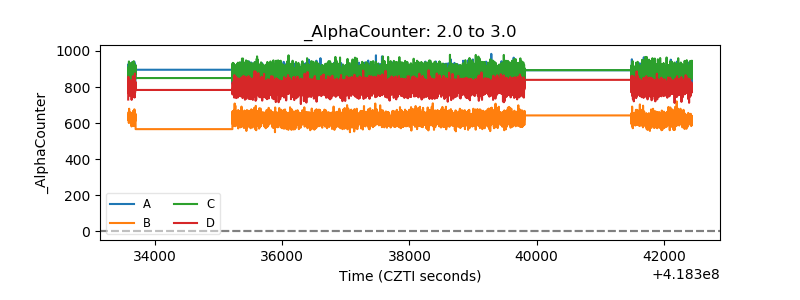 |
| _CPM_Rate | 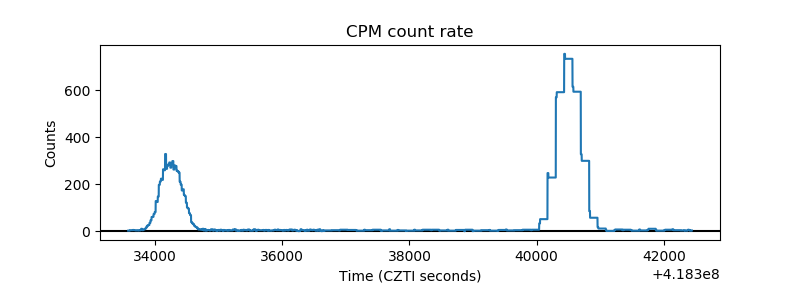 |
| CZT Counter | 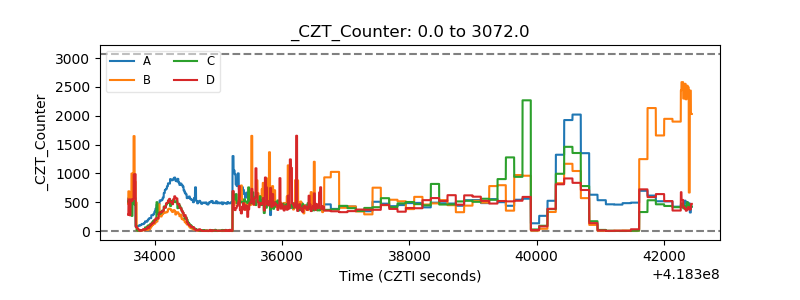 |
| +2.5 Volts monitor | 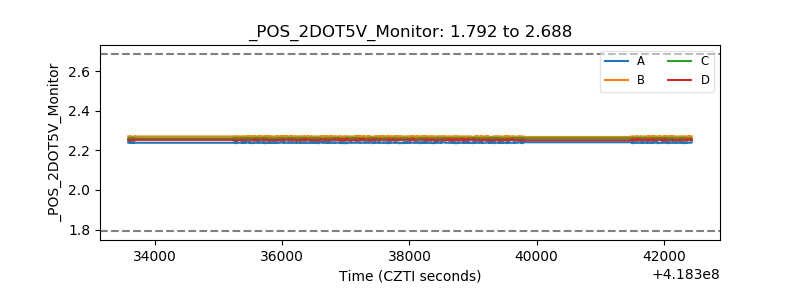 |
| +5 Volts monitor | 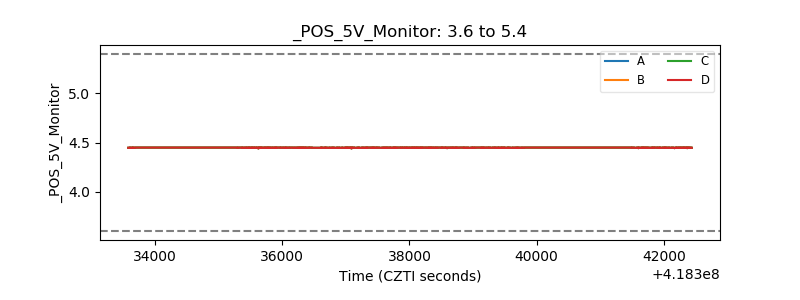 |
| _ROLL_ROT | 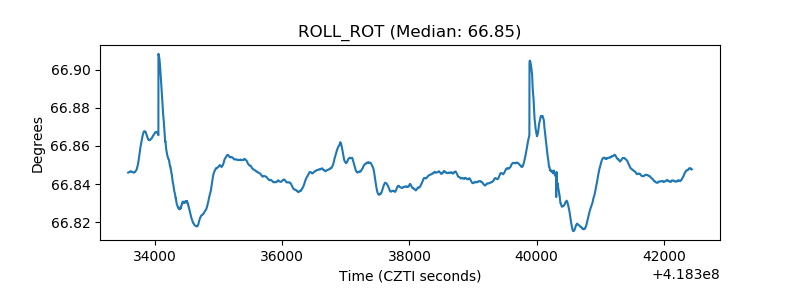 |
| _Roll_DEC | 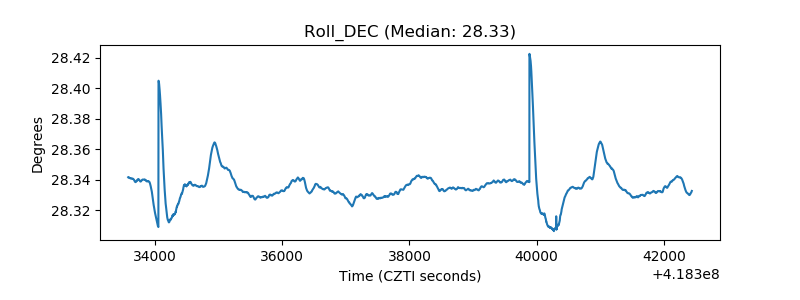 |
| _Roll_RA | 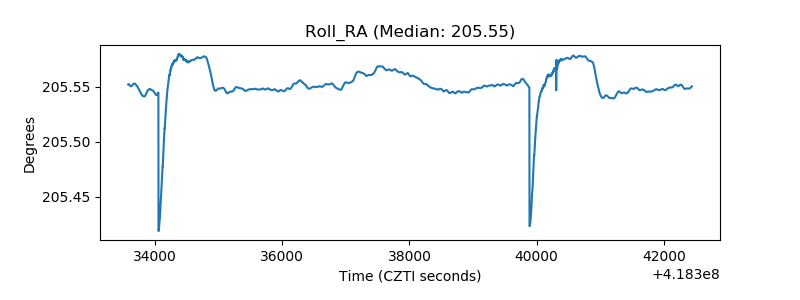 |
| Veto Counter | 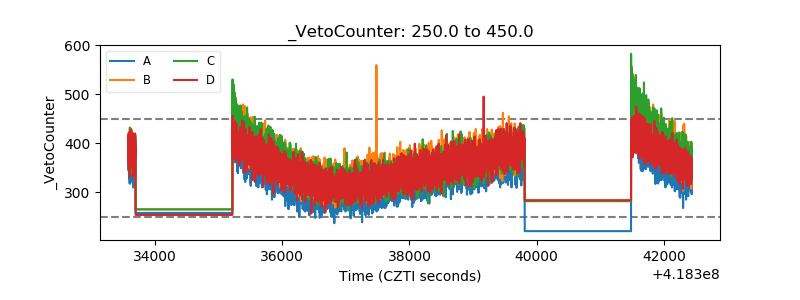 |